

Productivity metrics are concepts that act as data points to measure, analyze, and present how employees or departments are performing. In other words, they measure employee productivity and indicate how each team contributes toward business goals.
Studying productivity metrics like asset utilization, hours worked, or overtime hours builds transparency into your team’s productivity. It helps pinpoint which resources are plateauing or advancing your projects.
It’s a simple input-out relation, showing how your company’s output is affected by its inputs.
We’ve created a guide that explains the impact of productivity metrics and Key Performance Indicators (KPIs) on your internal and external business processes. 👇
15 Productivity Metrics to Boost Your Team’s Performance
- What are Productivity Metrics?
- What is the Importance of Productivity Metrics?
- 15 Examples of Productivity Metrics and KPIs
- 1. Employee Turnover Rate (ETR)
- 2. Revenue Per Sales Rep
- 3. Inventory Accuracy
- 4. Average Handling Time (AHT)
- 5. Task Completion Rate
- 6. Overtime Hours
- 7. Sales Growth
- 8. Innovation Rate
- 9. First Contact Resolution (FCR)
- 10. Website Traffic-to-Lead Ratio
- 11. Part-Time vs Full-Time Productivity
- 12. Goal Conversion Rate
- 13. Lead-to-MQL Ratio
- 14. Recruiting Conversion Rate
- 15. Average Investment in Training Each Employee
- How to Set and Measure Productivity Metrics
- Productivity Metrics and Goal Setting
- FAQs
What are Productivity Metrics?
Productivity metrics are quantifiable measures that gauge employees’ performance in specific areas and how their activities contribute to organizational goals.
These metrics offer easily digestible numerical and visual insights into areas needing improvement or complete revamps.
For example, suppose team A spends 30 hours on a three-day project with 12 employees. Team B finishes the same project in two days with two fewer employees. Breaking down employee productivity metrics gives business leaders a different view of how and why Team B yields higher than Team A.
What is the Importance of Productivity Metrics?
You must measure productivity to review your team’s progress against your business goals. From units produced and revenue generated to procurement-oriented tasks, these essential metrics provide accurate information to steer teams away from failure and closer to quality service, customer satisfaction, and improved profit margins.
The relationship between productivity metrics and performance indicators can produce a range of efficiency-related data points. They can integrate quantitative and qualitative insights and contribute to the overall measures of a company’s performance.
Continuous monitoring and acting to boost productivity helps upgrade overall team outputs, helping improve business performance.
Now, look at some of the top productivity metrics and key performance indicators that help you measure progress.
15 Examples of Productivity Metrics and KPIs
The long trail of productivity metrics and KPIs can be overwhelming. Take your time to decide which of these common productivity metrics can take your business to the next level. 👇
1. Employee Turnover Rate (ETR)
The employee turnover rate measures the percentage of employees leaving an organization within a specific period. It is expressed as a percentage of the staff strength. This metric also gauges the quality of your recruitment policies and employee satisfaction levels.
Reports suggest that the employee turnover rates have been 20% higher post-pandemic.
While a turnover rate below 10% is considered reasonable, a higher turnover rate reflects a negative impression of company culture and can indicate a demotivated and unproductive workforce.
👉 Here’s how you can calculate ETR:
Employee Turnover Rate = [T /{(B+E)/2}] X100
Here,
T is the no. of Terminations during a period
B is the no. of Employees at the beginning of the period
E is the no. of employees at the end of the period
2. Revenue Per Sales Rep
This productivity metric calculates how much revenue per employee the sales team members bring in.
Sales teams are competitive by nature. Therefore, using sales productivity metrics may help foster healthy competition amongst your team.
However, provide ambitious, realistic sales targets to encourage your team to go the extra mile to generate revenue.
Comparing the performance of each sales rep based on parameters like seniority and targets achieved puts you in an educated spot for a fair evaluation.
👉 Here’s a quick formula to calculate this metric:
Revenue Per Sales Rep = Total sales / No. of sales made by the sales rep
3. Inventory Accuracy
The inventory accuracy metric measures the level of inconsistency between actual and recorded inventory. Tracking and improving this metric reinforces your impression as a trustworthy vendor.
A higher inventory accuracy results from spot-on bookkeeping practices and efficient warehouse management. It also indicates the effectiveness of your on-field team responsible for inventory management.
You must maintain a high score in such quality metrics to bring a spike in your customer satisfaction and sales figures.
👉 Here’s a formula to calculate inventory accuracy:
Inventory Accuracy = (Counted items / Items on record) x 100
4. Average Handling Time (AHT)
Average handling time measures the average time spent to resolve a pending customer query or support issue.
AHT is commonly used for measuring productivity in customer service and support teams. It has four main objectives:
- Spot top performers or proactive members of your team
- Identify low-performing members and help them improve via training sessions
- Understand fluctuations in AHT as signals of team stress or work overload
- Ensure high responsiveness toward customers to maintain customer satisfaction
Simply put, this employee productivity metric measures how efficiently your team resolves customer queries without sacrificing Quality of Service (QoS).
👉 Calculate AHT using this formula:
Average Handling Time = (Total talk time + Hold time + Follow-up time) / Total No. of calls
5. Task Completion Rate
The task completion rate measures the percentage of tasks completed against those assigned within a given time.
This productivity measurement metric is a litmus test for operational efficiency. It helps spot disruptions in workflows and gaps in team capacity.
If you’re struggling with piled-up tasks, it’s time to redistribute workloads or investigate deeper issues like unclear task prioritization, inefficient employee utilization, work overload, or insufficient resources.
👉 Here’s how to calculate the task completion rate:
Task Completion Rate = (No. of completed tasks) / (Total no. of tasks) x 100
An agile way of dealing with a lower task completion rate is to assign story points for each task. Story points are weightage assigned to every task based on difficulty and expected completion time.
Story points let you analyze beforehand how long each task will take. Most importantly, it gives you an overview of individual team members’ workload and productivity levels.
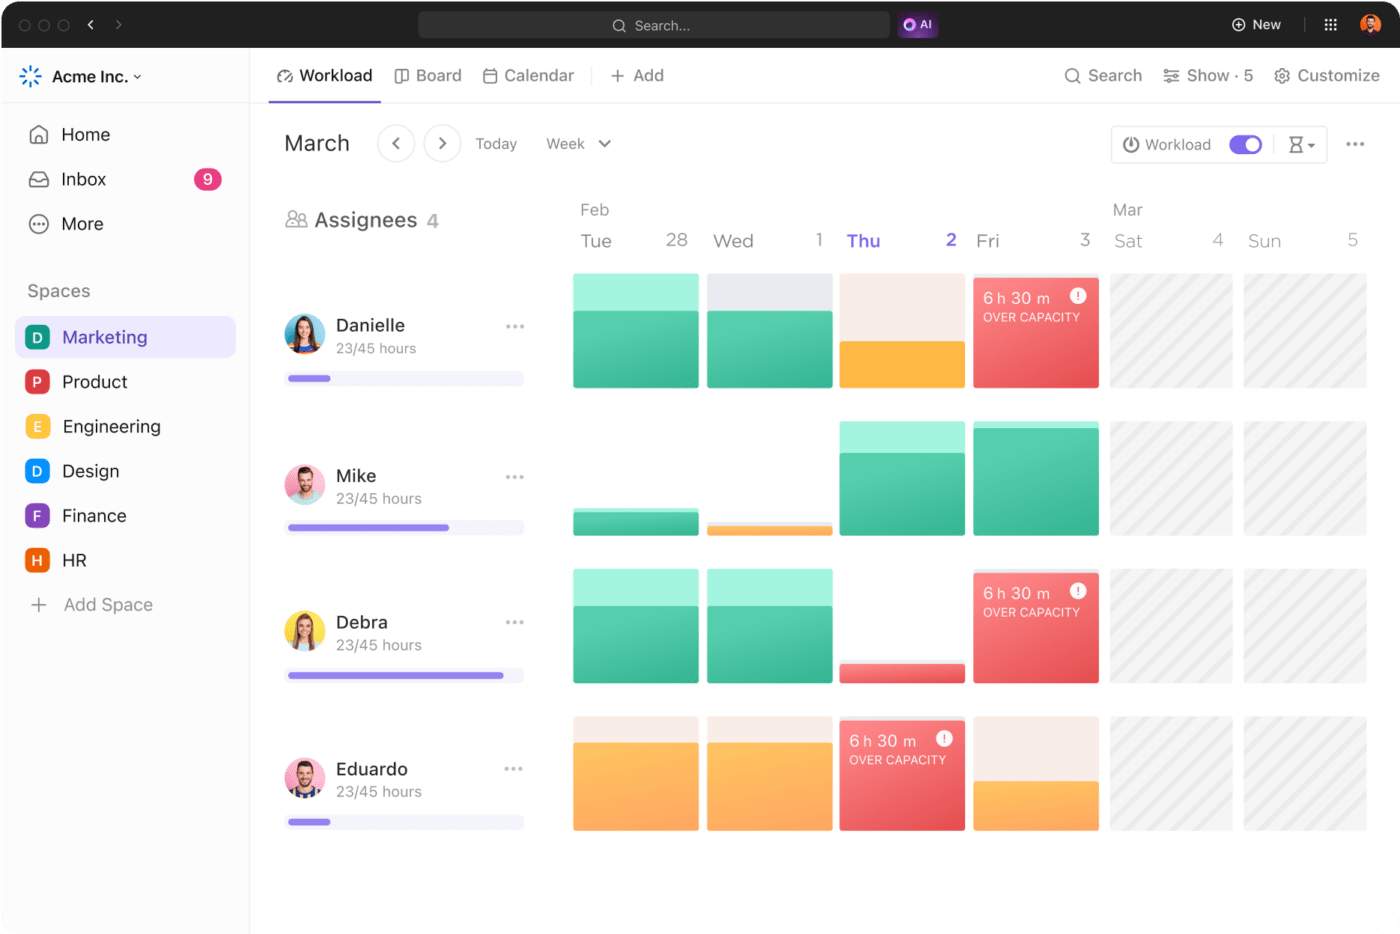
Use ClickUp for Operations Teams to meet your task management needs. It makes it easy to manage tasks via customizable views and dashboards. Additionally, you can use AI to auto-assign subtasks and generate summaries for communication threads to reduce your team’s manual workload.
🎁Bonus: Consider creating a productivity plan using tailored templates and watch how ClickUp auto-fills fields to input all progress in a click.
6. Overtime Hours
Overtime hours are the extra hours an employee invests apart from their standard scheduled working hours.
Longer overtime hours indicate poor workload distribution, an unhealthy work culture, and inefficient team management. Even one of these factors is enough to cause a drop in overall employee productivity.
Track this metric to identify resource gaps and hiring needs. For example, more overtime hours in your marketing department may indicate you require a larger workforce there.
Similarly, you can use this metric to track employee productivity and allocate workload based on an employee’s capacity.
👉 You can calculate the overtime hours by dividing the number of overtime hours by the number of regular working hours.
Overtime Hours = (Overtime Hours) / (Regular Hours) x 100
7. Sales Growth
Sales growth measures the ability of your sales team to increase your monthly, quarterly, or annual sales performance.
This metric offers insights into your company’s revenue growth rate. Consider adding filters for month-long periods to get access to micro-level data. This can inform you of how individual sales representatives perform across blocks of time.
Use this metric to identify which sales funnels yield the highest conversions.
👉 Here’s how you can calculate sales growth:
Sales growth = [(Current net sales – Prior sales period net sales) / Prior sales period net sales] x 100
8. Innovation Rate
Although not a key performance indicator, innovation rates speak volumes about your team’s creativity. It lets you calculate the frequency of new ideas initiated within a period vs. those executed successfully.
Higher innovation rates signal a dynamic team that stays on the front foot with risk-taking and innovations. Remember that higher rates don’t always indicate higher team productivity. Still, converting ideas into reality or processes is a unique measure of productivity.
👉 Here’s a simple formula to measure your team’s innovation rate:
Innovation Rate = (No. of Ideas Launched Successfully/Total No. of Proposed Ideas)*100
💡Tip: Use ClickUp Brain and ClickUp Whiteboards to conduct team ideation and brainstorming sessions and score a higher innovation rate.
ClickUp Brain acts as your AI assistant to brainstorm ideas. While ClickUp Whiteboards bridge the gap between brainstorming and getting work done.
Use them to brainstorm new ideas and then plan your way to execute them via intuitive mind maps and diagrams.

9. First Contact Resolution (FCR)
This productivity metric is also called first call resolution and works best for IT support and call center teams. It analyzes the quantity of customer inquiries resolved by a customer service agent within the initial customer interaction. The intent here is to avoid the time spent on follow-ups and instead work on solving more serious customer inquiries and problems.
Watching your team handle unnecessary extra calls and escalate excessive tickets can be stressful. Track productivity with this metric to balance employee utilization and business performance.
👉 Here’s how you can calculate FCR:
First Contact Resolution = (Resolved incidents on first contact / Total incidents) x 100
A high FCR indicates that your customer service team can quickly resolve customer inquiries as they arrive. This happens when you can increase the authority or decision-making power given to individual employees in customer-facing teams.
10. Website Traffic-to-Lead Ratio
The website traffic-to-lead ratio tracks how many visitors take your desired action after visiting the website. These actions could be anything from signups, purchases, inquiries, redirects, etc.
KPIs and metrics like these generate insights into your brand’s online traffic and the effectiveness of your website marketing strategies.
An increase or decrease in conversion rates across time periods also explains what’s working and what’s tanking.
👉Calculate your Website Traffic-to-Lead Ratio by dividing the number of website visits by the number of leads generated over a period:
Website Traffic-to-Lead Ratio = (Number of website visits) / (No. of leads generated) x 100
11. Part-Time vs Full-Time Productivity
This metric measures the level of productivity output from your part-time employees against full-timers.
Though you may hire part-timers for contractual projects or to fill in gaps, they may not be as productive as full-time employees. Lack of the right tools or challenges fitting into your brand’s culture could compromise their immediate productivity. Over time, this compounds, and you may lose thousands of dollars in potential earnings.
By measuring this metric, you can track employee performance under classified groups and identify which team members contribute to your organizational goals.
👉 Note: This metric doesn’t have a specific formula. However, a closely related metric is Full-Time Equivalent (FTE).
Full-Time Equivalent FTE = Total Hours Worked by Part-Time and Full-Time Employees / Number of Available Full-Time Hours in a Year
12. Goal Conversion Rate
The goal conversion rate measures the percentage of your desired project’s goals that are met as per schedule.
Higher goal conversion rates indicate your project planning tools and methodologies are doing great. Conversely, lower rates reveal unrealistic project deadlines and scope creep.
Keep in mind that these goals vary significantly in nature. And that this metric is entirely different from the ‘Task Completion Rate.’ Nonetheless, your team’s ability to meet these preset goals defines their work ethic.
👉 Here’s a simple formula to measure goal conversion rate:
Goal Conversion Rate = (No. of goals met on schedule) / (Total no. of goals) x 100
13. Lead-to-MQL Ratio
Marketing qualified leads (MQL) are prospects vetted by the marketing team to confirm their interest in a product or service. These prospects are then pushed to the sales team, which guides them across the purchasing journey.
Start by accumulating leads through social media accounts, website landing pages, email marketing, and paid advertisements. Once your marketing squad matches the personas of the leads to your target audience, they become MQLs.
Higher MQL ratios are a green light for your lead generation departments!
👉 Calculate the Lead-to-MQL Ratio with this simple formula:
Lead to MQL Ratio = (No of MQLs) / (Total no. of leads generated) x 100
14. Recruiting Conversion Rate
This metric defines the percentage of prospective recruits who become employees of your organization.
Recruiting conversion rate provides a broader idea of your talent pool’s response to the job posting. For instance, it proves whether the investments in equipping your hiring team considerably surpass the income from the candidates they hire.
👉 Here’s a formula to calculate the recruiting conversion rate of your hiring team.
Recruiting Conversion Rate = (No. of successful hires) / (No. of candidates who entered the recruitment process) x 100
💡Tip: You can expect a higher recruiting conversion rate if the job perks you offer outshine the average market job offers. On the contrary, a lower recruiting conversion rate is typically due to poor company reviews or an inability to meet average salary expectations.
15. Average Investment in Training Each Employee
This metric measures the average cost incurred by your organization to train new or existing employees. This includes the costs of developing and administering various training programs, such as workshops, seminars, certifications, and other employee development initiatives.
Using the metric, you can assess the efficiency and effectiveness of your employee upskilling initiatives. And whether or not they benefit employee productivity over time.
👉 Use this formula to calculate your average investment in employee training:
Average Investment on Training Each Employee = (Total training investment / No. of employees trained)
How to Set and Measure Productivity Metrics
Measuring productivity goals involves several variables, such as time, people across the employee hierarchy, and the outputs of different actions. You must start by choosing metrics that affect your business success.
1. Considering all indicators of productivity
Start by assessing productivity holistically. Look at the term from an operational efficiency lens. Some examples of these indicators are project completion rates or output per week.
Next, use a customer and employee engagement point of view. This includes indicators like retention rates that define the success of your engagement strategies.
2. Alignment with business goals
Choose productivity metrics that align with your company’s objectives and mission. This sets you up to identify meaningful productivity metrics examples that matter for your business.
Furthermore, map processes and metrics to specific objectives. In the process, communicate this alignment to all team members to explain how their work must support the organization’s goals.

ClickUp Project Metrics Template has a fully customizable format to monitor your project goals and improve coherence about your project’s status across teams. You can set personalized metrics by using custom fields and custom statuses, access categories of project data, and analyze outcomes to test your team’s productivity.
The template comes with four views in different configurations to give you the flexibility to review your data in your preferred way. Priority labels, tags, and nested subtasks make tracking metrics easier.
3. Defining productivity in your team or organization
The term can differ for multiple departments, team members, and industries. You should define your perspective in a relevant context to set appropriate and achievable metrics.
For instance, the performance marketing team’s productivity might be measured by the number of leads generated. In contrast, the IT team’s productivity could be calculated by the number of technical upgrades and new features added over a period of time.
Establish clear definitions for different teams to ensure their focus is synchronized with your desired results.
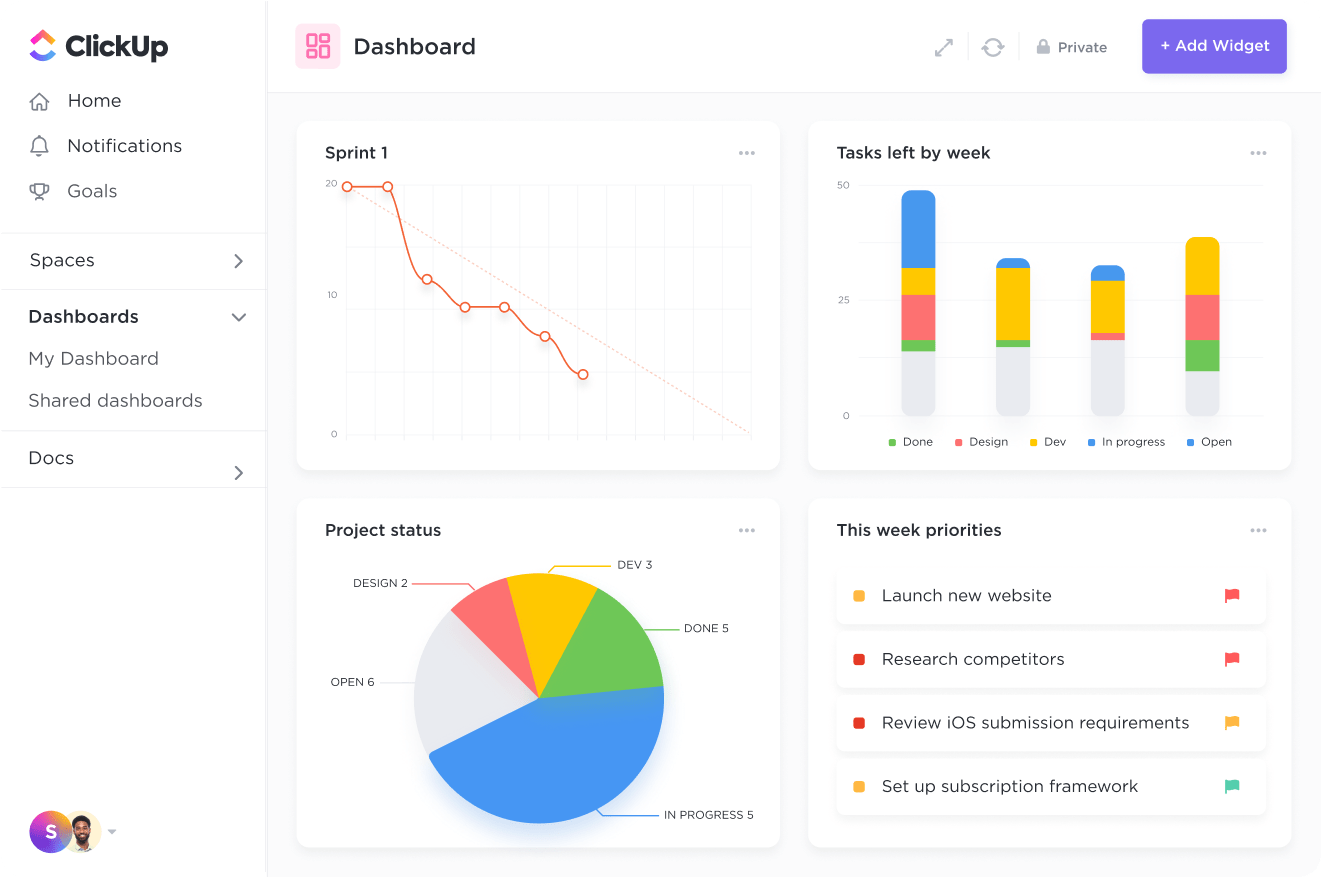
4. Using a KPI dashboard to keep track of your progress
Use a customizable KPI dashboard to monitor and visualize productivity metrics within minutes. KPI dashboards let you study your team’s performance in specific periods and on a project-to-project basis.
Moreover, it is a handy visualization tool to present on-demand data to relevant stakeholders in a digestible format. Remember to add a mixture of leading and lagging indicators for a comprehensive view of future and historical performance parameters.
SaaS products like ClickUp equip you with a fully customizable ClickUp Reporting Dashboard. You can track everything via this intuitive dashboard, from the status of sub-tasks to the progress of ongoing tasks.
Productivity Metrics and Goal Setting
The two go hand-in-hand since your goals must be realistic and trackable across each stage of the task or project.
Use past performance data as benchmarks and adopt the SMART (specific, measurable, achievable, relevant, and time-bound) goals framework for the specificity needed in this approach.
Make it a habit to revisit these metrics occasionally, as goal-setting is usually an iterative process. Also, understand how leadership incentives and the workplace environment are essential for better productivity and setting achievable goals.
While leadership incentives can motivate employees and increase retention rates, a quality workplace environment prevents burnout. These factors are critical for high-scoring productivity metrics as you proactively keep your team focused on improving their output.
ClickUp Goals enables you to allocate and monitor interconnected tasks. It offers 15+ customizable views and parameters to track crucial productivity metrics for different teams and projects.

Productivity Metrics Will Optimize Your Future Workflows
It’s clear how allocating productivity metrics can crush or fuel your business outcomes.
Don’t forget to revisit and refine these metrics based on changing industry dynamics and internal growth.
Motivate your employees to upskill in analytics so they can also start viewing their individual performance analytically, furthering the company’s collective drive for organizational growth.
Looking ahead, the future of measuring productivity is set to be dominated by data-driven and AI-supported approaches. ClickUp, with its AI-assisted project management tools and intuitive dashboards, helps you do this by giving you access to all your data at a glance.
Try ClickUp for free and start measuring productivity today.
FAQs
1. What are productivity metrics?
Productivity metrics are numbers and data points that gauge how well your organization converts inputs like labor, materials, and capital into outputs like products or services. More like quantitative measures, productivity metrics are KPIs that rate the operational efficiency of different teams.
2. What are the 3 ways of measuring productivity?
To measure productivity, first, identify the metrics that best assess productivity for you. Ensure it’s a limited list that prioritizes your ultimate business goals. Secondly, don’t only look at labor productivity measures. Thirdly, use project management and productivity tools to collect primary data regarding finances, working hours, project progress, etc.
3. What is KPI for work productivity?
The average productivity rate is an excellent KPI or productivity metric for measuring whether employees’ work hours do justice to their outputs. You can use a project management tool to gather numerical and visual data for different employee activities.


Everything you need to stay organized and get work done.


