


Still downloading templates?
There’s an easier way. Try a free AI Agent in ClickUp that actually does the work for you—set up in minutes, save hours every week.
Sorry, there were no results found for “”
Sorry, there were no results found for “”
Sorry, there were no results found for “”
You’ve invested in upskilling your sales team. But now comes the big question from leadership: Was it worth it?
For HR and Learning & Development leaders, proving the value of training is a business imperative. Showing a clear return on investment is what separates strategic talent partners from cost centers. It’s the difference between your training budget getting approved or denied next quarter.
The good news? When done correctly, training isn’t an expense; it’s an investment with compounding returns. In fact, a book on training at Accenture supports investing in training; the authors estimated that for every dollar a company invested in training, they received about $4.53 in return—a 353% ROI!
This guide will equip you with a practical, step-by-step framework for calculating the ROI of employee training and development. You’ll learn how to isolate the impact of your training programs, convert performance data into monetary value, and confidently communicate the financial value of your L&D initiatives.
💡 Fun Fact: Measuring return on investment has been a cornerstone of business decision-making for over 100 years. This concept of ROI was first popularized by Donaldson Brown, a financial executive at DuPont, in the early 20th century as a way to evaluate operational efficiency.
The ROI of employee training is the quantifiable net value (both financial and non-financial) gained from a training program, compared to its total cost. It’s the ultimate metric that translates your L&D efforts into the universal language of business: dollars and cents.
In finance, calculating ROI is straightforward: it’s a measure of the profitability of an investment. But when we apply this concept to L&D, its definition expands.
Many organizations still rely on vanity metrics that tell an incomplete story. Completion rates, participation rates, and smile sheets (post-training satisfaction surveys) might make your reports look good, but they don’t answer the critical question: Did this training actually improve performance and drive business results?
For instance, a 95% course completion rate means little if it doesn’t change on-the-job behavior, equip employees with new skills, or contribute to key business objectives. L&D professionals and leaders should remind themselves that these traditional measures are the starting point, not the finish line.
True training ROI acts as the crucial bridge between learning activities and tangible business outcomes. It connects the dots from a training session to metrics that executives care about, such as:
By focusing on calculating the ROI of employee training and development, you shift the conversation from cost to investment, from activity to impact. It empowers you to move beyond simply reporting how many people were trained and instead demonstrate how training programs affect the organization’s bottom line.
Tracking the success of your training programs is crucial for ensuring that your investment in employee development is paying off. ClickUp’s Training KPI Tracking Template is here to help you measure, analyze, and optimize your training initiatives like never before!
While the concept of ROI can feel complex, its calculation is anchored in a straightforward, standardized formula. This equation provides a clear, percentage-based value that represents the financial return of your training investment.
The universal formula for calculating training ROI is:
ROI (%) = (Net Benefits of Training ÷ Total Training Costs) × 100
Where:
To accurately assess ROI, you must first account for every dollar spent. This goes far beyond just the price of an online course or a trainer’s day rate. A comprehensive cost breakdown includes:
Imagine you invest in a new sales training program for your team of 10 account executives.
Step 1: Calculate total training costs
Step 2: Calculate net benefits over the next quarter
You track the sales performance of the trained group. You determine that the training led to an increase in sales that generated an additional $90,000 in revenue.
Step 3: Calculate ROI
This means for every dollar invested in training, the company got $4.63 in return.
This powerful figure moves the conversation from anecdotal evidence to hard data, making it easy to justify training investments to stakeholders.
💡 Pro Tip: Before launching any training initiative, work backwards from the business goals you want to impact. This makes it infinitely easier to identify what data to collect and how to measure ROI later on.
To move from activity-based reporting to impact measurement, you must track a blend of leading and lagging indicators. Let’s break down these indicators.
Leading indicators are predictive, measuring the initial success and application of training. Lagging indicators are the ultimate outcomes, measuring the final impact on business performance. Together, they form a chain of evidence that directly links your L&D efforts to financial ROI.
These metrics measure whether training is being absorbed and applied on the job. They are predictors of future performance but do not, by themselves, quantify financial return.
📮ClickUp Insight: Context-switching is silently eating away at your team’s productivity. Our research shows that 42% of disruptions at work come from juggling platforms, managing emails, and jumping between meetings. What if you could eliminate these costly interruptions?
ClickUp unites your workflows (and chat) under a single, streamlined platform. Launch and manage your tasks from across chat, docs, whiteboards, and more—while AI-powered features keep the context connected, searchable, and manageable!
These metrics measure the ultimate effect of applied learning on organizational performance. They are often expressed in quantifiable business terms and are essential for calculating the monetary value used in the ROI formula.
Scenario: A company invests in a training program for its software engineers on a new, more efficient coding framework.
By systematically tracking both types of metrics, you create a solid chain of evidence that demonstrates how employee training and development directly influence business objectives and deliver a measurable return on investment.
💡 Pro Tip: The most common mistake in measuring training ROI is only tracking leading indicators like completion rates and satisfaction scores. While important for feedback, they are not ROI. True ROI is calculated from lagging indicators—the hard business outcomes like productivity, quality, and retention that directly impact the bottom line.
To effectively calculate ROI, you need a systematic approach to data collection and analysis.
In the past, L&D and talent enrichment often relied on multiple tools to run ROI-driven training programs: one survey tool for before and after surveys, another tool to build out the training modules, screen recording tools, etc. Then they needed to expend a whole lot of manual effort to measure the efficacy of training programs through feedback, and track down and analyze work performance.
That work sprawl and context sprawl comes to an end with modern AI-powered all-in-one tools like ClickUp. ClickUp provides integrated features that streamline this process, moving it from a manual, retrospective chore to an automated, insightful practice.Let’s look at the key methods for measuring the ROI of training, with specific examples of how ClickUp’s features can be leveraged for each.
This is the foundational layer of measurement. By administering identical assessments before and after a training program, you quantitatively measure the knowledge or skills gained. The delta between the two scores directly represents the learning that occurred.
🎯 How ClickUp makes this efficient:
You can quickly collect and organize assessment results by using ClickUp Forms to administer pre- and post-training quizzes or surveys. With customizable forms, you can tailor questions to each training and share them instantly with participants. All responses are automatically gathered in one place, eliminating manual data entry and ensuring nothing is missed.

Tracking each employee’s progress over time is simple with ClickUp Custom Fields. Add fields for pre- and post-training scores directly to training tasks or employee records. This allows you to compare results at a glance and identify who benefited most from the training.
ClickUp Automations ensure you never miss a follow-up. Set up rules to trigger reminders for incomplete assessments or assign additional training tasks if post-training scores fall below a certain threshold. This keeps your training process proactive and responsive.
And using AI, you can create automations to suit your workflow. Want to know more? Check out this video👇
Gain instant visibility into average scores, improvement rates, and completion statistics with ClickUp Dashboards. Create widgets to visualize learning gains across teams or departments, making it easy to spot trends and measure effectiveness.
For consistency and easy access, store answer keys, assessment guidelines, and training materials in ClickUp Docs. This ensures everyone is working from the same resources and makes it easy to update materials as your programs evolve.
To get started even faster, leverage templates like the ClickUp Training Rollout Plan Template to organize your assessment process and track progress from planning to completion.
While assessments measure “what they learned,” surveys measure “how they felt” about the training and, more importantly, their “confidence in applying” the new skills. This measures engagement and predicts the likelihood of behavioral change.
🎯 How ClickUp makes this efficient:
Again, you can effortlessly gather honest, structured feedback from every participant by using ClickUp Forms. Design custom post-training surveys that ask about satisfaction, engagement, and confidence in applying new skills.
ClickUp Brain can help you instantly summarize sentiment, extract key themes, and highlight urgent issues from survey results. This allows you to spot patterns—such as common obstacles or particularly effective aspects of your training—so you can make data-driven improvements faster than ever.
For a head start, try the ClickUp Employee Feedback Template or Feedback Form Template.
Centralizing all feedback in ClickUp means you never have to search through scattered emails or spreadsheets. You can set up automations so that every survey response is attached to the relevant training task or employee record, making it easy to track feedback over time and in context. This helps ensure that feedback leads to real action.
For example, if a participant reports low confidence in applying new skills, ClickUp can automatically assign a follow-up coaching session, send additional resources, or notify a manager for further support. Automations can also trigger reminders for participants who haven’t completed their surveys, boosting response rates.
You can also simply @mention Brain for instant answers and quick support! To know more, watch this video👇
Confidentiality is also easy to maintain with ClickUp. Forms can be set up to collect anonymous feedback, encouraging participants to be candid about their experiences. This honesty helps you uncover issues that might otherwise go unreported and ensures your data reflects the true sentiment of your team.
To truly isolate the impact of training, compare outcomes between employees who received training and those who did not. This benchmarking approach helps you attribute performance improvements directly to your program, rather than to external factors.
🎯 How ClickUp makes this efficient:
You can efficiently manage, control, and test groups by creating separate tasks or lists for each group in ClickUp. Assign and track training participation, then use ClickUp Custom Fields to log performance metrics for both groups. This structure makes it easy to compare results side-by-side and see the true effect of your training.
Again, you can view and benchmark results across groups with ClickUp Dashboards and set up Automations to ensure consistent follow-up and data collection across both groups. For example, you can automatically assign surveys or assessments at the same intervals for both groups, reducing manual effort and bias.
Leverage templates like the ClickUp KPI Template to standardize your benchmarking process and ensure you’re tracking the right metrics for meaningful comparisons.
The ultimate goal of training is to drive real-world performance improvements. By analyzing key metrics—such as productivity, sales, or error rates—before and after training, you can quantify its business impact.
🎯 How ClickUp makes this efficient:
You can centralize all relevant performance data in ClickUp by attaching reports or logging metrics as Custom Fields on training tasks. This keeps all your data in one place and makes it easy to track changes over time.
ClickUp Dashboards make it easy to visualize trends and compare before-and-after results at a glance. Create charts and graphs that show performance improvements, helping you demonstrate the tangible ROI of your training programs to stakeholders.

ClickUp Automations can prompt managers to input data at set intervals, ensuring timely and consistent measurement. For example, you can schedule reminders for managers to update performance metrics one month after training completion.
Store supporting documentation, such as performance review guidelines or data collection procedures, in ClickUp Docs for easy reference and consistency across your team.
Templates like the ClickUp’s Employee Development Plan Template can help you structure ongoing performance tracking and ensure that training outcomes are linked to business goals.
Modern training measurement goes beyond basic metrics. With advanced AI solutions, you can move from simply tracking data to generating real, actionable intelligence that transforms how you measure and improve learning impact.
🎯 How ClickUp makes this efficient:
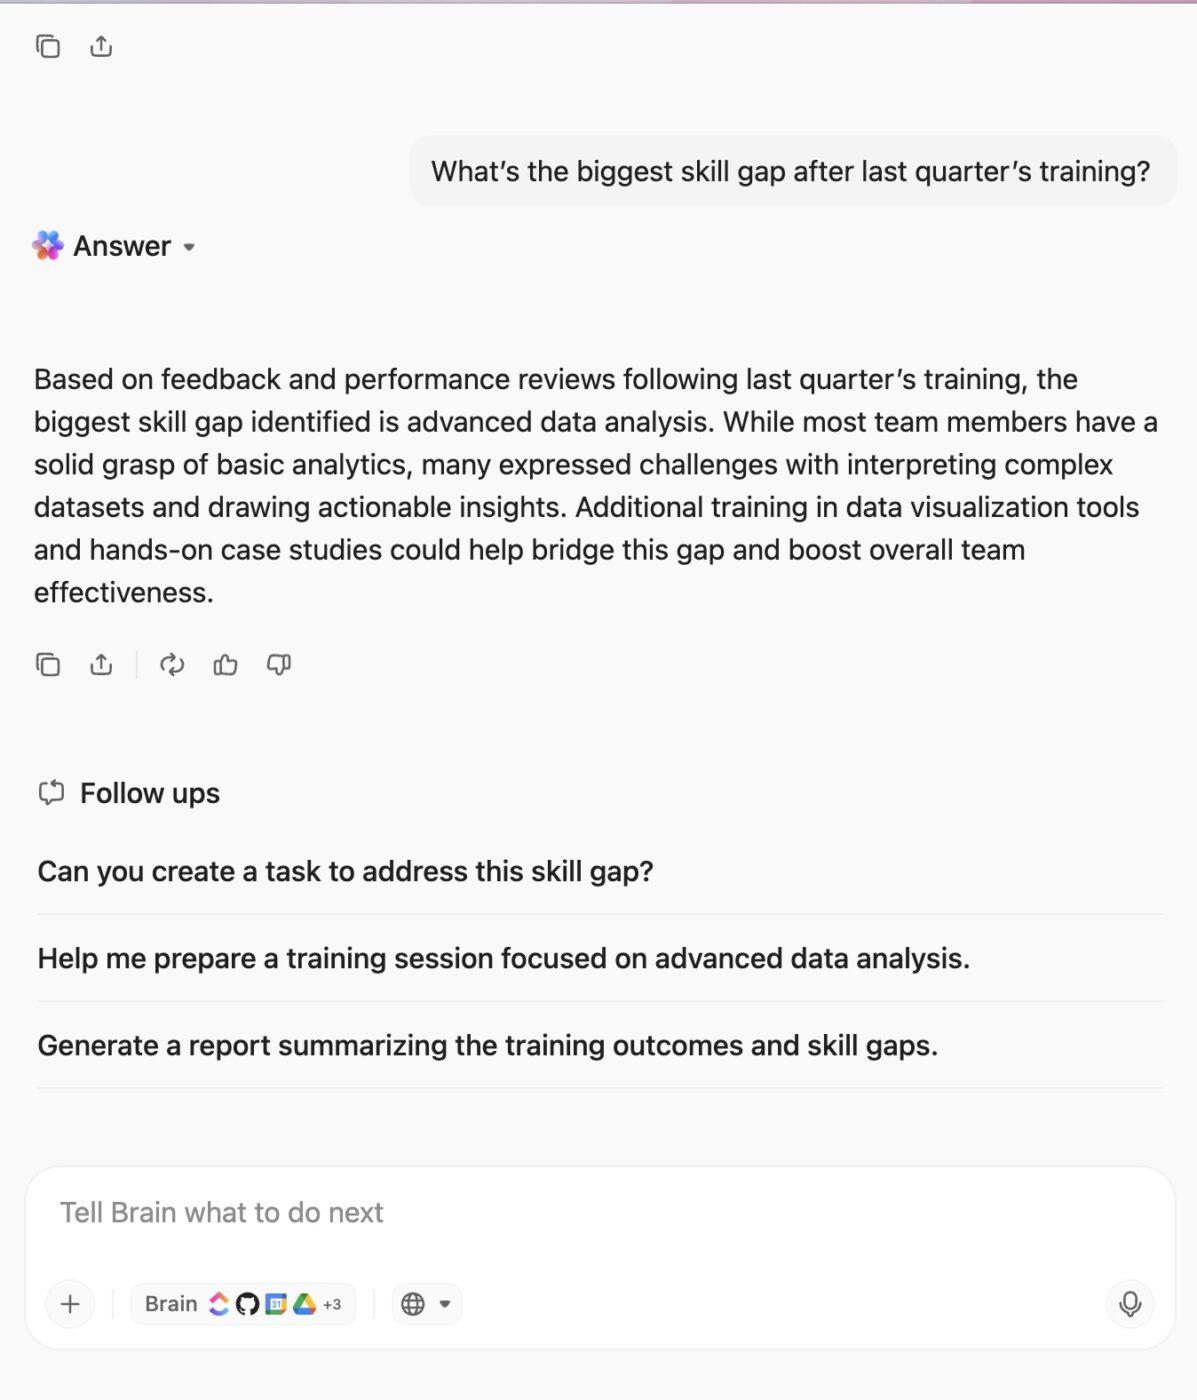
You gain instant, organization-wide intelligence with ClickUp Brain.
Brain acts as your AI-powered knowledge engine, connecting all your training data—feedback, assessments, performance metrics, and more—so you can ask natural language questions like “What’s the biggest skill gap after last quarter’s training?” or “Which teams showed the most improvement?” and get immediate, context-rich answers. This eliminates manual analysis and empowers you to make smarter, faster decisions about your training strategy.
See how ClickUp Brain instantly generates relevant insights with just one prompt👇
ClickUp Brain MAX takes things further by leveraging advanced analytics and machine learning. Brain MAX can forecast future training needs, predict which employees are most likely to benefit from specific programs, and surface hidden patterns in engagement or performance. This means you’re not just reacting to past results—you’re proactively shaping your learning and development roadmap for maximum ROI.
With Brain MAX, you unlock unique capabilities that set it apart from standard AI solutions. You can use Talk-to-Text to interact with your workspace hands-free—simply speak your questions or commands, and Brain Max will transcribe and process them instantly, making it easier than ever to capture insights or trigger actions on the go.
Watch this video to know how Brain MAX turns your voice into organized text right in your Workspace👇
Brain Max also gives you access to multiple large language models (LLMs) like ChatGPT, Claude, and Gemini, allowing you to choose the best AI engine for your specific needs—whether you want ultra-fast responses, nuanced analysis, or specialized industry knowledge. This flexibility ensures you always get the most accurate and relevant insights for your training data.
🌟 Highlight: Brain Max is connected to all your apps and data sources within ClickUp and beyond. It can pull information from integrated tools like Slack, Google Drive, HR systems, and more, providing a truly unified view of your learning impact. This deep connectivity means your AI-driven insights are always comprehensive, up-to-date, and actionable—no matter where your data lives.
You can automate complex analysis and reporting with ClickUp AI Agents. These specialized agents can be set up to monitor training feedback, flag sentiment changes, summarize survey results, and even recommend next steps—such as assigning refresher modules or scheduling follow-up coaching—without any manual intervention. This ensures that every insight leads to timely, targeted action.
ClickUp’s AI Fields allow you to embed intelligence directly into your training workflows. For example, you can create a custom AI Field that automatically scores open-ended feedback for positivity, urgency, or relevance, and then triggers automations based on those scores. This turns every piece of qualitative data into a measurable, actionable metric—no more sifting through endless comments or survey responses.
With AI Cards in ClickUp, you can surface the most important insights right where you work. These Cards provide real-time summaries, recommendations, and alerts directly in your ClickUp Views—so whether you’re reviewing a training project, a feedback list, or a performance dashboard, you always have the latest AI-driven intelligence at your fingertips.
By integrating ClickUp’s suite of AI solutions into your training measurement process, you move from fragmented, manual reporting to a unified, intelligent system that not only tracks ROI but actively drives continuous improvement and learning success.
📊 Did You Know? The Phillips ROI Methodology, one of the most respected frameworks for calculating training ROI, was developed by Dr. Jack Phillips as an extension of the Kirkpatrick Model. It adds a fifth level—Return on Investment—explicitly to quantify the financial return of learning programs, cementing the direct link between L&D and business performance.
While calculating the ROI for training and development is a powerful way to demonstrate value, several significant challenges can obscure the true impact of L&D initiatives. Recognizing and strategically addressing these hurdles is essential for producing accurate, credible, and actionable results.
🛑 The challenge: Business outcomes are influenced by numerous variables—market conditions, changes in leadership, new technology implementations, economic shifts, and more. Attributing a specific performance improvement, such as a 15% increase in sales, solely to a training program is methodologically complex. Without isolation, you cannot credibly claim that training caused the result.
✅ How to address it:
🛑 The challenge: It is relatively straightforward to measure a 20% reduction in errors or a 30-minute decrease in task completion time. The real difficulty lies in converting these soft metrics into a hard, credible dollar amount that can be used in the ROI formula. This requires accurate calculations of fully loaded costs, hourly wages, and the financial impact of mistakes.
✅ How to address it:
🛑 The challenge: Relevant data often resides in disconnected systems—HRIS for employee data, CRM for sales performance, project management tools for productivity metrics, and survey tools for feedback. Manually gathering, cleaning, and integrating this data is incredibly time-consuming and prone to error, making continuous ROI measurement impractical.
✅ How to address it:
🛑 The challenge: The ultimate business impact of training—especially for soft skills like leadership, communication, or change management—may not be visible for months or even years. This long delay makes it difficult to connect the outcome back to the initial training investment, and stakeholders often want to see results within a single quarter.
✅ How to address it:
🛑 The challenge: If your ROI calculation is perceived as inflated, based on guesswork, or biased, it will be dismissed by leadership and can damage the credibility of the entire L&D function. The process must be conservative, methodologically sound, and transparent.
✅ How to address it:
By anticipating these challenges and implementing a structured, tool-enabled approach to address them, you move from producing speculative numbers to delivering robust, defensible, and trusted ROI calculations that secure ongoing investment in employee development.
🔍 Final Note: The goal of measuring training ROI is not to prove that every program is successful. Its true value lies in providing an objective, data-driven basis for decision-making.
Sometimes, the most valuable insight is discovering that a program has a negative or neutral ROI, allowing you to reallocate resources to initiatives with a greater impact on business goals. This objective stance is what earns L&D a seat at the strategic table.
Maximizing the return on investment from your training and development programs requires a strategic approach that spans from initial planning to long-term reinforcement. By implementing these best practices, you can ensure your L&D initiatives are not just cost centers but powerful drivers of performance, productivity, and growth.
Before developing or purchasing any training, clearly identify which specific business goals it supports. Training should be a solution to a known performance gap or strategic initiative, not a generic activity.
💡How to implement it:
The value of training is realized only when new knowledge is applied on the job. Design programs with a heavy emphasis on practice, real-world scenarios, and post-training support to ensure learning translates into action.
💡How to implement it:
Use modern L&D technology, including your existing work management platform, to deliver training efficiently, track engagement at scale, and personalize learning paths based on individual or role-specific needs.
💡How to implement it:
Managers are the single most important factor in whether training is applied. Equip them to coach their teams, reinforce key concepts, and create opportunities for employees to use their new skills.
💡How to implement it:
Adopt a cycle of continuous improvement. Regularly collect data on effectiveness, analyze what’s working and what isn’t, and use those insights to refine and improve your programs over time.
💡How to implement it:
By embedding these practices into your L&D operations, you shift from a one-off training mindset to building a continuous learning culture that demonstrably improves performance and delivers a compelling, measurable return on investment.
🔍 Key Takeaway: The highest training ROI comes from focusing on outcomes, not activities. Even the most beautifully designed training program has zero ROI if it doesn’t change behavior and improve performance. By strategically aligning, reinforcing, and measuring with tools like ClickUp, you ensure your investment translates into tangible business value.
In the 1980s, Motorola, the American telecommunications giant, was losing market share to competitors who were producing high-quality products at a lower cost. Internal analysis revealed massive costs associated with defects in manufacturing and processes that led to rework, waste, warranty claims, and customer dissatisfaction.
The training solution: Motorola developed and implemented a comprehensive training program based on a new methodology called Six Sigma. The goal was to instill a data-driven culture focused on virtually eliminating defects (defined as 3.4 defects per million opportunities).
The program was a rigorous, multi-level certification process:
Motorola’s commitment to measuring the impact of its Six Sigma training is what made it a legendary case study in the L&D world.
Reported financial results:
Motorola’s success wasn’t accidental. It exemplifies the best practices covered in this guide:
⚡️ Template Archive: Ready-to-use employee training checklist templates
Measuring training’s ROI is the most powerful way to transform your L&D function from a cost center to a strategic driver of business growth.
While challenges like isolating impact and converting data exist, they are surmountable with a structured methodology and a commitment to continuous measurement. Ultimately, this process isn’t just about proving value; it’s about creating a culture of continuous improvement where every training investment is optimized for maximum impact on your bottom line.
The key to unlocking this potential lies in moving beyond disconnected spreadsheets and manual data collection. To efficiently centralize your assessments, automate feedback cycles, and build compelling dashboards that tell the story of your success, you need a unified platform.
ClickUp is designed to be that central nervous system for your L&D operations, integrating every step of the ROI journey into a single, powerful workspace. Stop struggling to prove your value and start demonstrating it with clarity and confidence.
Sign up for your free ClickUp account today and begin building a data-driven case for your most critical training investments.
A positive ROI (anything above 0%) indicates the training generated more value than it cost. However, most organizations aim for a minimum of 100% ROI, meaning they double their investment. The key benchmark is to exceed your company’s cost of capital.
Yes. While harder to quantify than technical skills, you measure the behavioral outcomes that impact business metrics. For example, measure the ROI of leadership training by tracking improvements in team productivity, employee retention rates, or engagement scores, and then convert those improvements into monetary value.
The tracking period depends on the training’s goal. For immediate skills application (e.g., new software), track results within 30-90 days. For programs aimed at long-term behavioral change (e.g., leadership, coaching), you may need to track for 6 to 18 months to capture the full impact on performance and business results.
A robust work management platform like ClickUp is essential. It centralizes the process by using Forms for pre-/post-assessments and feedback, Custom Fields to track performance KPIs, Dashboards to visualize data trends, and Automations to schedule follow-up surveys—all in one place to streamline measurement and prove value.
Link leadership behaviors to team performance. Track metrics like:
Employee retention and engagement scores for their teams
Productivity metrics of their departments
Success rates of projects they lead
Calculate the monetary value of improvements in these areas (e.g., cost savings from reduced turnover) against the total cost of the training program.
No. ROI is the ultimate measure of financial return, but it’s part of a larger picture. A complete evaluation includes leading indicators like:
Level 1: Reaction ( participant satisfaction)
Level 2: Learning ( knowledge gain)
Level 3: Behavior ( on-the-job application)
Level 4: Results ( business impact & ROI)
These levels work together to tell the full story of a training program’s effectiveness.

© 2026 ClickUp

There’s an easier way. Try a free AI Agent in ClickUp that actually does the work for you—set up in minutes, save hours every week.