Sorry, there were no results found for “”
Sorry, there were no results found for “”
Sorry, there were no results found for “”
Smart product teams focus on feature adoption early. You don’t need massive datasets to know if something is working. A small group of users interacting with a new feature can quickly tell you whether it’s valuable…or a complete miss.
The challenge? Actually capturing and acting on those insights in a structured way.
Feature adoption tracking templates help you systematically monitor usage, measure impact, and refine your product decisions with confidence.
In this list, we’ve rounded up some of the best free feature adoption tracking templates. They will help you turn early user signals into smarter product moves, faster.
| Template name | Download link | Ideal for | Best features | Visual format |
| Analytics Report Template by ClickUp | Get free template | Data analysts and ops managers presenting to stakeholders | KPI centralization; period-over-period trend tracking; automated charts | Doc-based with Table & Graph views |
| Feature Requests List Template by ClickUp | Get free template | Product managers vetting and prioritizing new user ideas | Standardized intake forms; RICE-style scoring; bandwidth analysis | Structured List and Gantt |
| Product Features Matrix Template by ClickUp | Get free template | PMs and Engineers weighing ROI against development costs | Numerical ROI rating scales; side-by-side software/hardware comparison | Multidimensional Table/Matrix |
| Software Rollout Timeline Template by ClickUp | Get free template | IT project managers and DevOps teams aligning cross-functionally | Technical dependency mapping; milestone tracking; deployment protocols | Visual Gantt and Timeline |
| Sample Rollout Plan Template by ClickUp | Get free template | PM leads managing budgets and departmental resources | Budget tracking; nested subtasks for assets; goal-to-task alignment | Calendar and List hierarchy |
| Implementation Management Template by ClickUp | Get free template | Services teams managing high-volume client onboarding | Micro-phase status tracking; workload balancing; contract tracking | Dashboards and Workload view |
| Bug & Issue Tracking Template by ClickUp | Get free template | Engineering and QA leads fixing UX friction points | Technical metadata intake forms; priority automations; resolution logs | Technical Backlog / Board |
| User Acceptance Testing (UAT) Checklist Template | Get free template | QA leads validating business requirements before launch | Pass/fail standardization; functional area segmentation; live feedback loops | Checklist and Gantt |
| Feature Adoption Dashboard Template by Amplitude | Download this template | Growth hackers needing deep behavioral analytics | Time-to-value analysis; return rate monitoring; platform segmentation | Behavioral Analytics Dashboard |
| Microsoft 365 Copilot Adoption Report | Download this template | IT leaders quantifying AI ROI and departmental habits | AI usage benchmarks; Power User identification; change management filters | Deep-dive Analytics Report |
Feature adoption tracking is the process of measuring how users discover, try, and consistently use specific product features over time. It goes beyond simple usage counts to reveal if features deliver value and become a core part of your users’ workflows.
The framework for tracking adoption is simple:
Instead of reinventing the wheel with every release, you can use feature adoption tracking templates to standardize this measurement process. They provide a pre-built structure for capturing product analytics, organizing feedback, and monitoring progress, all in one place.
📮ClickUp Insight: 92% of knowledge workers risk losing important decisions scattered across chat, email, and spreadsheets. Without a unified system for capturing and tracking decisions, critical business insights get lost in the digital noise. With ClickUp’s Task Management capabilities, you never have to worry about this. Create tasks from chat, task comments, docs, and emails with a single click!
These key performance indicators give you a clear, focused set of numbers that tell you how your feature is performing.
| Metric | What does it measure? | Why does it matter? |
|---|---|---|
| Feature adoption rate | The percentage of users who try a specific feature at least once within a set timeframe | Measures initial reach and awareness |
| Depth of adoption | The frequency and intensity of feature usage over time | Distinguishes between “one-time triers” and “power users |
| Time to first use | The duration between a feature’s release and a user’s first interaction with it | Highlights discoverability issues or onboarding gaps |
| Feature retention rate | The percentage of users who return after their first use | Indicates whether the feature delivers lasting value |
| Breadth of adoption | The percentage of the total user base (across all segments) that has adopted the feature | Reveals whether the feature is niche or broadly useful |
🧠 Fun Fact: In the early ’90s, usability expert Jakob Nielsen made a surprising discovery: you don’t need thousands of users to uncover product issues. In fact, just five users can reveal up to 85% of usability problems.
The templates below are designed to help you capture these adoption metrics without building a custom tracking system from scratch.
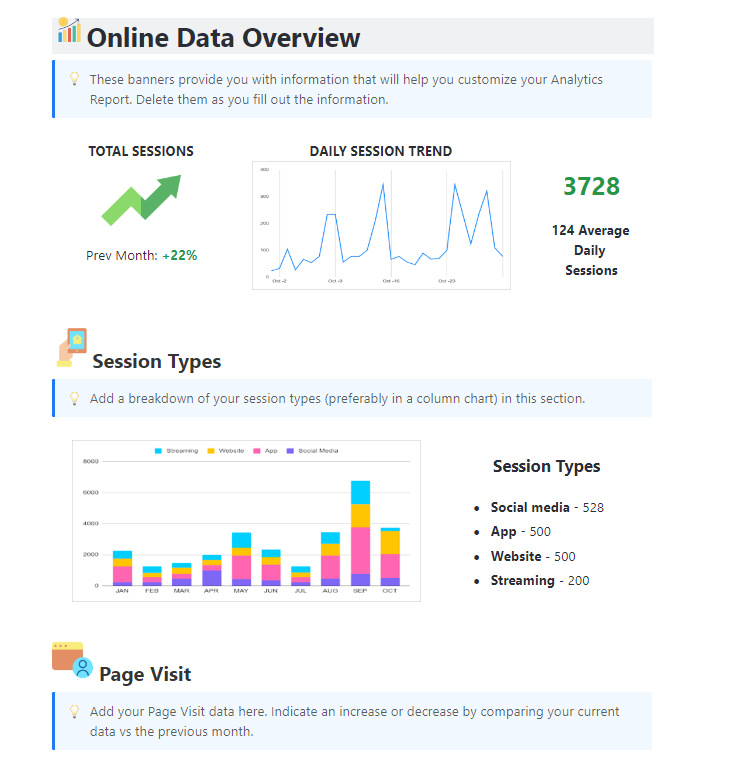
If your adoption data is scattered across different analytics tools and spreadsheets, compiling a single update takes hours. You need the ClickUp Analytics Report Template. This sophisticated yet user-friendly Doc-based framework turns raw data into actionable business intelligence.
The template combines high-level data visualization with task management. This allows your team to convert insights into corrective action quickly, without switching tools.
👀 Ideal for: Data analysts and operations managers who need to present professional performance overviews to stakeholders while keeping the underlying tasks organized.
🔎 Did You Know? Chief Data and Analytics Officers (CDAOs) who successfully use data fabric to manage complexity will become strategic growth drivers for their organizations. Using an Analytics Report Template is the first step toward that transition.
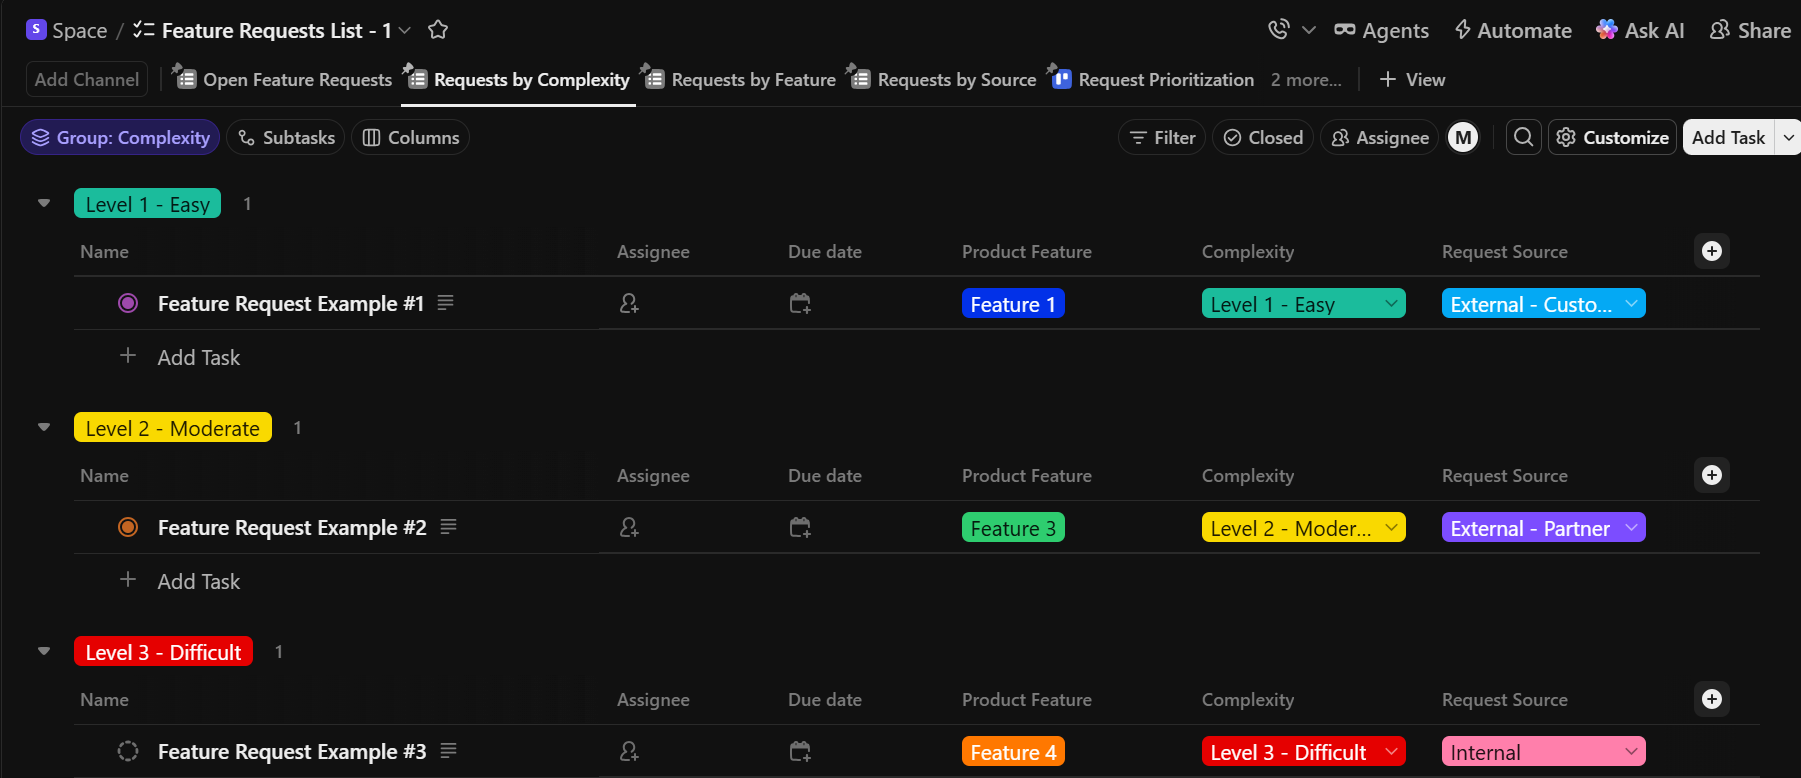
Bridge the gap between customer feedback and your product roadmap with the ClickUp Feature Requests List Template. It can turn subjective user suggestions into objective data points.
Use it as a transparent workflow for vetting new ideas. This will also help your product team prioritize features based on user demand and resource feasibility.
👀 Ideal for: Product managers and SaaS teams who need a structured system to intake, evaluate, and track the lifecycle of new feature ideas.
💡 Pro Tip: Enhance this workflow with ClickUp Brain—ClickUp’s built-in AI that works directly within your tasks, docs, and workflows.
ClickUp Brain can analyze incoming feature ideas, summarize user feedback, and suggest priorities based on impact and effort. This turns your feature requests list into a dynamic, self-improving system.
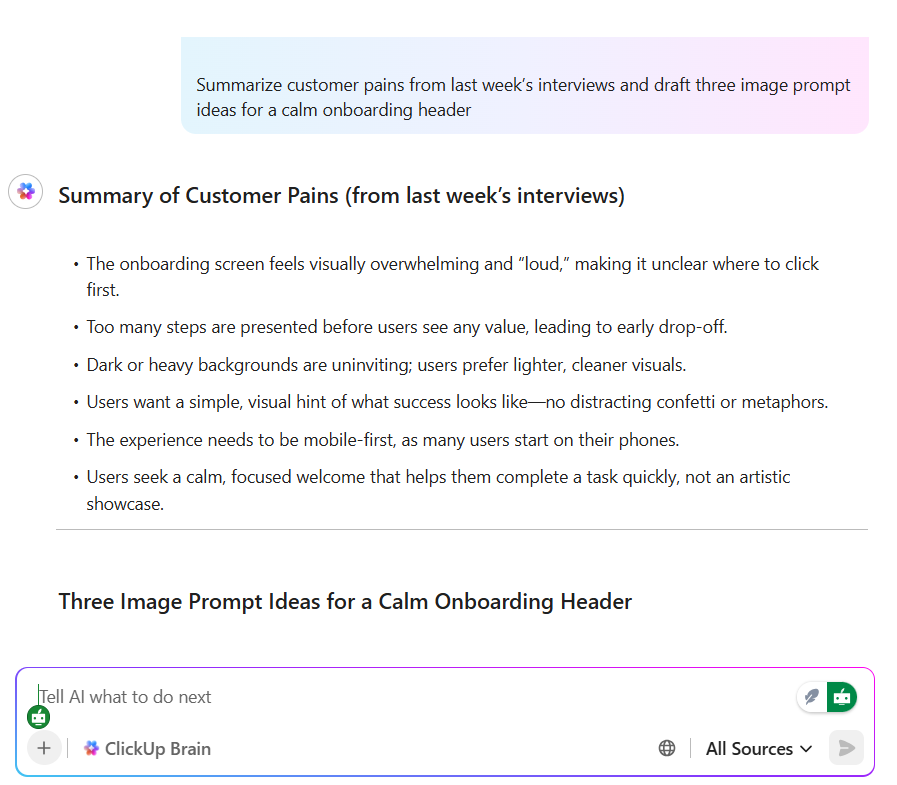
Here’s how Brain can help:
With ClickUp Brain, your team spends less time managing requests and more time building the right features faster.
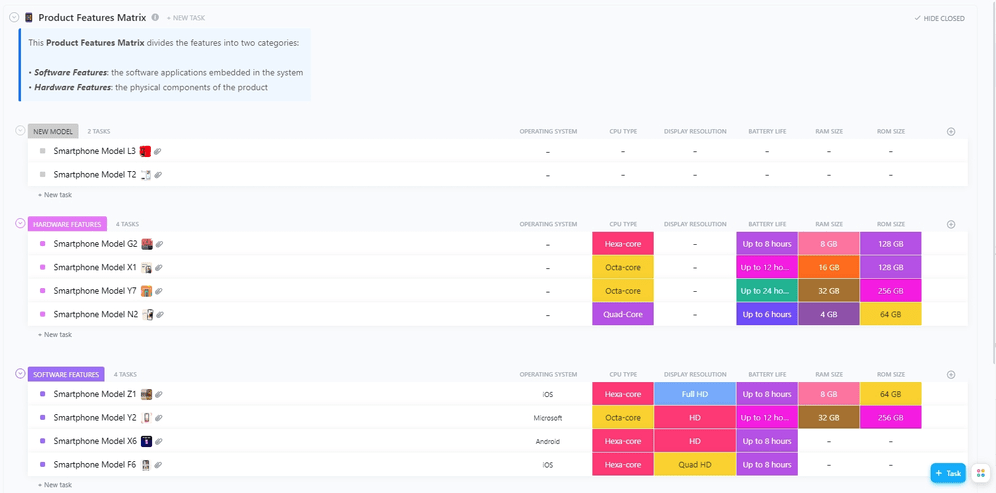
Weigh the relative value of different product capabilities against development costs using the ClickUp Product Features Matrix Template. It’s a multidimensional categorization system. You can segment and compare software and hardware features side-by-side within a unified workspace.
This ensures your team’s budget and energy are strictly allocated to the high-impact must-haves that drive user adoption.
👀 Ideal for: Product managers and engineering leads who need to objectively prioritize a massive backlog of features based on customer value and technical feasibility.
A feature launch can be chaotic, especially when marketing, sales, and engineering use their own disconnected tools. This disjointed process, also known as AI sprawl, leads to a botched launch, with users confused and dismal adoption numbers from day one.
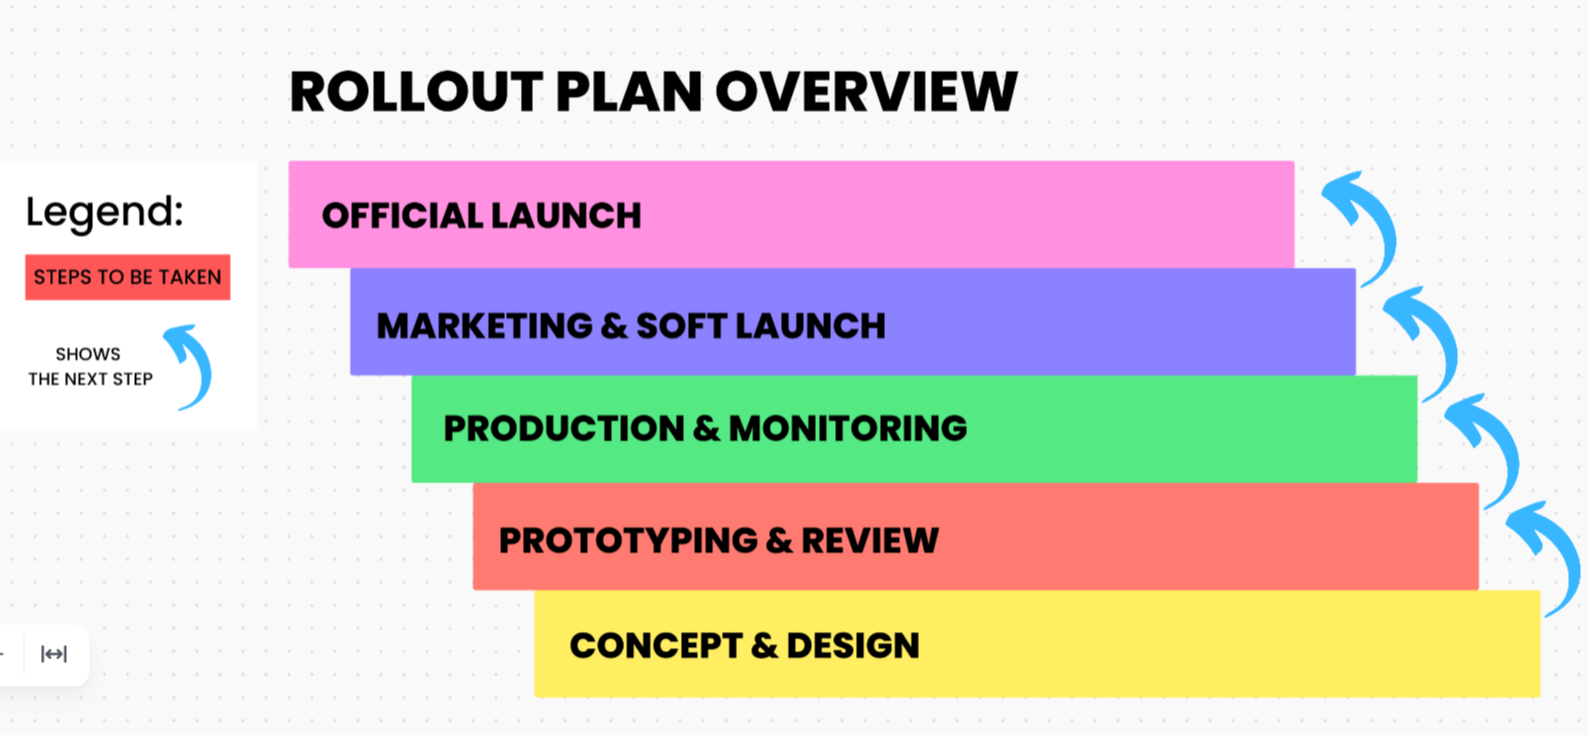
To streamline it, use the ClickUp Software Rollout Timeline Template.
The template specifically emphasizes cross-functional alignment. It ensures that development, QA, and marketing teams move in perfect synchronization from conception to the final release management stage.
👀 Ideal for: IT project managers and DevOps teams who need a structured, visual timeline to coordinate complex software launches across multiple departments.
🎥 This step-by-step guide shows how AI can streamline your product launch campaign!
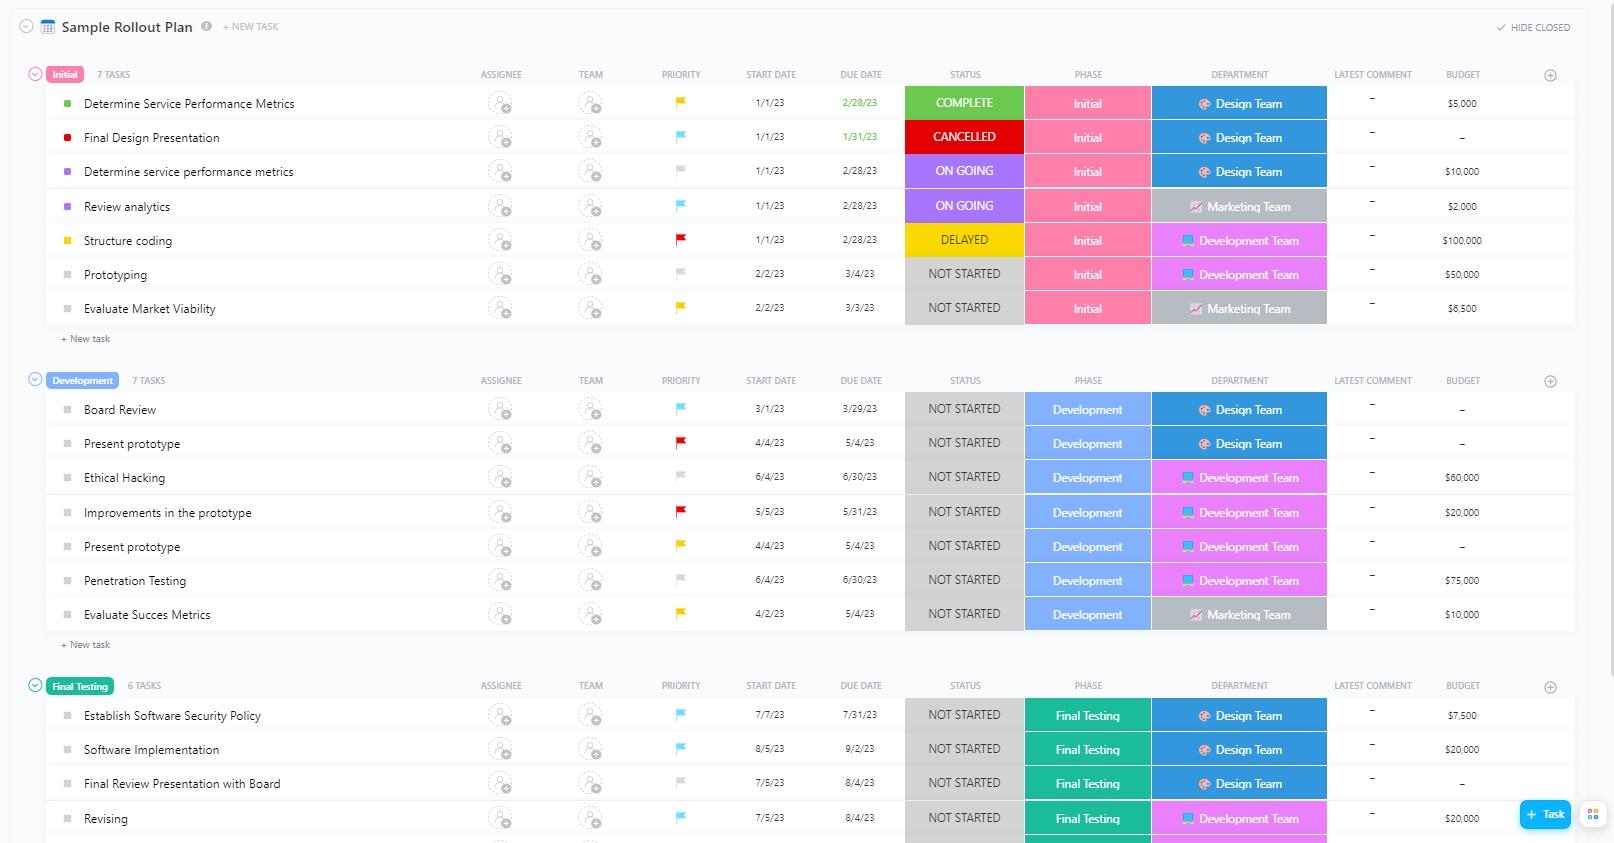
If you’re new to product management or your team lacks a formal process, every feature launch can feel stressful. ClickUp’s Sample Rollout Plan Template ensures it doesn’t have to be.
This template includes everything you need to plan and organize your launch, including tools for resource and budget management. It ensures that the logistical side of a launch, such as department spend and team bandwidth, is tracked as closely as the technical milestones.
👀 Ideal for: Project managers and product marketing leads who need a comprehensive, budget-conscious framework to coordinate complex product launches across multiple internal teams.
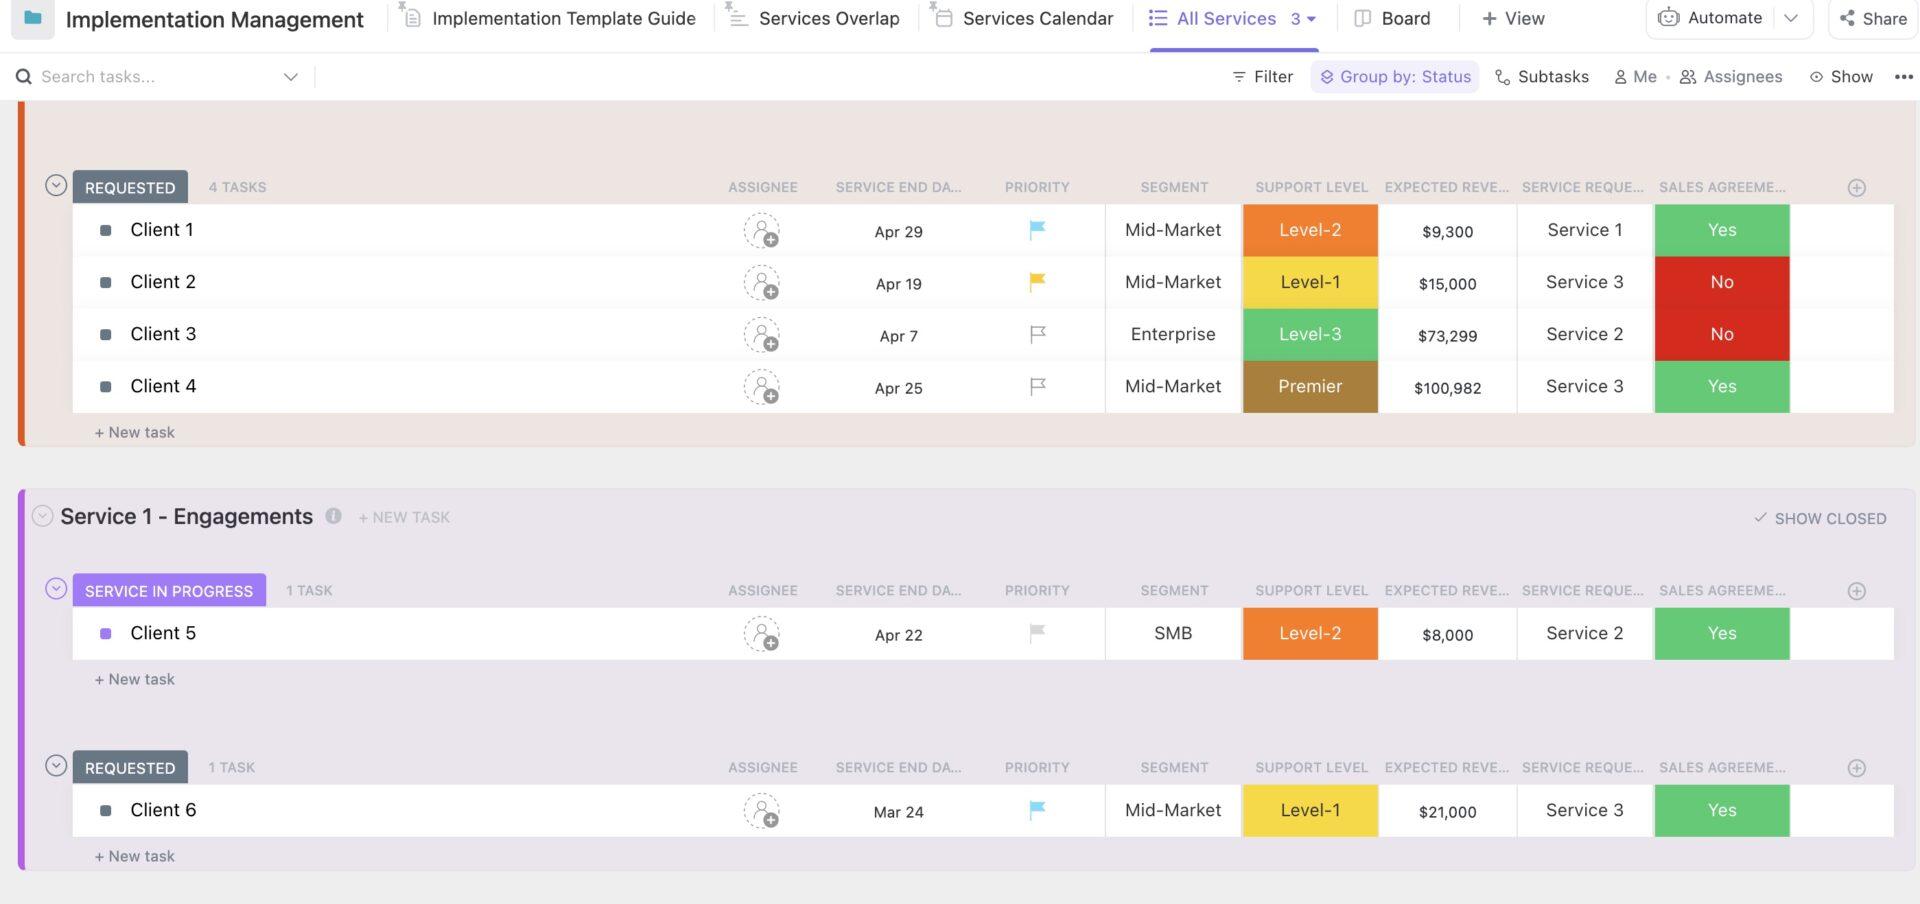
The ClickUp Implementation Management Template handles the transition from sales to service delivery. Custom Statuses in this template capture every micro-phase of a service rollout—from initial request to final sign-off.
You can also access ClickUp Views for visualizing contract tracking and service overlaps in your preferred format. They let professional services teams manage high volumes of client onboarding without sacrificing quality or missing critical deadlines.
👀 Ideal for: Implementation specialists and professional services teams coordinating multiple client onboarding and complex service deployments simultaneously.
⭐️ Complex workflows? Agentic AI can help. In this video, we break down some of the best agentic AI tools you can try today.
A dedicated ClickUp Bug & Issue Tracking Template creates a direct line between bug severity and adoption metrics. It forces every technical glitch into a documented lifecycle, from the moment a user hits a snag to the second the fix is deployed.
Use it to replace scattered emails and Slack messages with a structured technical backlog and prioritize bugs. It’ll also ensure that your engineers have the exact environment specs and reproduction steps they need to fix a defect on the first attempt.
👀 Ideal for: Engineering leads and QA managers who need to replace chaotic, informal bug reporting with a high-integrity system that protects the user experience.
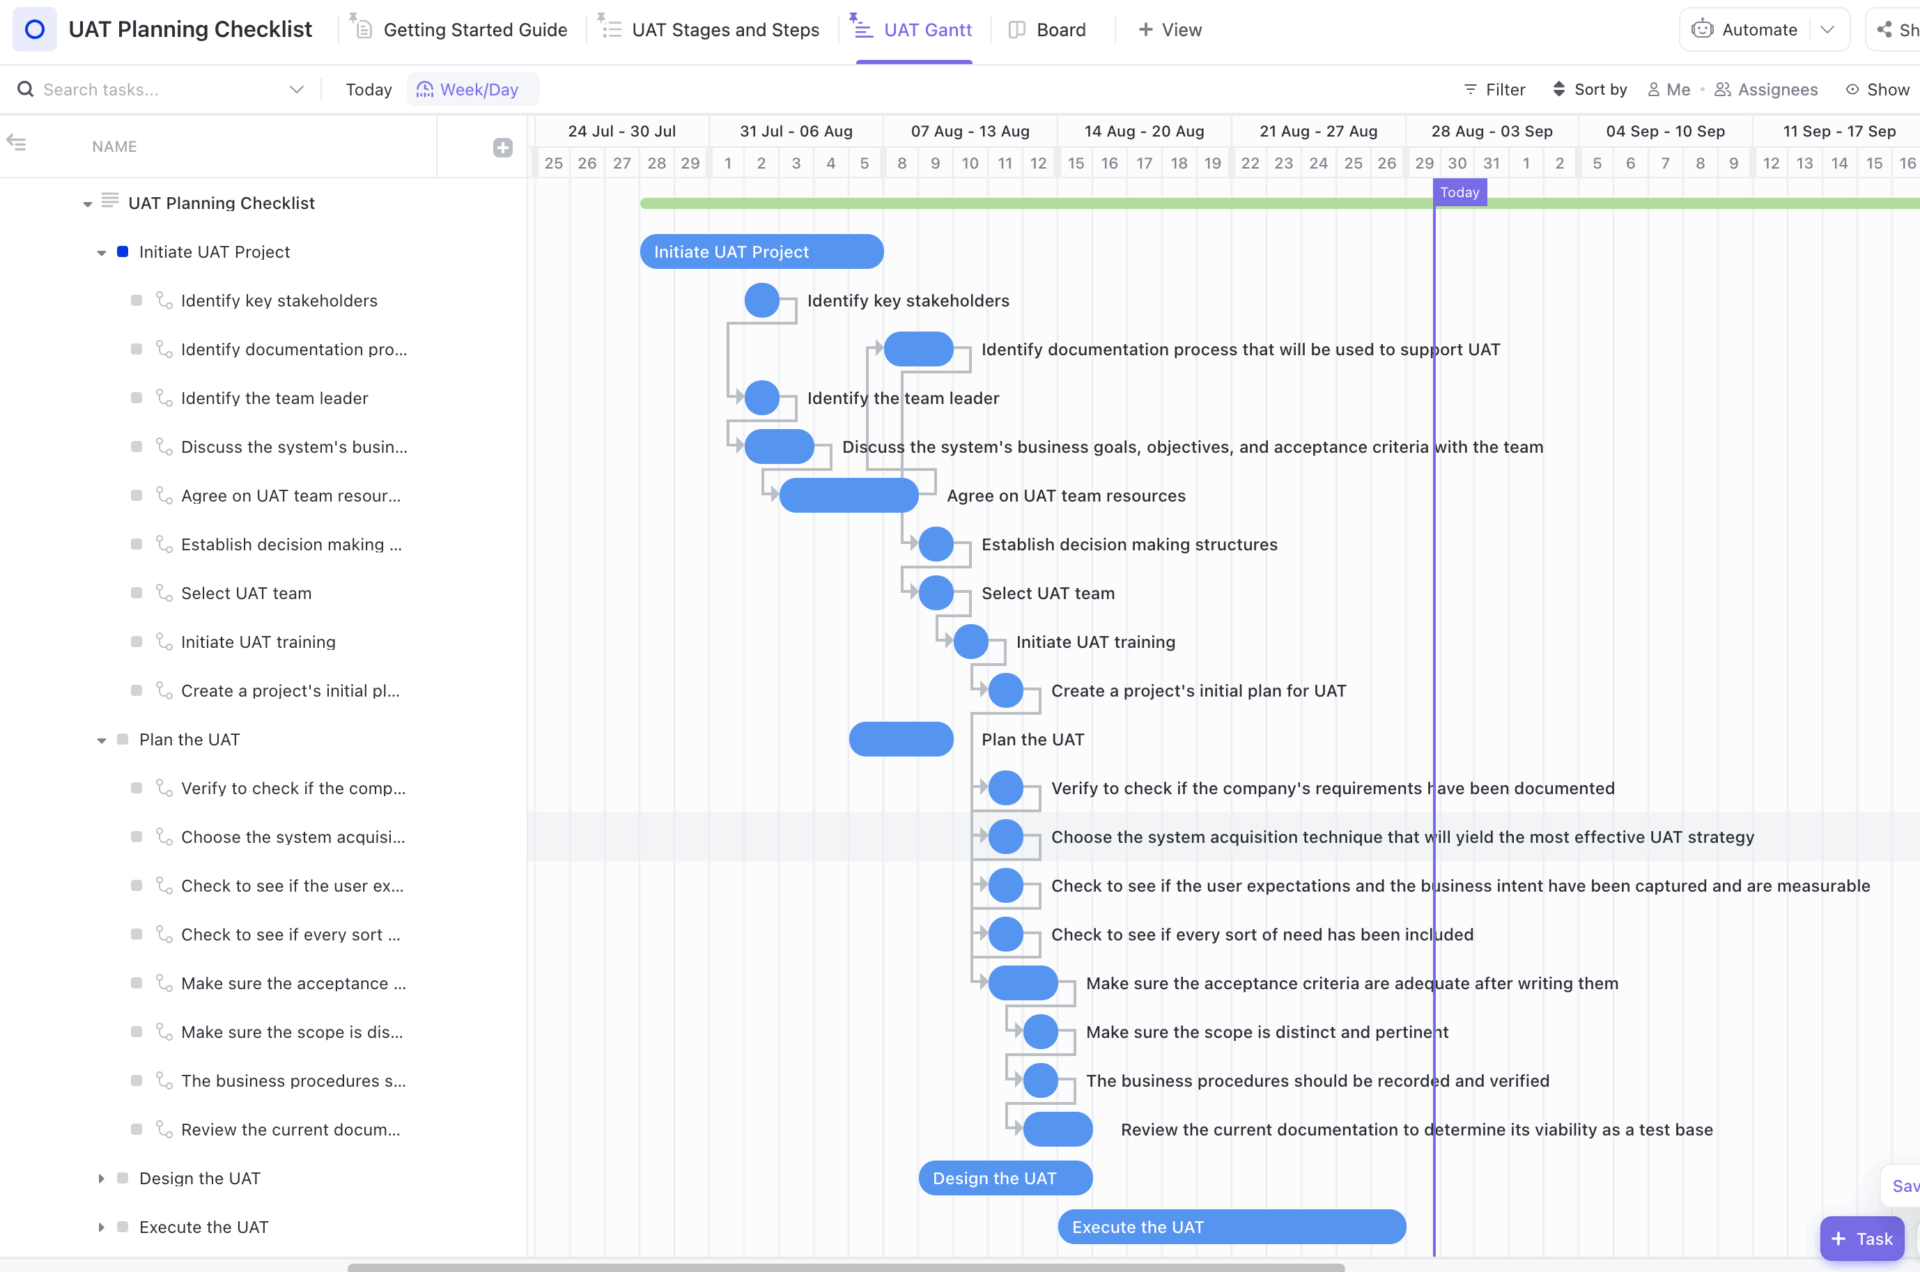
A product’s UI-UX can make or break your customer’s experience. This is why the ClickUp User Acceptance Testing (UAT) Checklist Template comes in handy. It ensures your software works technically while solving the problems your end-users care about.
Every testing scenario in this template follows a verified sequence of ‘Stages & Steps’ to prevent critical UX flaws from reaching production. The practice ensures that every stakeholder has clear guidelines to validate that the final product is launch-ready.
👀 Ideal for: QA leads and product owners who need a repeatable, foolproof process to confirm that a product meets all business requirements and user expectations before going live.
Without deep, quantitative data on user behavior, you can’t understand the why behind your adoption numbers.
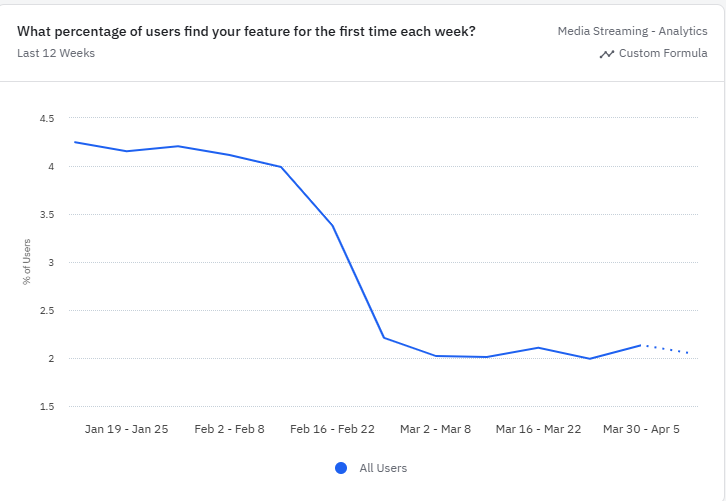
Try the Amplitude Feature Adoption Dashboard Template. It moves beyond surface-level clicks to measure how long it takes a user to actually benefit from a new feature.
👀 Ideal for: Product managers and growth hackers who need deep behavioral insights to shorten the learning curve and increase the lifetime value of their user base.
🦸🏻♀️ Monitor feature usage with the Feature Adoption Tracker Agent in ClickUp. It tracks meaningful feature engagement and produces a scorecard for each account.
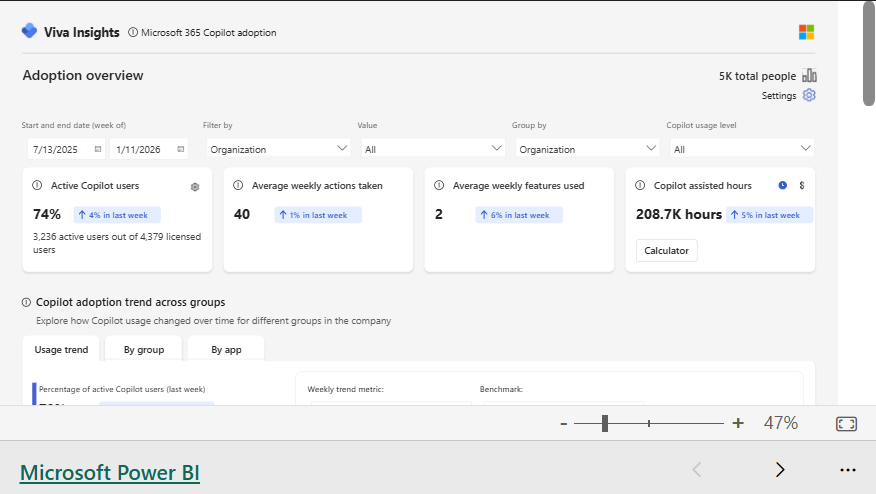
The Microsoft 365 Copilot Adoption Report Template is a deep-dive analytics framework that goes beyond basic license counts, revealing how AI is actually changing work habits.
With this template, you don’t have to guess whether your AI investment is paying off. It pinpoints which departments are building sustainable habits and which need targeted prompts or training to move past the novice stage.
👀 Ideal for: IT leaders and Digital Transformation Officers who need to quantify the ROI of their AI rollout and identify specific departmental barriers to full-scale adoption.
Great features don’t guarantee success—adoption does. And without a clear system to track how users discover, use, and return to those features, even the best ideas can fall flat.
Feature adoption tracking templates give your team that structure. Instead of relying on scattered analytics or intuition, you get a repeatable framework to measure performance, identify friction points, and double down on what actually works.
ClickUp’s converged AI workspace brings all of this into one unified system. From capturing feature requests and analyzing adoption metrics to managing rollouts and tracking feedback, everything stays connected—so insights don’t get lost and execution never slows down.
Start using ClickUp today to streamline your feature adoption tracking and turn every release into a measurable success.
The feature adoption rate is calculated by dividing the number of unique users who performed a specific feature action by the total number of active users during a set time period, then multiplying by 100. To make this metric actionable, define a usage event (e.g., clicking a button vs. completing a workflow) and set a consistent time window, such as the last 30 days.
The primary difference between feature adoption and product adoption is the level of granularity. While both measure user engagement, they track different stages of the customer journey. Product adoption tracks whether a user has integrated the software into their workflow. On the other hand, feature adoption identifies which specific tools within the product provide the most value and which are being ignored.
Product teams should review feature adoption metrics daily during the first week of a new launch to catch immediate friction, then shift to weekly reviews for the remainder of the first month. Once adoption stabilizes, a monthly review is sufficient to track long-term retention, while a quarterly audit helps teams decide which low-performing features should be improved, promoted, or sunset.

Praburam Srinivasan
Max 16min read
Praburam Srinivasan
Max 21min read
Praburam Srinivasan
Max 21min read

© 2026 ClickUp