Category archives: Goals
Goals and KPIs and OKRs, Oh My! Goal setting is vital in both life and work. Learn how to set objectives, what to track, and how to track them. 🏆
Goals
What Are Project Goals? Definition, Examples & How To Write Them

Templates
10 Free OKR Templates in Excel, Google Sheets, and ClickUp

Project Management
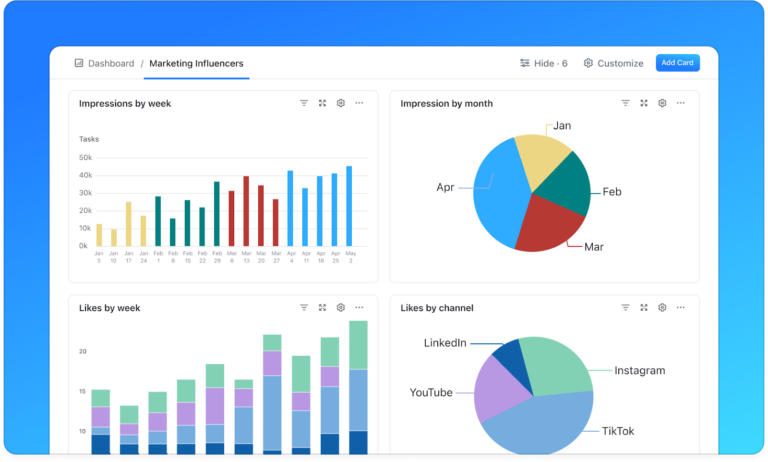
20 Project Management KPIs to Track in 2026
People Management
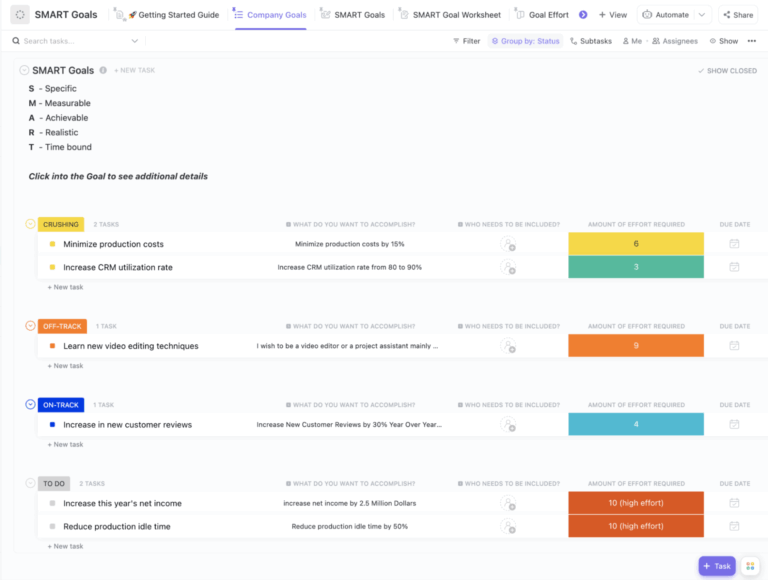
20 SMART HR Goals & Examples for Real Results in 2026

Project Management
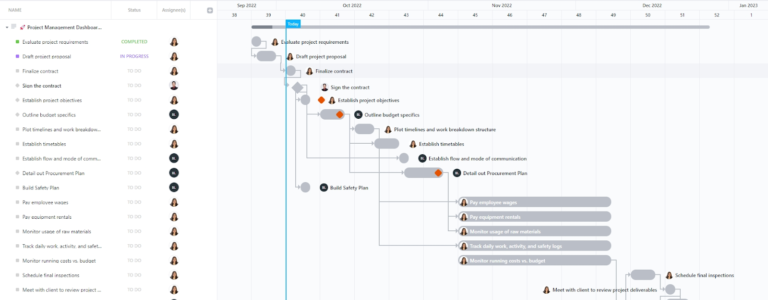
How To Set Project Management Goals That Work
Goals
100+ KPI Examples by Department for 2026
Goals
How To Set Marketing Goals That Drive Growth

Design
Design OKRs Examples to Reach Your Design Goals
AI & Automation
Understanding Goal-Based Agents for AI Optimization


Goals
65 Practical Startup Business Goals Examples To Craft Success in 2026

Goals
6 Goal-Setting Strategies & Techniques to Grow Your Business

