
You’ve a daily standup call where each team member shares their updates. But without a system to track progress, it’s hard to see the bigger picture—team members aren’t in sync, and you’ve no clear view of the project’s overall status.
This is where a centralized dashboard comes in. With all the team’s tasks in one place, you can easily track progress, identify blockers, and understand how the project is moving forward.
Jira’s dashboard helps you visualize task status and monitor project progress in real-time. In this article, we’ll guide you through setting up a Jira dashboard so you can keep your projects on track and get better insights.
How to Create a Dashboard in Jira to Improve Project Insights
How to Create a Dashboard in Jira
Whether you’re overseeing a small team or managing a large-scale initiative, a well-organized Jira dashboard can help you stay informed and proactive. Here is the step-by-step process outlining how to create a dashboard in Jira.
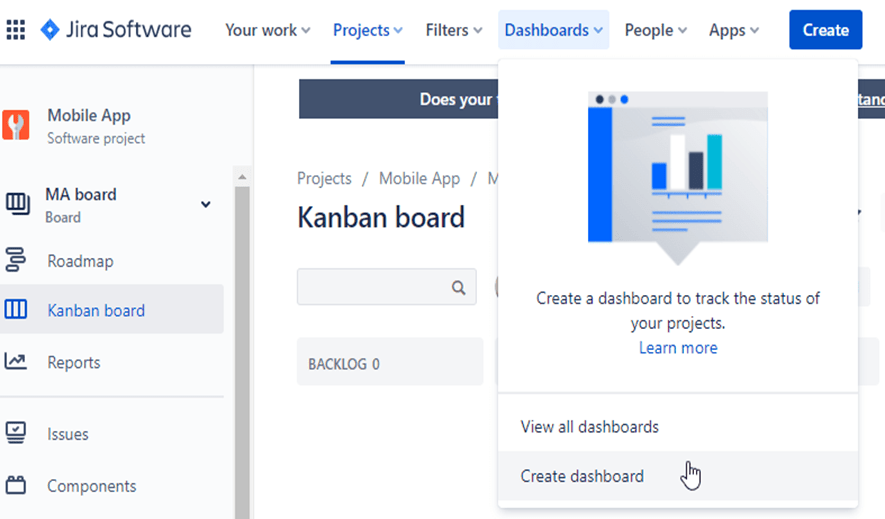
Step 1: Set up your dashboard page
Click the Jira icon > Dashboards to open the dashboard page. Next, click the ••• button and select Create dashboard.
Now, name your new dashboard and add a brief description to explain its purpose.
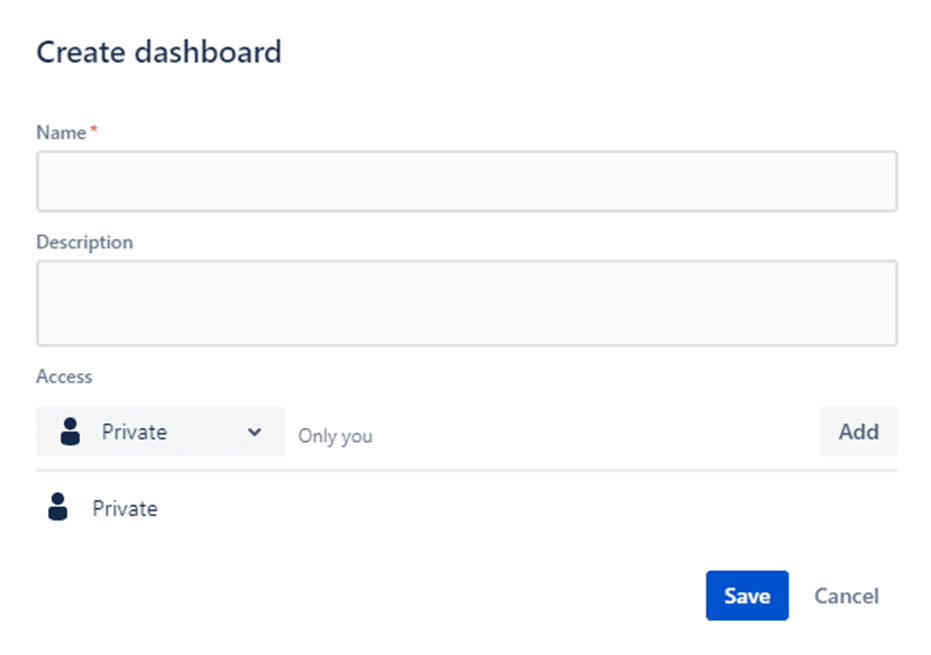
Fill out any additional fields and click Save.
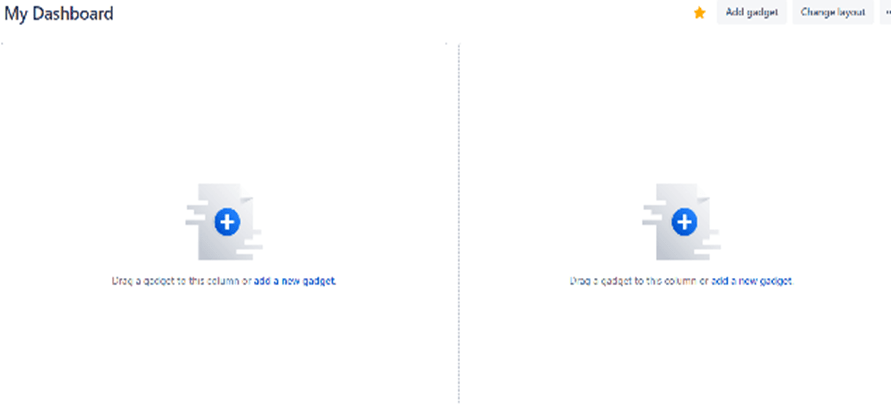
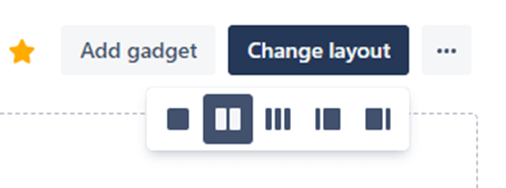
Choose a layout on the dashboard page. Click Edit, then select Change Layout to pick your preferred dashboard layout (e.g., two or three columns).
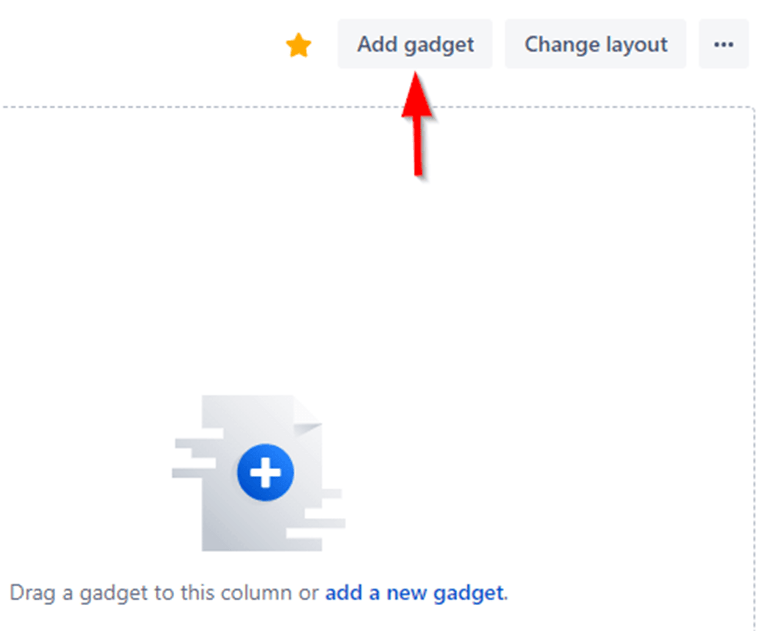
Step 2: Add useful Jira dashboard gadgets
Now that your dashboard is set up, enhance its functionality by adding essential Jira dashboard gadgets.
You can also search for different gadgets to customize your workflow.
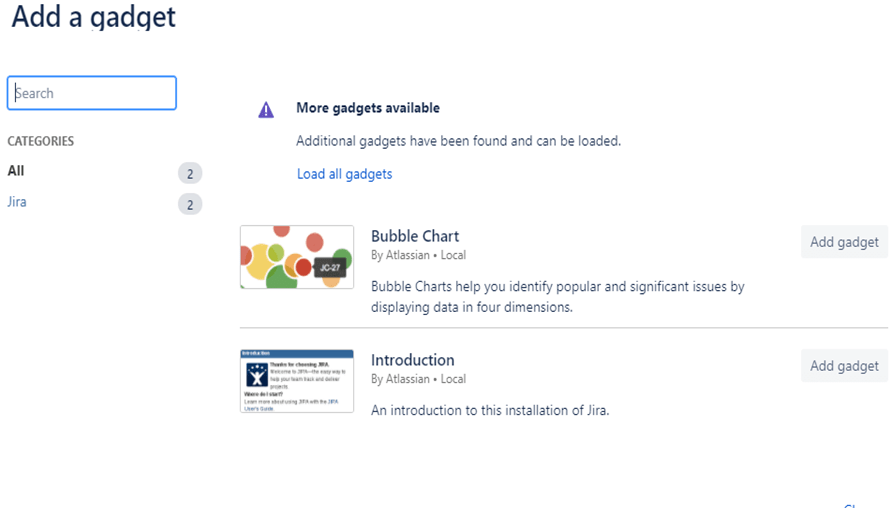
Here are some useful Jira gadgets you can add:
- Filter Results: Displays a list of issues based on specific filters you set, giving you a snapshot of your project’s current status
- Created vs. Resolved Chart: Visualizes the number of issues created compared to those resolved over a specific time frame, helping you assess project progress
- Issue Statistics: Offers insights into issues based on various criteria, such as assignee or component, so you can see where work is being focused. (Add this one twice for different views!)
- Road Map: Shows the progress of issues planned for upcoming releases, allowing you to keep an eye on what’s ahead
Step 3: Configure gadgets for quick insights
After adding your gadgets, configure them to get detailed insights. Click on each gadget to configure its settings. We’re using a Sprint Gadget below.
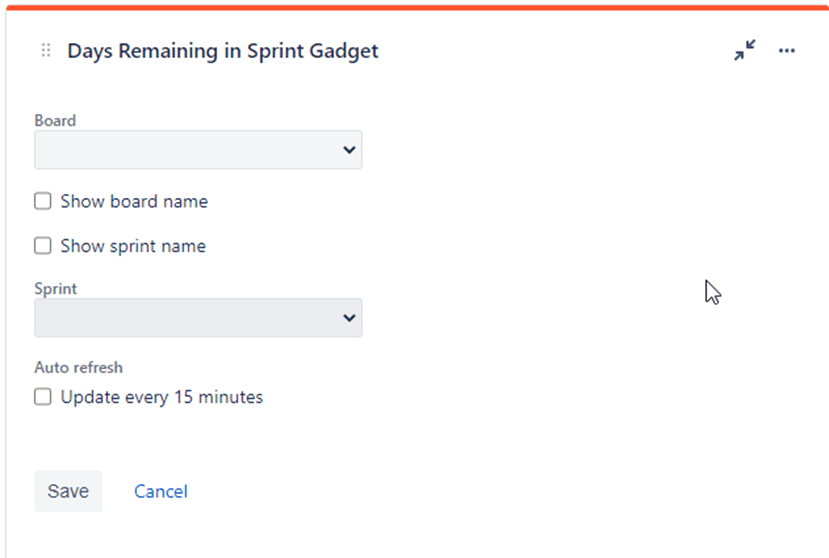
For example, for the Road Map gadget, focus on one project and leave other fields at their defaults to keep it simple. For the Issue Statistics gadgets, you can select different projects and set them up to compare stats by Assignee for the first field and by Component for the second one.
Step 4: Monitor workload and progress
Now, you can use your Jira dashboard to get an overview of your team’s workload and project progress.
Here is how you can use the gadgets to monitor workload in Jira:
✅ Regularly check the Road Map to gauge how many issues are assigned and resolved for your next release
✅ Monitor the Issue Statistics gadgets to identify who has a heavier workload and where efforts are concentrated
Step 5: Keep an eye on high-risk items
As a Jira Admin, it’s crucial to stay aware of high-risk issues that might affect your project timeline. You can create filters to highlight issues in the system dashboard with larger time estimates or those that have been modified recently.
Configure your Filter Results gadget to display the high-risk items in the system dashboard, ensuring that they remain visible and manageable to each logged-in user.
💡Pro Tip: Don’t overload your dashboard with too much information at once. Start small and build it out as needed. Your dashboard should be simple, clear, and focused on what matters most to you.
That’s it! You’re all set with a powerful Jira dashboard that will help you keep tabs on progress and ensure your project stays on track.
How to Share a Jira Dashboard
Once you’ve crafted the perfect Jira dashboard for your competitor analysis, it’s time to share it with your team so everyone can stay on the same page. Here’s how to share the Jira dashboard in a few simple steps:
Step 1: Open your dashboard page
First, navigate to the dashboard you want to share. You can find it under the Dashboards menu in Jira.
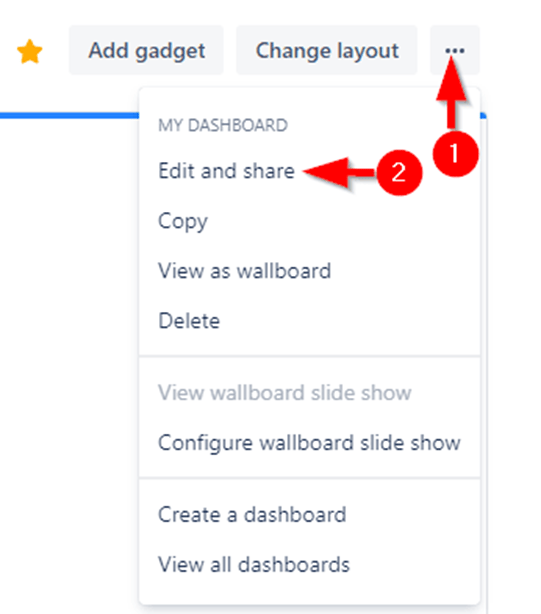
Step 2: Edit and share
Look for the ellipsis icon (•••) on the right side of the dashboard. Click on it and select Edit & Share from the dropdown menu. This will open up the sharing options.
Step 3: Choose access levels
You’ll see a section labeled Access with a drop-down arrow. Click on it to reveal a list of project members, teams, and your entire organization.
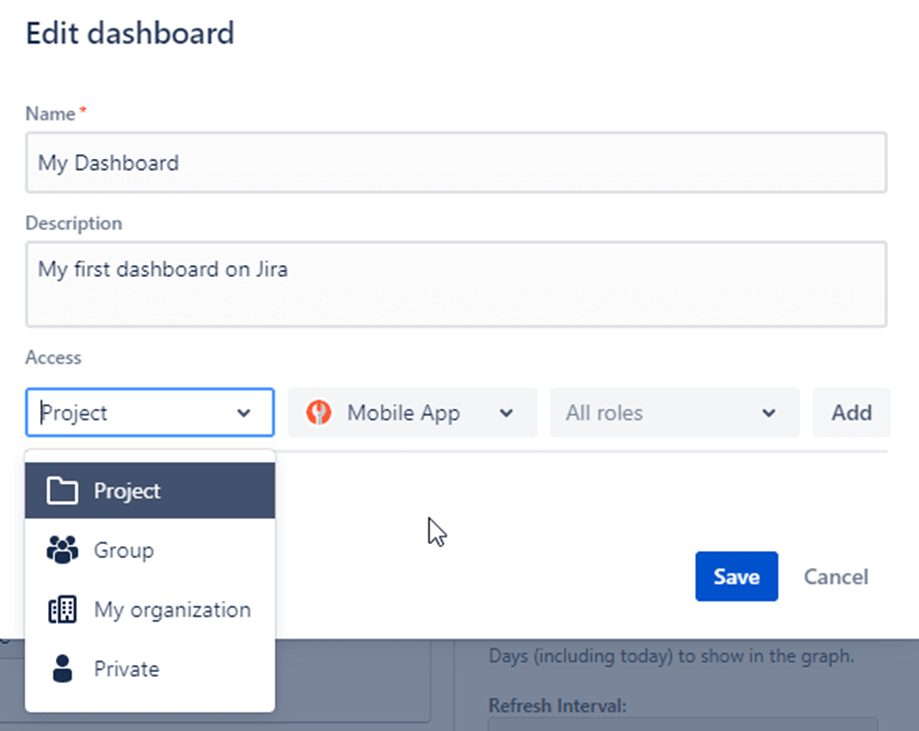
Step 4: Select team members
Go through the list and choose the employees or teams you want to grant project viewing or editing permissions. Select their names to add them.
Step 5: Save your changes
After you’ve made your selections, don’t forget to save your changes. This will ensure that everyone you selected can now view your dashboard!
And that’s it! You’ve successfully shared your Jira dashboard with your team, making collaboration smoother and keeping everyone in loop.
Limitations of Creating a Dashboard in Jira
Jira is highly flexible when managing projects and staying organized. However, it has certain drawbacks. Let’s take a look at some of the limitations you might encounter when creating dashboards in Jira.
No built-in resource management
It can be tricky to allocate resources efficiently across multiple projects in Jira. This includes tracking team availability or ensuring that people aren’t being overworked or underutilized. Without necessary tools to perform these functions, managing bottlenecks or resource conflicts can become a challenge, making it harder for users to keep productivity high.
Limited portfolio management
When it comes to managing multiple projects at a strategic level, Jira falls short. It doesn’t have built-in tools to help you align projects with business goals, balance resources across several projects, or keep an eye on the overall health of a project portfolio.
To fill this gap, users often need to rely on external tools or integrations to create effective project dashboards.
No budget tracking option
Jira doesn’t offer features for tracking project budgets, like monitoring hours worked or associated costs. This can be a big drawback for organizations that need to stay on top of expenses and avoid going over budget.
Difficult to balance flexibility and standardization
Jira offers plenty of flexibility, which is great for teams that want to customize the platform to suit their needs. But this can also create problems.
If different teams or departments start using Jira in their own way, it becomes harder to standardize processes across the organization. This lack of consistency can make it tough to consolidate and compare data, leading to inefficiencies.
Weak decision-making support
While Jira gives some insights into team performance and progress, it does not offer granular insights needed for making critical decisions.
For example, you can’t easily simulate future workflows, assess the feasibility of a release, or gauge how changes will affect the project’s timeline or team workload. This lack of foresight can lead to higher uncertainty and increased risk of making poor decisions. Having more robust agile dashboards for project forecasting can improve decision-making capabilities.
Create Dashboards With ClickUp
If you want a unified view across teams and projects, exploring Jira alternatives like ClickUp can make a significant difference in your overall productivity and project success.
In addition to being an excellent productivity and project management platform—ClickUp is also one of the best dashboard software. Known for its versatility, it allows teams to manage tasks, collaborate on projects, and track their progress all in one place.
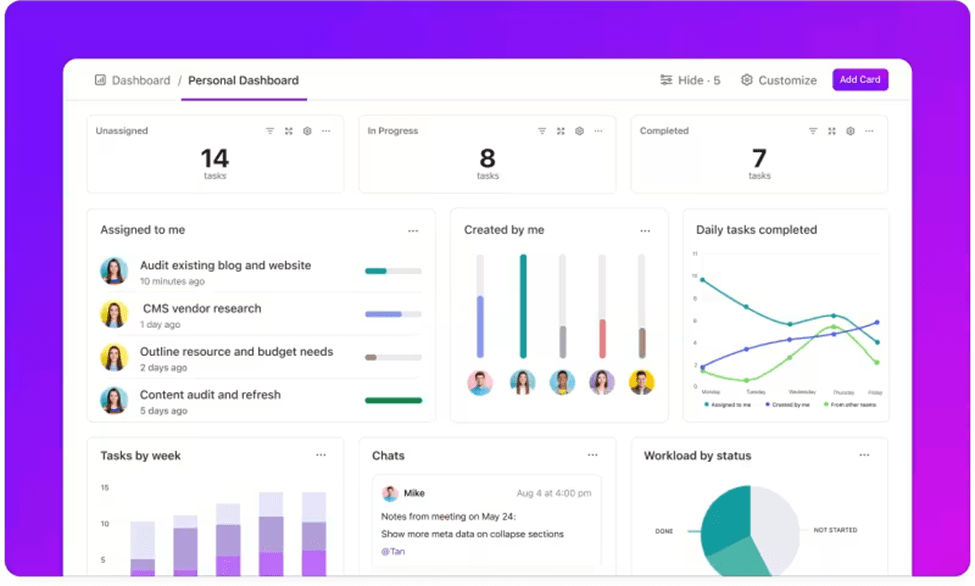
You can create custom ClickUp Dashboards that give you a clear, visual overview of everything from team workloads to project status. This feature allows you to add 50+ custom cards to your dashboard, whether that’s time tracking, task queue, chart views, or performance metrics from your website (more on this later!).
Set personal goals and track your progress with ClickUp
Let’s see how you can use ClickUp Dashboards.
Manage team workloads
With Jira, you can only track task status with little to no information about your team’s workload. However, ClickUp provides a complete view of your team’s tasks and deadlines to ensure work efficiency, visualized in your preferred way. The best part is that ClickUp’s Project Management Solution lets you align projects and resources with real-time updates.
💡Pro Tip: You can also create a customized people analytics dashboard or work dashboard, to avoid overloading team members and enhance project quality.
Accelerate software delivery
Unlike Jira, ClickUp doesn’t require a technical team to set up software development projects. When you switch over from Jira to ClickUp, you can easily create a sprint dashboard to track project progress. It helps you get real-time insights into sprint lead time, cycle time, and other sprint metrics.
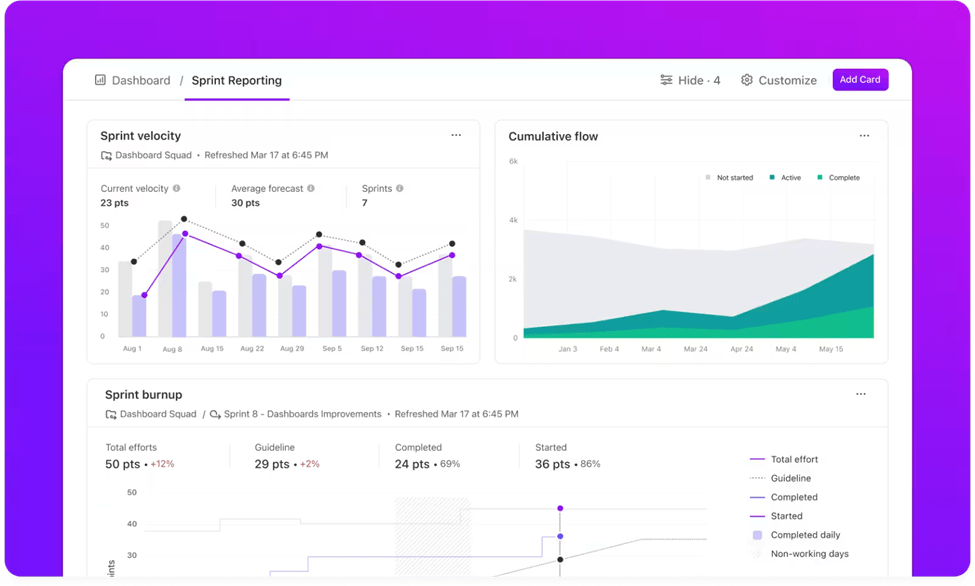
With user-friendly features and plenty of customization options, you’ll have a powerful dashboard up and running in no time.
💡Pro Tip: If you want to learn in detail about how to set ClickUp Dashboards, watch this quick setup guide.
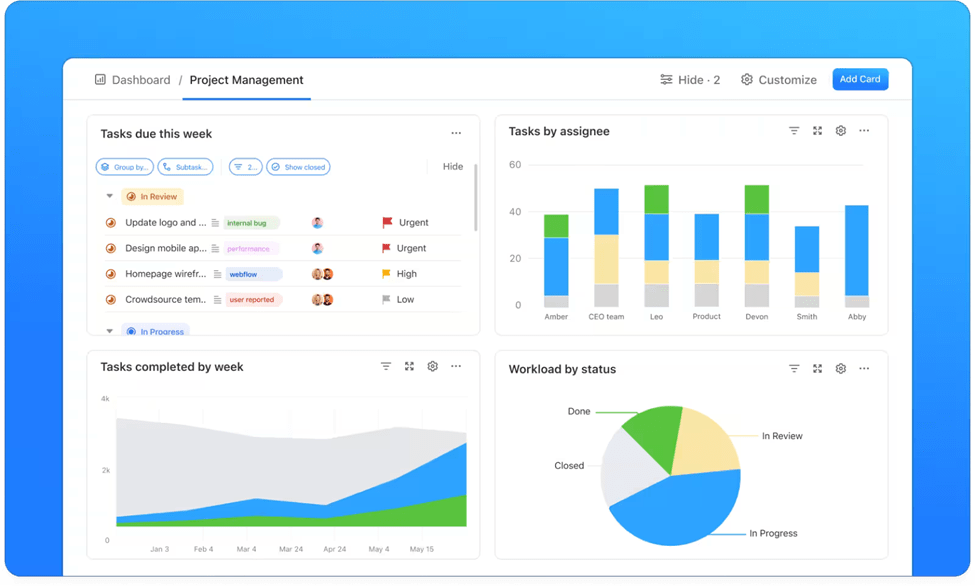
Visualize projects
Visualizing projects is a lot easier in ClickUp as compared to Jira. ClickUp’s Dashboard View helps you convert your workflow into charts and graphs so you can get an overview of team efficiency, deadlines, budget spent, and more. Simply go to your workspace, click add view and select Dashboard View to create a personalized dashboard.

Integrate seamlessly with other tools
Your dashboard is just one piece of the puzzle. ClickUp offers over 1,000 integrations with popular tools, allowing you to pull relevant data from different platforms.
If you’re using Jira, ClickUp has got you covered! ClickUp’s Jira Integration allows you to sync issues and tasks between the two platforms. You can easily keep track of your development progress in Jira while managing your overall project and team tasks in ClickUp. The integration streamlines your workflow, so there’s no need to duplicate efforts or lose track of updates
ClickUp’s integrations let you aggregate data from various sources, reducing manual data entry and keeping your workflow efficient. Whether it’s pulling reports from your sales tool, tracking customer support tickets from Zendesk, or syncing tasks from Jira, ClickUp’s centralized approach enhances productivity and minimizes errors.
Visualize data with custom widgets
Once you’ve set everything up, it’s time to visualize your data. As we mentioned earlier, ClickUp’s Dashboards feature lets you choose from over 50 different widgets to display your goals, tasks, and key performance indicators.
- Dynamic widgets: You can use widgets like a bar chart, pie chart, line graph, and more to visualize your KPIs. This helps everyone on your team quickly understand the status of projects and tasks
- Customization options: You can tailor each widget to display the data that’s most relevant to your team. For instance, you might want to display the number of tasks completed versus tasks pending, or track the status of various projects across different teams
- Embed external tools: Better yet, you’re not limited to data sources within ClickUp. You can add third-party apps to your dashboards using a simple link or by embedding code. This flexibility allows you to enrich your dashboards with information from various sources
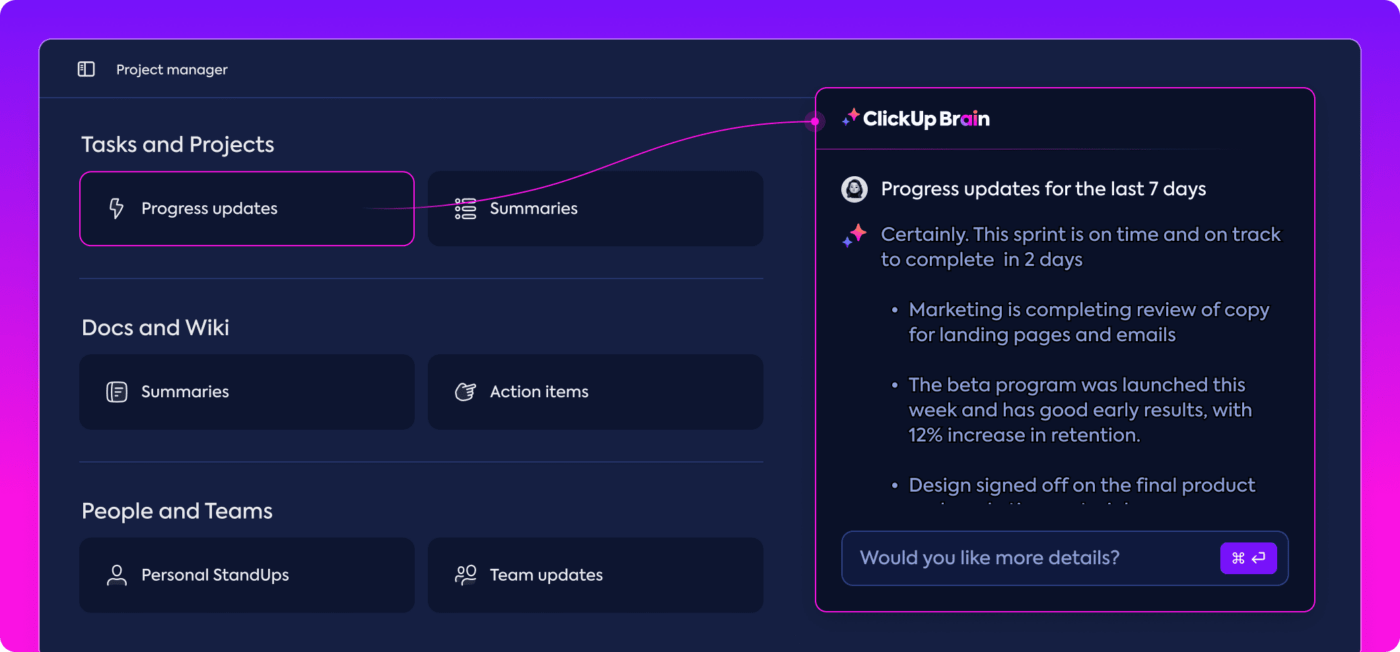
Get instant answers
Need quick insights from your dashboard? ClickUp Brain makes it incredibly easy. You can ask any question, and ClickUp Brain’s AI Knowledge Manager will instantly search through all the data in every dashboard across your workspace and get you the answers you need. This search feature reduces the need for random pings and distractions, helping your team stay focused and productive.

You can also use ClickUp Brain for:
- Writing assistance: Enhance your writing with built-in spell check, quick reply suggestions, and AI-generated content that aligns with your desired tone and style
- AI-powered documentation: Create transcripts of meetings and generate essential documents quickly, streamlining your documentation process and keeping everything organized
- Automation: Generate project summaries, action items, and subtasks automatically, reducing manual work and ensuring efficient tracking of project progress
Take Projects to the Next Level With ClickUp Dashboards
If your Jira dashboards aren’t fully meeting your needs, consider switching over to ClickUp. It offers powerful dashboard capabilities and includes ready-made templates, seamless integrations, and automation features that enhance productivity.
With ClickUp, you can effortlessly set and track goals, visualize data through customizable widgets, and quickly access information. Transitioning to ClickUp could be the solution to streamline your workflows and ensure your team has all the tools necessary for success.
Sign up for ClickUp today!

Everything you need to stay organized and get work done.
