
Ever wondered how computers learn on their own? Yeah, me too!
Ever since the intersection of lightning-fast hardware and brilliant software, machines have been learning how to think like humans.
The otherworldly algorithms that drive growth and self-improvement actually exist! But how is any of this possible? The entirely rule-based system is called machine learning.
It’s not as complex as it sounds. At a high level, all machine learning algorithms can be classified into two categories, supervised and unsupervised learning.
For the most part, you’ll interact with the benefits of supervised learning at sites like Google, Spotify, Amazon, Netflix, and tons of new web apps, so let’s start off with how supervised learning works.
Supervised learning
The important distinction here is supervised learning is guided by human intelligence, observation, and known outcomes.
In other words, we tell an algorithm the difference between “right” and “wrong” and ask them to mimic those results when new information is thrown their way.
With a well-built algorithm, the machine will be able to create a model to decipher patterns and improve its own efficiency, becoming more accurate over time.
The biggest negative with this type of learning is having enough data that includes all anomalies and edge-cases to accurately teach the algorithm how to handle each unique situation.
Supervised learning can be further divided based on the prediction method used.
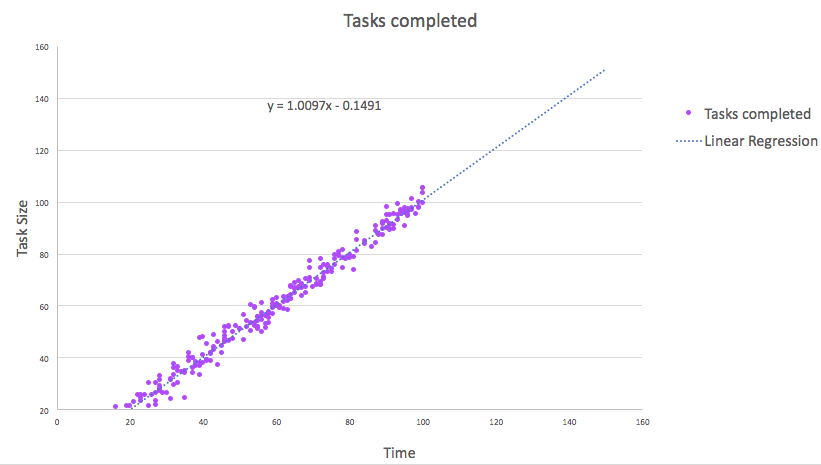
- Regression: used when the output variables are real values, such as scrum points or completion times
- Classification: commonly utilized when dealing with outputs that represent classes
Linear Regression – A modeling function that assumes a linear relationship between the input variables x and the single output variable y and creates a trend-line (prediction model) using the formula y=ax+b
Logistic Regression – Also known as exponential (x2, x3, …, xn) or polynomial (y=ax2+bx+c) regression, is similar to linear regression but the trend-line (y=1/(1+ex)) is assumed to be of a higher order
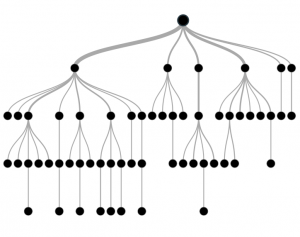
Decision Trees – Generated from a sample data set with classification results, creating a visual flowchart mapping the entire classification process
ID3 Decision Tree Algorithm:
One of my favorites. I think we should go through an example.
It’s brilliantly simple and makes analyzing large data sets a walk in the park. This decision tree applies entropy (E) at each layer/branch to determine which set (column) of data to analyze on its next iteration.
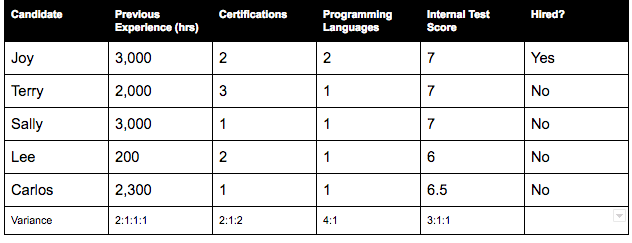
Let’s look at the data set below to determine if a new candidate gets hired.
First, we need to cleanse the data by condensing the variance results of each column into binary results: pass or fail.
To do this we will say the candidate needs to know multiple programming languages, have a score of 6 or above on our test, have acquired two or more certifications, and have worked more than 2,500 hours at previous jobs.
Applying these restrictions condenses the variance values as follows:
Second, the algorithm finds the column with the most variance to reduce entropy as much as possible in the first stage. This would be either the previous experience (variance = 2:3) or certifications column (variance = 3:2).
The ID3 Decision Tree algorithm would then produce a flow as follows.
With the tree built from our training data, we can now feed new candidates into the system and quickly see if they will be hired.
Naive Bayes Algorithm – The probability of an event happening if another event is known to have happened P(A|B)=(P(B|A)P(A)) / P(B)
- P(A|B) = probability of A given that B happens
- P(B|A) = probability of B given that A happens
- P(A) = probability of A
- P(B) = probability of B
Let’s go through a common example related to software developers living in Palo Alto, California. Our hypothesis is: software developers will work if their internet is fast.
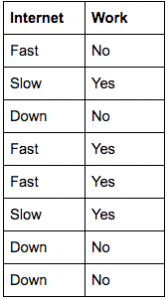
We need to find if this is actually true. First, we survey some software developers regarding their work activity and test their internet connection speed:
By applying the Naive Bayes algorithm to this small data set, we can determine the probability of our assertion being correct.
We’ll use the term ‘Work’ in the event that the developer is working and the term ‘Fast’ if the internet is above 40 mbps.
Our equation:
P(Work|Fast) = P(Fast|Work)*P(Work) / P(Fast)
- P(Fast|Work) = 3/4 = 0.600
- P(Work)= 4/8 = 0.500
- P(Fast) = 3/8 = 0.375
Now, P(Work|Fast) = 0.66 * 0.286 / 0.375 = 0.80, which implies an 80% probability of these developers slacking off if they live in Palo Alto and are therefore forced to pay Comcast for their internet needs.
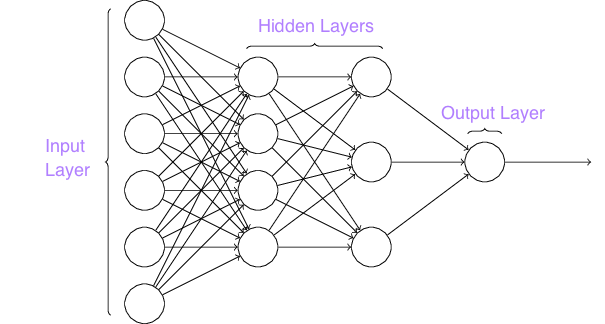
Artificial Neural Network (ANN) – The most popular deep learning technique in recent years, the ANN is a system of algorithms intelligently constructed to optimize the processing power of its own network.
The ANN has received a lot of hype in recent years for its incredible self-improvement methods. These tools are where applications like personal assistants will be born.
Similar to neurons in the human brain, artificial, deep neural networks are formed by interconnected “neurons” with a varying weight that depends on result experience.
The input layer below is fed raw data (text, images, sounds), and the output layer delivers a confidence result that hopefully matches your desired results.
When the result is poor, the network tries again with updated settings.
The benefit here is that each neuron can be formulated to utilize a single algorithm that could be good for certain data sets or poor for others.
As weights are adjusted for each neuron, the “brain” learns where to best analyze the data for the highest confidence output and continues to adjust the neuron weights to fully optimize the network.
When you feed more data in, the machine gets smarter and more efficient at interpreting future inputs.
Neural networks have proven to be the most accurate of all systems for large deep learning problems with the only downside being the time it takes to set up and train.
Unsupervised learning
On the surface, unsupervised learning feels mysterious. There is no instruction on which outputs are right or wrong. They have no human guiding them in their interpretation of the data they are handed (other than the guidance of the algorithm’s original author).
Algorithms of this nature must rely on clustering data and modifying themselves to account for new data structures.
With extremely large sets of data, these algorithms are immensely powerful and capable of finding undiscovered patterns from seemingly random data.
To visualize this process, imagine a child being introduced to the world for the first time.
Their first interaction with a four legged animal might be associated with hearing someone call out the word “dog.” When the child then sees a cow, cat, or even another dog, he thinks “dog” for each of them.
This is because the natural classification methods installed in a human brain informed him that the trait ‘four legs’ is associated with a specific animal type.
As the child grows and sees more 4 legged animals, additional, detailed classifications emerge. Dogs, cows, and horses are all discovered to have distinct traits and become subsets of four legged animals in the child’s mind.
Let’s see how computer scientists are able to translate this idea into a program by looking at the four main categories of unsupervised learning.
- Clustering: Reduces large datasets into much more digestible groups of information, and makes predictions for classifying future data points based on the discovered groups. Used by all modern search platforms.
- Descending Dimensions: Transforms high-dimensional data into a smaller number of dimensions through ideal-compression.
- Association and Recommendation Systems: These constructs utilize clustering algorithms to anticipate what a user might be interested in based on as much historical data as they can get their hands on.
- Reinforcement Learning: A combination of learning types heavily reliant on unsupervised algorithms.
k-NN Clustering: This is the most basic, widely used clustering algorithm.
It is able to classify new data points into a category based on the relationship to known data points.
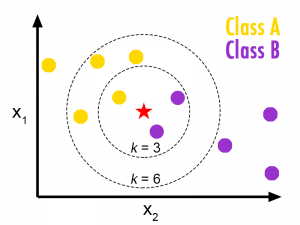
Imagine a scatterplot. You are able to compute the distance between any two data points, and two clusters of data points have just been recognized and categorized by the system.
Let’s say a new point is dropped into the plot (shown below as a red start).
- The computer first checks the value of ‘k’ which we will say is three.
- Then it calculates the distances between the new point and its three nearest neighboring points.
- Finally, the data point is categorized in relation to the highest percentage of nearby points. In the following picture, you can see how one might get different results if ‘k’ is set to three vs six.
K-NN clustering is effective, but computationally intensive. This algorithm demands storing an entire dataset and running ‘k’ distance calculations for each new data point selected by the algorithm.
This is a computer’s solution to technology problems like pattern recognition, software testing, speech classification, and image identification.
k-Means Clustering: This method attempts to split data into ‘k’ groups, where ‘k’ represents the number of groups you wish to define.
Want to split your data into three groups? Set ‘k’ to three.
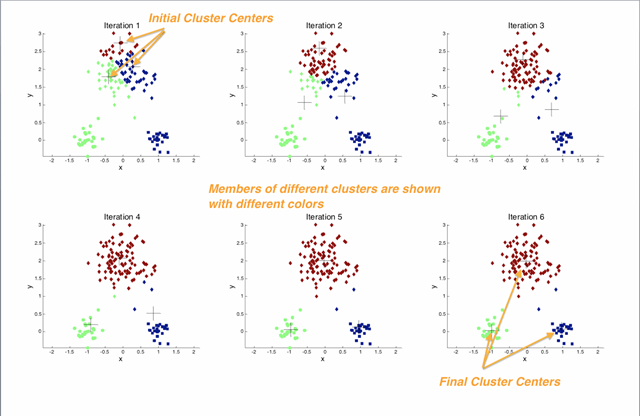
To start, your computer will randomly set three centroidal points to create your clusters.
K-Means is an iterative algorithm that will keep replacing the centroids until the most optimal position is found.
When the algorithm is assigning clusters (step 1 of 2), it checks the distances of each point to each centroid and assigns the point to the closest centroid.
Next (step 2 of 2) the centroid is moved to the average position of the points assigned to it. These steps are repeated until the optimal position for each centroid has been located
Descending Dimensions: Dimensionality reduction is extremely useful in reducing computer processing time.
Re-arranging/merging data sets in this way often reveals associations that would be hard to otherwise distinguish.
When possible, you should always enforce this concept to high-dimensional data.
For example, San Francisco offices have four features: room length, room width, number of rooms, and floor levels.
Given these classes of data, the data would have to be represented in a four-dimensional scatterplot. However, you can remove redundant information and reduce this data to a much more easily processed three-dimensional scatterplot.
We can combine ‘room length’ and ‘room width’ as a single dimension ‘room area’ with the method of descending dimensions.
Association and Recommendation Systems
Association analysis covers all of the algorithms that you’ve seen on sites such as amazon.com that display things like “Customers who bought this item also bought…” or when Netflix shows you the currently trending movies.
Simple association analysis deals with “current session” information which means that no prior knowledge of the user is known.
Recommendation systems, on the other hand, take this a step further and factor in past behavior including everything from sites you’ve visited to who your friends on Facebook are and what they’re interested in.
These have become extremely accurate but require very thorough information on the user and the items they are searching.
Reinforcement Learning: Often considered the “most advanced,” reinforcement learning utilizes delayed deep learning, mixing delayed-supervised-knowledge with an unsupervised algorithm.
This allows the computer to learn by experience.
You’ll often find this in artificial intelligence systems that allow a computer to slowly explore and fight in a video game.
As simple tricks and actions are learned to have a positive impact on situational outcomes (ex: avoiding death), the computer stores these in its arsenal for a real battle.
After some time, the computer is ready to be introduced to a brand new world with a full scale war.
We now find that the computer is able to compete on the same level as many humans (often even better).
This system of semi-supervised learning can also be referred to as ‘Q-Learning’ where positive reinforcement increases Q while negative decreases Q.
At ClickUp
In its current state, the machine learning features at ClickUp are silently learning trends, behaviors, and teams in the background.
As we roll out future updates, you’ll notice that the more you use ClickUp, the smarter it gets.
Over time, ClickUp will automatically predict who you’ll assign certain tasks to, where you’ll put those tasks, and even determine if time estimates are accurate.
Be on the lookout for a progressively smarter ClickUp in the near months!
Want to learn more?
There are some amazing resources open to the public, and I wanted to share with you what I’ve found to be the most helpful for newcomers.
- Free Training Data: Kaggle
- YouTube: Machine Learning Recipes, Architecting Predictive Algorithms for Machine Learning, Supervised Learning – Georgia Tech – Machine Learning
- Podcasts: The Data Skeptic, Linear Digressions, and Learning Machines 101
- Coursera: https://www.coursera.org/courses?languages=en&query=machine+learning
Let us know where else you would like to see machine learning in ClickUp! Let’s get productive!


