

Sorry, there were no results found for “”
Sorry, there were no results found for “”
Sorry, there were no results found for “”
Excel is a versatile tool, no doubt about it.
One of its great perks is that it allows you to create and manage a Work Breakdown Structure (WBS) like a pro. In this guide, we walk you through exactly how,
Plus, you’ll learn about the best templates to save you time when project planning and organizing your project tasks.
But first, let’s learn what is an Excel Work Breakdown Structure.
A Work Breakdown Structure (WBS) is a hierarchical representation of tasks, subtasks, and work packages required to complete a project. It helps project managers visualize the scope of work, allocate resources, and monitor progress.
An Excel work breakdown structure is created and managed using Microsoft Excel and gives you an overview of the project schedule as well. It allows teams to see their project tasks and how one process flows into another—all in an Excel file if the WBS template is built in Microsoft.
Additionally, a clear and concise WBS template should help you communicate project goals and expectations more effectively with your team members, stakeholders, and clients. No matter the project phase, a WBS tree diagram or tree structure gives you more detailed information for more manageable tasks within that Excel download.
Knowing how to build a work breakdown structure or a WBS template seriously helps the entire project team manage smaller, more digestible parts of the project. Well-designed work breakdown structures help you estimate project scope, a project timeline, and overall costs more accurately.
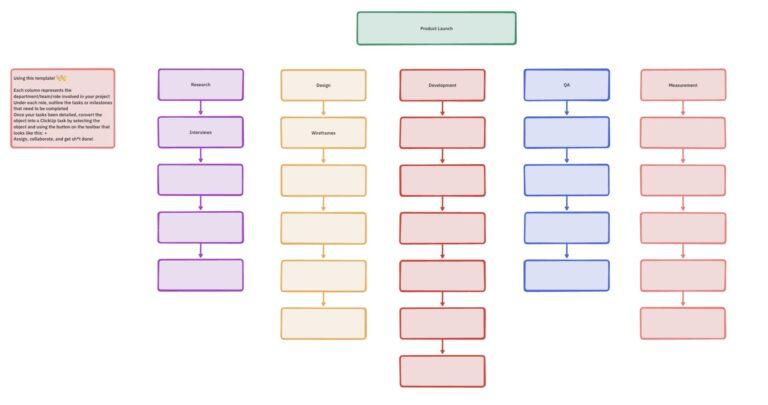
Break your project into manageable pieces with the ClickUp Work Breakdown Structure Template. It keeps tasks organized and progress visible, making project planning easier than juggling complex Excel sheets. Try it for free!
By creating a clear and comprehensive WBS, you can communicate project goals and expectations more effectively with your team members, stakeholders, and clients, which can lead to better collaboration and outcomes.
Here’s a five-step process for creating a work breakdown structure for your next project.
Begin by opening a new Excel workbook. Rename the first worksheet as “WBS” by right-clicking on the tab at the bottom of the screen and selecting “Rename.” In the first row of the worksheet, create headers for the following columns:
Format the header row with bold text or background color to visually set it apart from the data rows.
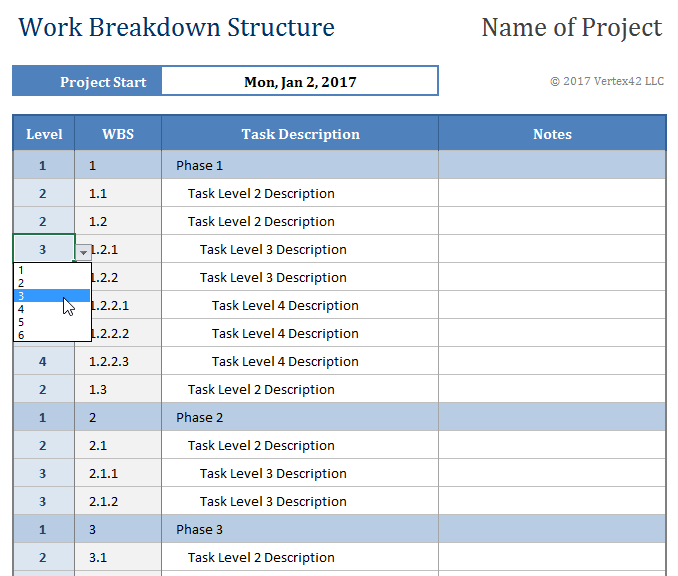
First, list the primary tasks of your project in the Task Name column. Assign a unique WBS code (or WBS numbering) to each main task, typically using a numbering system [e.g., 1.0, 2.0, 3.0].
Next, enter subtasks underneath each main task, again assigning appropriate WBS numbering.
For example, subtasks under the main task “1.0” could be labeled as “1.1,” “1.2,” and “1.3.” To visually separate subtasks from main tasks, use the “Indent” button in the toolbar or press “Ctrl + Alt + Tab” while the cell is selected.
If your project requires further breakdown, add additional levels of subtasks by following the same numbering and indentation patterns.
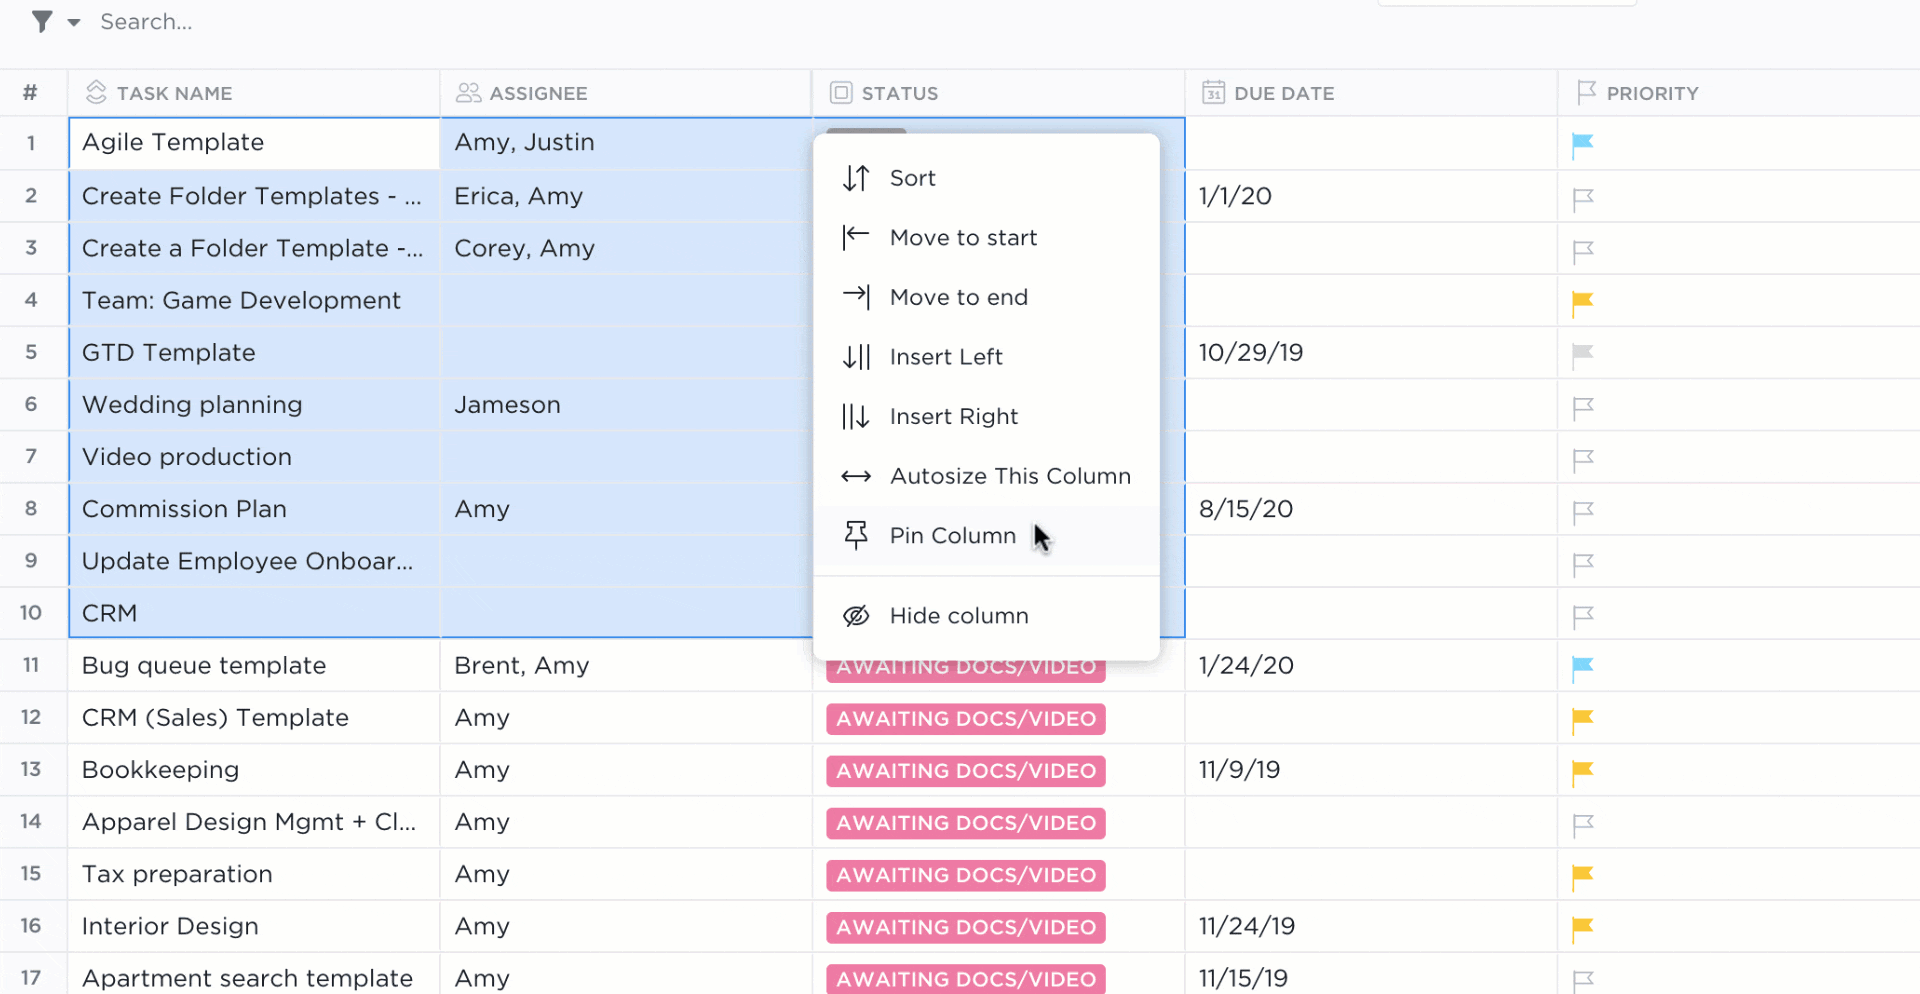
EASILY MOVE TASKS AND SUBTASKS FROM CLICKUP’S TABLE VIEW
You can create tasks in any part of your Workspace and then transfer them to other Lists within the same Workspace. This feature allows you to build a project plan in a single List and then move tasks to other Lists to represent different project phases. Additionally, you can transfer tasks assigned to other teams into their respective Lists.
For each task in the WBS, assign a level based on its position in the hierarchy. For example, the main tasks would be assigned Level 1, their immediate subtasks Level 2, and so on.
Next, identify any tasks that must be completed before a given task can begin. These are the predecessor tasks.
Enter the WBS code of the predecessor task(s) in the Predecessor column for each relevant task. If a task has multiple predecessors, separate the WBS codes with commas.
For each task, input the planned start date in the Start Date column. You may choose to enter dates manually or use Excel’s date picker by selecting the cell and clicking on the calendar icon that appears.
Then, enter the estimated duration of each task in the Duration column. To automatically calculate end dates based on start dates and durations, use Excel’s date functions.
For example, in the End Date column, type =Start_Date_Cell + Duration_Cell – 1 (replace “Start_Date_Cell” and “Duration_Cell” with the corresponding cell references) and press Enter. Copy this formula down the column to apply it to all tasks.

The Calendar view provides several options to tailor the calendar to suit your team’s specific requirements. To begin personalizing it, go to the Calendar view and select “Show” located at the top-right corner of your screen. There, you can easily show or hide start and due dates or custom fields to make the entire work breakdown structure more digestible for your team.
A BETTER VIEW OF IMPORTANT DUE DATES
ClickUp’s Calendar view provides several options to tailor the calendar to suit your team’s specific requirements. To begin personalizing it, go to the Calendar view and select “Show” located at the top-right corner of your screen. There, you can easily show or hide start and due dates or custom fields to make the entire work breakdown structure more digestible for your team.
In this last step, identify the resources required for each task and list them in the Resources column. Resources could include personnel, equipment, or materials needed to complete the task.
You may list resources as simple text descriptions, or if you have a separate resource sheet, reference the corresponding cells. After completing these steps, your Excel WBS is ready.
Remember to save your work regularly and consider using Excel’s built-in data validation, conditional formatting, or other features to improve the organization and presentation of your WBS.
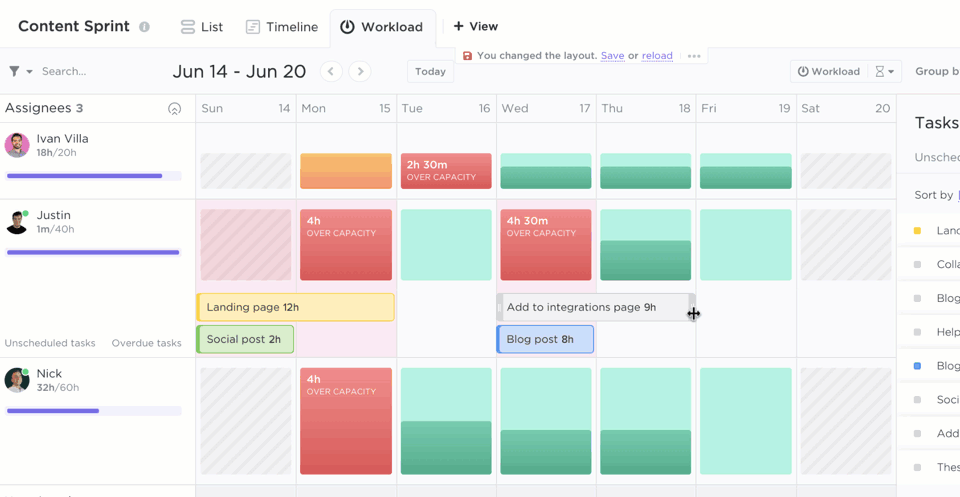
THE CLICKUP WORKLOAD VIEW
See how much work each team member has been assigned for a specific time period. You can choose to view one or two weeks or a full month. By using The ClickUp Workload view, you see if any team members are overloaded or if there is room for more work to be assigned. Each person’s workload is compared to their assigned capacity, so you make more informed decisions about work distribution.
If you hang out around these parts, you know we love templates because they’re resource savers. You don’t have to start from scratch, you get to finish your projects in less time, and they’re reusable.
What’s not to love?
Check out three WBS templates to help you create one in Excel:
A straightforward template with pre-formatted columns and sample data. This Gantt Excel template has a formula for generating WBS numbers according to the chosen Level. In Excel, manually enter the Level number or use a drop-down list created by Data Validation.
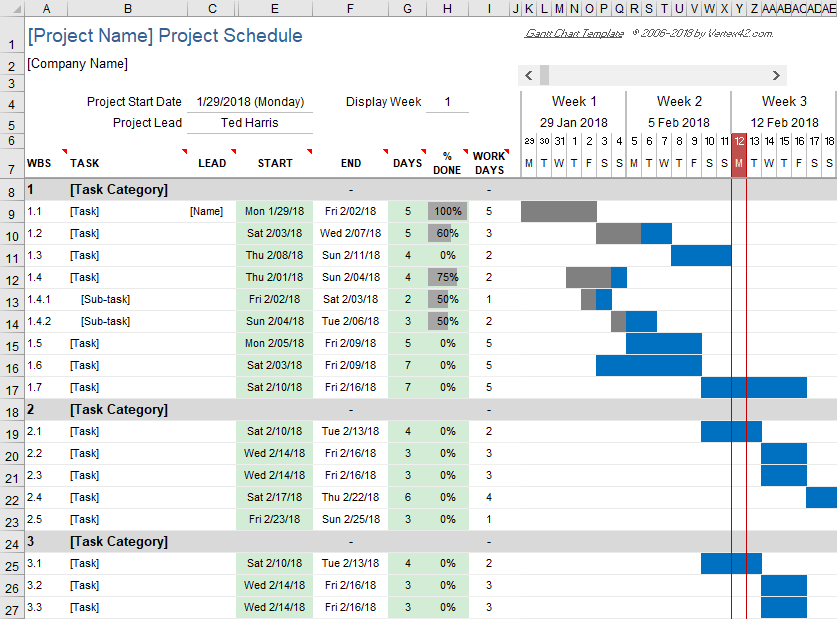
This template is a more advanced option that includes a Gantt chart for visualizing project timelines. With this template, you’re able to create an easy Gantt chart with the core functionality you need. The worksheet is divided into rows representing different tasks. You only need to specify the start date and duration of each task. Easy, right?
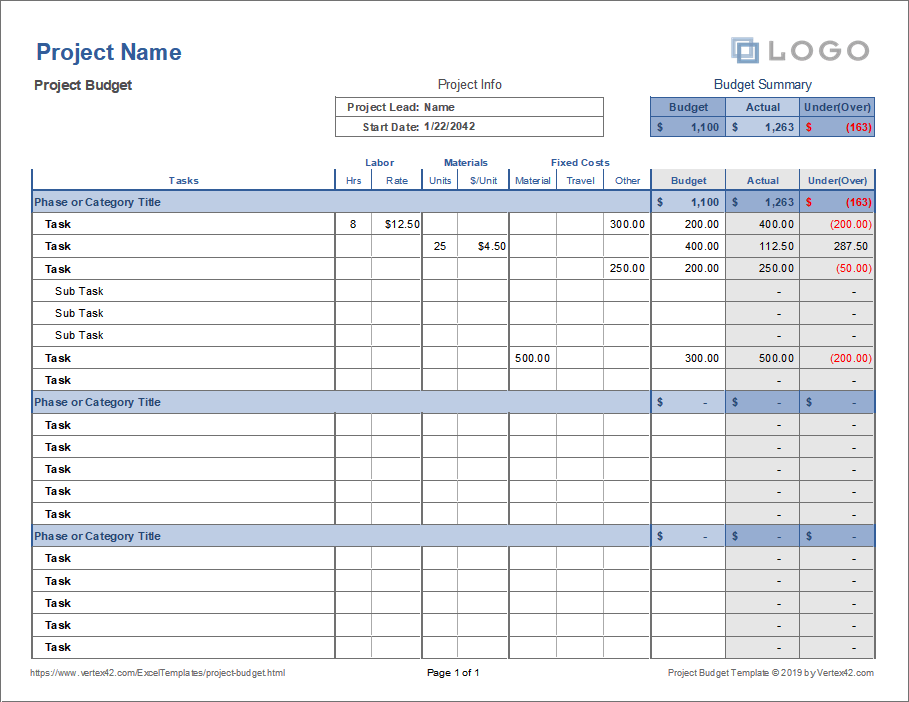
Use this project budgeting template for a variety of projects. For example, you could use it for home remodeling, contract work, small community service projects, and even large IT projects. You probably don’t need to invest in complex or expensive project budgeting software unless you are doing a multi-year, multi-million dollar project.
We love Excel—it’s probably why we have a ton of additional Excel tutorials on the blog. Level up your project management skills with our other Excel tutorials:
With a shared Excel sheet, it’s easier to keep your team on the same page—even when changes happen. On its good days, Excel is also useful as a basic project management tool to create to-do lists, for example.
10 Free Excel Project Management Templates
If you need to create a simple database, Excel helps in that department. Consider using it to create a handy KPI dashboard.
If you are using Excel for temporary imports and exports, try ClickUp. You’ll have free access to useful automations, change logs, and a long list of powerful integrations so it’s easy to connect it with your existing workflow—without the technical headache that comes with it.
How to Create a Database in Excel (With Templates and Examples)
A dashboard is a bunch of centralized data in one easy-to-read place. Excel works for that if what you’re tracking is simple—like progress numbers on a project or a task list.
However, for a more sophisticated dashboard, complete with automated reminders, configurable widgets, and collaborative features, you’re much better off using tools that are more versatile.
How To Create A Dashboard In Excel? (Steps & Templates) 2023
If you’d rather go the manual route, then try out our Excel timesheet template guide. On the other hand, if you’d rather work with a more automated and organized way to keep track of time—especially for multiple projects—you’ll want a more robust tool that’s equipped to handle it all. 💪
How To Create a Timesheet in Excel (Guide with Templates) & How to Calculate Time in Excel
Excel is useful. But that doesn’t mean it doesn’t come without its limitations. Consider the following before only relying on Excel to create WBS charts or a tree structure:
While Excel may be perfect for simple projects, it may not be the best option for more complex projects that require advanced features.
ClickUp’s Mind Maps feature is perfect for creating and managing Work Breakdown Structures. What’s cool about ClickUp is that it lets you easily visualize your project structure with a simple drag-and-drop functionality. Plus, it’s great for team collaboration since you’re able to collaborate in real-time.
But that’s not all—ClickUp also offers other essential project management features like Gantt charts, task dependencies, and progress tracking.
If you’re curious to learn more, check out ClickUp Mind Maps.

Praburam Srinivasan
Max 23min read
Praburam Srinivasan
Max 14min read
Praburam Srinivasan
Max 13min read

© 2026 ClickUp


