
Sorry, there were no results found for “”
Sorry, there were no results found for “”
Sorry, there were no results found for “”
Visualization is considered one of the most effective decision-making techniques.
Studies suggest that visualizing information improves the quality and speed of decisions.
That’s why decision-tree diagrams are considered excellent analytical tools. They visually map all possible options, potential outcomes, and pathways logically, reducing bias and errors.
In this blog post, we’ve compiled the 10 best decision tree diagram templates to help you simplify decision-making, plan projects, and organize ideas. Your search ends here!
Tree diagram templates are visual flowcharts that present information or ideas in a hierarchical structure. They start with a root node, which represents the core idea, question, or problem statement.
From there, it splits into multiple options, events, or categories. Each branch represents a choice, possibility, or outcome. The options are further divided to show all possible paths or results.
Here is a tree diagram example for decision-making:

Each branch shows how different parts are related, so you can analyze how everything fits together.
Here are some common use cases of tree diagram templates:
📌 Brainstorming ideas: Starting with a central topic (the ‘root’), tree diagrams naturally prompt you to think of related ideas that branch out into possible paths
📌 Project planning: They outline tasks, subtasks, and their hierarchical relationships to ensure comprehensive project management
📌 Root cause analysis: The main problem is placed at the root of the tree. Branches represent primary causes, and sub-branches drill down into secondary and tertiary causes, allowing you to identify, organize, and analyze potential causes of a problem
📌 Organizational chart creation: A tree diagram template helps design clear representations of company structures, illustrating roles and reporting lines
Here are a few key features that make a good tree diagram template:
A good tree diagram template lets you adjust nodes, branches, and labels to fit your needs. These templates can be used for anything from simple brainstorming to creating complex entity relationship diagrams.
A clean and straightforward design helps make complex information easier to digest. The structure should direct the reader’s focus naturally, without adding unnecessary distractions. For example, a good layout can turn project maps or workflows in Google Sheets into intuitive, easy-to-follow visuals.
A good template includes features like drag-and-drop tools and editable fields that make creating diagrams effortless. This helps illustrate org charts and team structures easily.
Users can share the template with others, allowing them to edit, comment on, or view the diagram in real time. This feature helps teams exchange ideas and collaborate efficiently, all while maintaining an organized tree diagram structure.
If you want to take it to the next level, you can try ClickUp Whiteboards! See how. 👇🏼
💡Pro Tip: If you’re working on a project map, ensure your diagram includes clear sections for goals, timelines, and responsibilities.
Let’s see the best tree diagram templates for strategic decision-making:
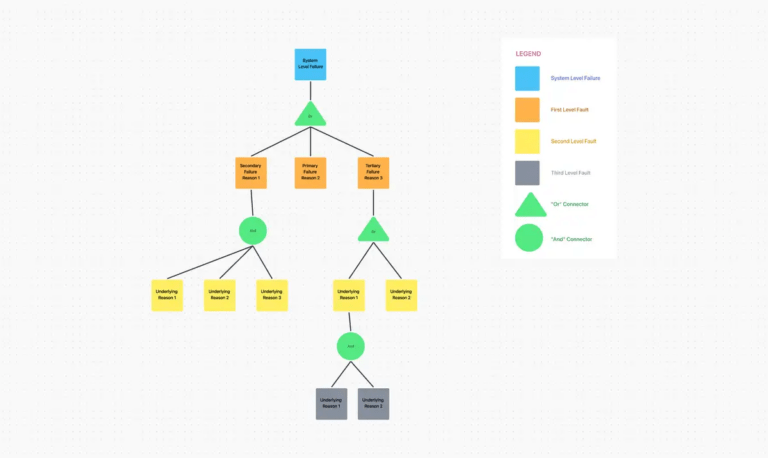
The ClickUp Fault Tree Analysis Template helps you visualize the relationships between causes and effects, making it easier to pinpoint the root cause of any issue in your systems or processes. Fault Tree Analysis (FTA) is a structured approach that lets you break down events into nodes on a tree diagram, so you can analyze how they connect and uncover risks.
🌻 Why you’ll love it:
🌟 Ideal for: Engineers, quality assurance teams, and managers dealing with complex systems who want to identify and address failure points effectively.
👉🏽Read More: Free Fault Tree Analysis Templates
💡 Pro Tip: Make your tree diagrams clear and more relevant by pruning, a technique that involves removing branches that don’t significantly impact the outcome. For example, in a decision tree predicting ‘customer Purchases,’ if a branch shows ‘customers who prefer in-store shopping’ leads to very few sales, you can prune that branch.
Decision-making requires careful consideration of multiple factors and potential consequences. The ClickUp Decision Tree Template simplifies this process by providing a clear, mind map-like flow to help you weigh options, analyze outcomes, and make informed choices.
You can use different shapes and colors to visually distinguish positive outcomes, decisions, and other key elements.
🌻 Why you’ll love it:
🌟 Ideal for: Managers, project planners, and decision-makers who need a systematic way to evaluate options and their potential impact.
📖 Read More: Draw.io Vs Lucidchart: Which is Better?
Understanding complex structures within a family or social group can get overwhelming without a clear structure. The ClickUp Kinship Diagram Whiteboard Template is a simple yet powerful template for mapping connections, relationships and even organizational structure visually.
It helps you arrange family relationships systematically to study family dynamics and track lineage across generations.
🌻 Why you’ll love it:
🌟 Ideal For: Anthropologists, genealogists, and educators who need a reliable way to illustrate kinship systems or document family trees.
The ClickUp Project Mapping Template makes it easy to visualize your entire project workflow diagram. It helps keep track of every detail, from deliverables to timelines. For example, if you’re launching a new product, you can use this template to map key milestones like the product design phase, setting up a marketing campaign, and planning the launch event.
The template helps you connect tasks such as ‘assigning team members to finalize the design,‘ ‘creating social media calendars,‘ and ‘setting up metrics to track success‘ within a single, coherent workflow. This systematic approach to data flow highlights task dependencies and ensures accountability.
🌻 Why you’ll love it:
🌟 Ideal for: Project managers, team leads, and planners who want an efficient way to structure, track, and execute their projects seamlessly.
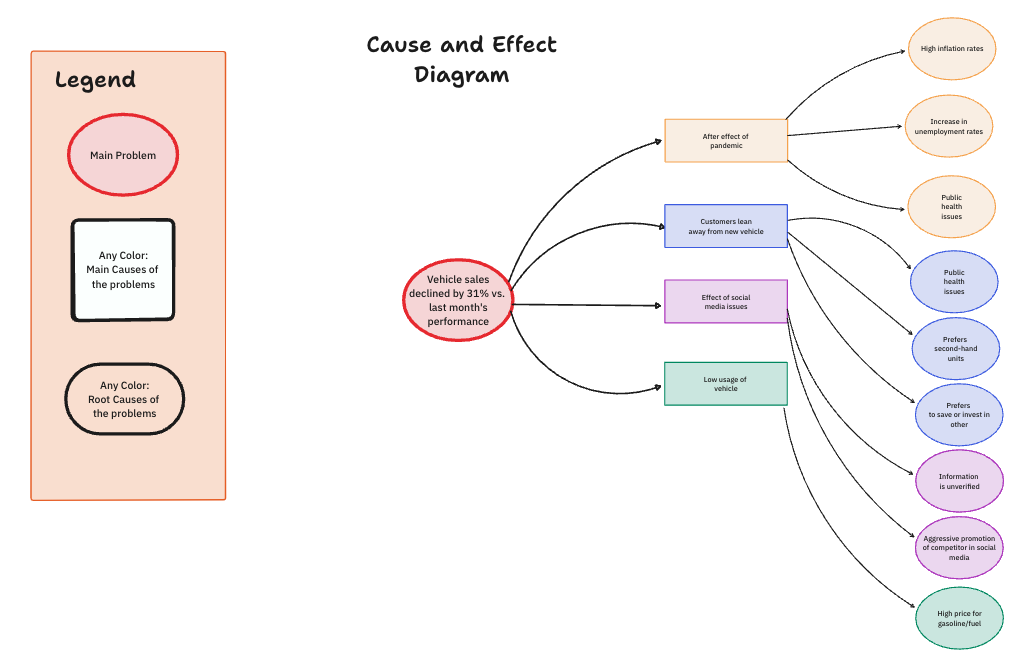
The ClickUp Cause and Effect Diagram Template helps you dissect problems and understand their underlying factors. Commonly known as a fishbone or Ishikawa diagram, this template visually organizes causes and their effects, helping you identify patterns and focus on areas that need attention.
For example, if your team is facing a dip in sales, you can use this template to identify contributing factors like market trends, product quality, or customer behavior.
🌻 Why you’ll love it:
🌟 Ideal for: Quality control teams, business analysts, and project managers looking to tackle problems methodically and prevent them from recurring.

The Project Management Decision Helper Diagram Template by Venngage has a modern, simple design that makes project decision-making easier. It guides you through key questions like ‘whether a project is important,’ ‘how risky it might be,’ ‘what are its benefits,’ and ‘how it fits with your goals?’
With its clear structure and stylish design, this template is ideal for both personal use and team discussions. It helps organize priorities or evaluate projects, enabling you to stay focused and make informed decisions effortlessly.
🌻 Why you’ll love it:
🌟 Ideal for: Project managers, team leads, and professionals looking for a clear and engaging way to evaluate project decisions.
🧠 Did You Know? Many companies, like Zendesk, use decision trees to power their customer service chatbots. A root node might be “Customer Inquiry Type,” branching into specific issues (e.g., billing, technical support) to provide quick, relevant responses to customer queries.

If you’re new to drawing or creating tree diagrams, the Tree Diagram by Creately is a simple and beginner-friendly option. With its straightforward design, this template helps you organize ideas, categorize information, or outline project components without feeling overwhelmed.
For example, you can use it to break down a project into planning and execution phases, then further detail goals, leadership, and risk management.
🌻 Why you’ll love it:
🌟 Ideal for: Students, educators, and professionals who want an easy way to visually organize and present their thoughts or projects.

The Skill Tree Diagram by Creately is a simple template to measure progress and skills. It visually demonstrates how different skills interconnect and contribute to overall growth, making it a versatile tool for learning and planning.
For example, teachers can use the template to outline the skills students need to master specific subjects.
🌻 Why you’ll love it:
🌟 Ideal for: Teachers, career coaches, and team leaders who want a clear way to map and track skills.
📮ClickUp Insight: 37% of workers send follow-up notes or meeting minutes to track action items, but 36% still rely on other, fragmented methods.
Without a unified system for capturing decisions, key insights you need may get buried in chats, emails, or spreadsheets. With ClickUp, you can instantly turn conversations into actionable tasks across all your tasks, chats, and docs—ensuring nothing falls through the cracks.

The Work Decision Tree Diagram by Canva is a visually appealing and practical template for simplifying complex decisions. Designed to guide users through tasks like delegating work, assessing priorities, or solving team-related challenges, this template provides a clear step-by-step flow to reach the best outcomes.
You can embed links, add collaborators, and edit the template seamlessly using Canva’s intuitive tools.
🌻 Why you’ll love it:
🌟 Ideal for: Managers, team leads, or professionals looking for an organized way to make work-related decisions quickly and effectively.

The Family Tree Template by Vertex makes it easy to map out family relationships clearly and creatively. You can add names, birth dates, and photos for a personal touch.
This template offers a simple and organized way to trace your lineage across multiple generations, making it perfect for exploring family history or creating a keepsake for future generations.
🌟 Ideal for: Genealogists, families, or anyone looking to document and visualize their family history.
🎯Also Read: How to Make a Family Tree in Google Docs
These free tree diagram templates are ideal for mapping processes, analyzing options, or creating clear organizational structures, all tailored to your specific needs. Once you’ve created a diagram, identified root causes, or mapped out project flows, what’s the next step?
How do you turn insights into actionable items and assign them to team members?
This is where ClickUp’s tree diagram templates stand out. They help you assign tasks to team members, organize tasks into different statuses, and track task progress in real time. This improves accountability and enables business growth.
Ready to get started? Sign up for ClickUp today and take your productivity to the next level!

Praburam Srinivasan
Max 21min read
Praburam Srinivasan
Max 14min read
Praburam Srinivasan
Max 27min read

© 2026 ClickUp