Sorry, there were no results found for “”
Sorry, there were no results found for “”
Sorry, there were no results found for “”
A Gantt chart is a project manager’s best friend—a sleek project timeline that maps out tasks, deadlines, and progress.
When done well, Gantt charts transform complex project timelines into clear, actionable roadmaps using visualization techniques.
While there are many ways to create Gantt charts, a Google Sheets template might be a favorite tool for many. But Google Slides can help you here, too!
It’s easy to use, accessible, and part of the powerhouse Google Workspace, which boasts over 8 million customers. In this guide, we’ll show you step-by-step instructions on how to create a Gantt chart in Google Slides.
But that’s not all—we’ll explore other tools and tips to make your Gantt charts even more powerful, with features like task assignments and progress tracking. Let’s get started!
🧠Fun Fact: The Harmonogram, created by Polish engineer Karol Adamiecki in 1896, was an early precursor to the Gantt chart. Though similar in purpose, it wasn’t widely known outside Eastern Europe then.
Google Slides offers an intuitive and straightforward way to create and customize visuals, making it accessible—even if you’re not a tech wizard!
Wondering how to create a Gantt chart in Google Slides? It’s easier than you think! Just follow the steps below, and you’ll have your very own Gantt chart in no time:

Start by opening Google Slides and creating a new, blank presentation.
You can adjust the slide layout to fit your needs, but keeping it simple with a blank slide will give you complete control over your design.
From here, you’ll be ready to build your Gantt chart from scratch.
💡 Pro Tip: You can easily search for the right images in your browser with Google Slides. Just click Insert > Image > Search the web, and you won’t need to download or upload anything separately.

Insert a timeline diagram by using a table
You’ll now see a host of options on your right. You can customize these templates by selecting a thumbnail and inserting it into your slide, making it easy to build your own Gantt chart.

Google Slides does not have a built-in Gantt chart, but its timeline templates closely resemble simple Gantt charts.
💡Pro Tip: For presentations with 10+ slides, save time by using a slide master to make universal updates, eliminating the need to edit each slide individually.

Replace the placeholder text with your project tasks or project milestones, using the timeline nodes for task names or key milestones. Add dates or timeframes below each node to define when tasks start and end.
To make it more like a Gantt chart:
🧠 Fun Fact: Gantt charts were famously used during the construction of the Hoover Dam, which began in 1931.
You can easily create a Gantt chart in Google Slides by manually using basic shapes and arrows to represent tasks and their dependencies.
This approach is a bit hands-on but gives complete control to customize everything to fit your project perfectly!

📮ClickUp Insight: 92% of knowledge workers risk losing important decisions scattered across chat, email, and spreadsheets.
Without a unified system for capturing and tracking decisions, critical business insights get lost in the digital noise. With ClickUp’s Task Management capabilities, you never have to worry about this. Create tasks from chat, task comments, docs, and emails with a single click!
Creating a Gantt chart in Google Slides is a quick, straightforward way to visualize project timelines, especially for smaller projects or presentations. However, it’s not really the best Gantt chart alternative and falls short compared to dedicated project management tools due to a few limitations:
➡️ Also Read: Free Google Slides Templates for Impactful Presentations
What if you could create Gantt charts in seconds smartly, with pre-existing project data, in the same place you collaborate with your team?
With ClickUp, you can!
It’s the everything app for work that combines all your work with ClickUp Chat, powering it all with ClickUp Brain that helps you work smarter, not harder.
Here’s what ClickUp user Alexis Correa, Business Intelligence Analyst at CPPA has to say:
Thanks to ClickUp we were able to eliminate a spreadsheet where we updated a Gantt chart every month, but before the Gantt chart we were using other similar app to manage activities and with Clickup we solved this by having several visual options and all in a single web app.

If you’re looking for free Gantt software, ClickUp can do the job. Here’s how ClickUp Gantt Charts hit the mark:
New to ClickUp? Setting up a Gantt chart is super easy. Here’s a video that can make the process smoother
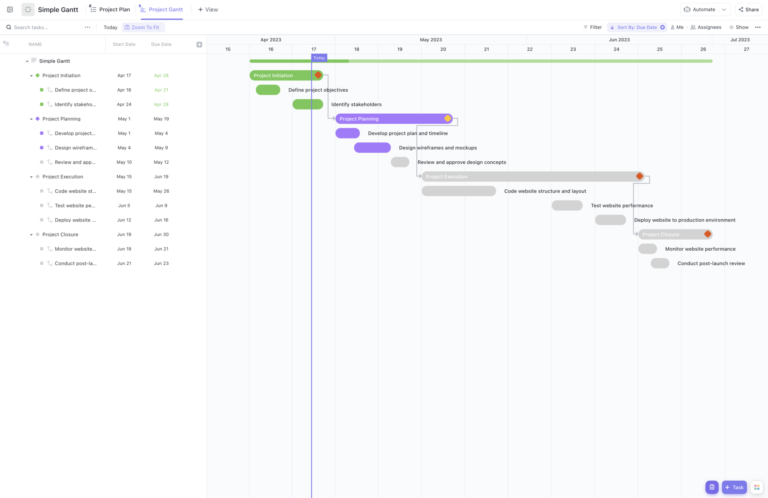
The ClickUp Simple Gantt Chart Template is a great way to visualize all your tasks and deadlines in one place, helping you stay organized and on track with your projects.
Designed for the List Level of your Workspace, this template includes multiple views and features to streamline project planning and execution, such as:
Custom Fields in the template enhance tracking with progress fields automatically tracking subtask completion as a percentage. Dropdown fields also indicate each task’s phase within the project.
Additionally, workspace features like Views, Custom Fields, Docs, and more help create a dynamic and efficient environment.
This template is designed to be user-friendly for both beginners and seasoned Gantt users, so you can get started without feeling overwhelmed by the tool.
Remember how we said ClickUp does Gantt charts and more? Here are some more key features that can make it your team’s mainstay:
➡️ Also Read: Gantt Chart Examples for Project Management
Although they may look intimidating, Gantt charts offer a graphical overview of your project to help you manage tasks, deadlines, and dependencies.
While Google Slides offers basic options like timeline diagrams and DIY Gantt charts using shapes, the process is tedious. The lack of advanced features like task dependencies and real-time updates is glaring.
Enter ClickUp’s Gantt Chart View—designed to streamline workflows, manage tasks effortlessly, and deliver real-time updates as your project evolves. Forget the hassle of Google Slides and embrace dynamic features .
With pre-made Gantt chart templates, you can easily hit the ground running and organize your projects.
Why settle for basic when you can have brilliant? Sign up for ClickUp today!

Sudarshan Somanathan
Max 18min read

Praburam Srinivasan
Max 18min read

Arya Dinesh
Max 11min read

© 2026 ClickUp


