
Sorry, there were no results found for “”
Sorry, there were no results found for “”
Sorry, there were no results found for “”
In 30 days, Meta employees pushed approximately 60 trillion AI tokens through an internal leaderboard that ranked them by consumption.
We’re looking at a bill that plausibly cleared $100 million to produce work that was largely performative. 90 days later, the leaderboard was gone, and the company was rationing AI strictly. That arc is called tokenmaxxing: it’s when maximizing AI token usage gets promoted into a performance score and an indicator of productivity.
Companies have since wisened up, and some have overcorrected in a phenomenon nicknamed “tokenminning”: using the fewest possible AI tokens to reduce computing costs. Both approaches fail because they treat token count as a reliable indicator of AI-led growth.
In this article, we’ll cover what tokenmaxxing actually costs, how engineers gamed it, and the measurement setup that survives people who are good at hitting numbers.
TL;DR: Tokenmaxxing, or when AI token usage is taken as a sign of productivity, fails as a management practice because token consumption is a cost signal. However, it was being treated as a performance metric. The reliable alternative to tokenmaxxing is a pairing rule: every usage signal a team publishes must appear alongside a real outcome that it cannot inflate.
To do this, business and AI leaders must aggregate the data at the team level, keep it out of performance reviews, and use spend anomalies to start investigations. Companies that followed this pattern kept a working signal. Those who ranked individuals lost it within a quarter.
Tokenmaxxing is the practice of maximizing AI token consumption and treating higher usage as evidence of greater productivity or AI adoption. Tokens are the units an AI model processes as input and produces as output.
Token usage became an attractive performance metric because it is visible, quantifiable, and already tracked by many AI platforms. That makes it easier to report than outcomes such as time saved, decisions improved, or revenue generated. But tokens measure computational activity, not useful work. Repetitive prompts, failed agent loops, and pointless output all push the number up while producing nothing.
AI agents make this worse. An agent reads context, calls tools, revises its own work, and hands tasks to other agents. Every step burns tokens. While more activity can mean more useful work, it can also mean inefficient workflows and rising costs.
Put simply, the central flaw of tokenmaxxing is that teams max the visible number while productivity, quality, and return on investment stay the same.
Tokenmaxxing became popular because leadership needed a number to prove AI adoption within companies was happening. And token usage was the only metric showing up in the billing console.
Nvidia CEO Jensen Huang set the tone early in 2026 on the All-In Podcast with a thought experiment about a highly paid engineer’s token bill.
If that $500,000 engineer did not consume at least $250,000 worth of tokens, I am going to be deeply alarmed,” he said. And if the answer came back at $5,000? He’d go ape.
AI usage had become a visible marker of who was keeping up. This was happening at a time when questions about which roles AI would absorb were coming up in every planning meeting. Engineers who spent tokens looked like they were adapting to the new paradigm, while those who didn’t risked looking like a problem.
Here’s the irony: the first token leaderboard was never meant to be a competition. Shopify built one to understand why its top consumers were spending so much, not to rank them against each other. VP and Head of Engineering Farhan Thawar later described how the tool evolved.
The company renamed it a “usage dashboard,” added circuit breakers and spend alerts, and used the data to catch runaway agents and infrastructure bugs. Farhan wrote:
Tokenmaxxing is a spicy topic. More doesn’t mean better.
We built the first AI token leaderboard. Then we evolved our thinking.
It became a usage dashboard. Same data but with different framing. We added circuit breakers & spend spikes. Caught runaway agents. Found bugs in our own infra.
The real signal: not who spent the most but those whose tokens generated the most impact. Those are the engineers I want to talk to.
Most companies that copied Shopify’s leaderboard used it to rank employees instead of investigating AI spend. The table below shows how that played out at each one.
| Company | The mechanism | What happened next |
|---|---|---|
| Shopify | First known token leaderboard, used to investigate high spenders | Renamed a “usage dashboard,” with circuit breakers added to catch runaway agents |
| Meta | “Claudeonomics,” an employee-built leaderboard ranking the top 250 of 85,000+ employees, with titles like “Token Legend” | 60.2 trillion tokens in 30 days; taken down within days of press coverage |
| Amazon | Kirorank, an unofficial leaderboard scoring developers on Kiro AI activity, with PhoneTool badges as prizes | Employees fed agents trivial and fabricated tasks, and the leaderboard was scrapped |
| Uber | No leaderboard; Claude Code rolled out to roughly 5,000 engineers | Annual AI budget gone in four months, followed by a $1,500 monthly per-tool cap |
| Walmart | Code Puppy, an in-house AI agent with initially unlimited tokens | Fixed token allowance per employee after duplicative requests drove up costs |
The pattern across this table is consistent. Organizations that used token data to investigate high spend kept a working signal. Others that used it to rank people lost that signal within a quarter.
Engineers inflated their token usage by generating expensive AI activity that they never planned to ship. The Pragmatic Engineer reported on this behavior at Meta, Microsoft, and Salesforce and found four common tactics. None of them involved bad intent. People simply saw a visible number, worried about layoffs, and assumed that heavy AI use would protect them:
Many engineers checked what their peers were spending. Then they consumed just enough to sit slightly above the average. More than being in the top spot, they didn’t want to be flagged for not using AI enough.
At Amazon, employees assigned trivial and made-up tasks to AI agents to raise their Kirorank scores. This increased cloud costs without producing any business output. When Amazon retired the leaderboard, Senior Vice President Dave Treadwell told staff it had been built with good intentions. He then asked plainly: “Please don’t use AI just for the sake of using AI.”
As part of the change, Amazon now tracks whether AI-generated code works and delivers value. Token consumption isn’t its primary priority.
Tokenmaxxing plausibly cost Meta more than $100 million in a single month and drained Uber’s annual AI budget in four. The Meta estimate comes from simple arithmetic.
At Claude Opus list API pricing (at the time the news story broke), 60.2 trillion tokens would cost roughly $900 million. A company of Meta’s size negotiates steep discounts, but even then, the bill could reach nine figures.
Uber offers the clearest picture of the cost, because it never ran a leaderboard. The company gave roughly 5,000 engineers agentic coding tools without a spend model. Within a month, the share of engineers classified as agentic users climbed from 32% to 84%. The entire annual budget ran out in four months.
The CTO, Praveen Neppalli Naga, admitted that the company was “back to the drawing board” on its assumptions. Monthly bills ranged from $500 to $2,000 per engineer, and the fix was blunt: a $1,500 monthly cap per coding tool, per engineer.
When engineers doing comparable work spend such different amounts, the variation shows that nobody had defined what good usage looked like. So each engineer invented their own definition. Uber COO Andrew Macdonald conceded this point, telling Fortune that it was “very hard to draw a line” between AI-assisted code and useful features actually shipping.
LeadDev’s AI Impact Report found that only 19% of engineering leaders rate tokenmaxxing as effective. 57% of them say it fails to gauge real value.
Here’s why the money moves so fast: an agent planning a code change reads the repository, calls tools, runs tests, and retries until it succeeds. A single loop can consume tens of thousands of tokens, and prompt-cache reads push that count higher still.
The lesson: Finance teams budgeted for AI as if it were a seat license. But it actually behaves like cloud compute. The same accounting gap appears when teams assemble an AI stack across several vendors without giving anyone ownership of the bill. This is the same failure mode as unmanaged tool sprawl, but one layer up.
Tokenminning is the practice of minimizing AI token consumption and treating low usage as the goal. Like we discussed in the intro, it’s an overcorrection and one that has similarly poor outcomes. The name is short for ‘token minimizing,’ and it emerged as the correction to tokenmaxxing. The New York Times reported the shift across several companies.
Meta told employees it would limit AI use after an “exponential increase” in costs. Uber capped monthly spend, Walmart set tool limits, and both Amazon and Meta took their leaderboards down. Within weeks, the same companies that had celebrated their heaviest AI users were teaching everyone to ration.
This correction repeats the mistake it was meant to fix. Goodhart’s law explains it best: when a measure becomes a target, it stops being a good measure. So if you set AI token usage as a goal, people will find ways to optimize for that metric, even at the cost of undermining the original intent. Goodhart’s law cautions against tokenmaxxing and tokenminning.
Reward a team for burning tokens, and it will burn tokens it does not need. Reward a team for saving tokens, and it will skip the AI run that would have caught a bug. Or it will split one thorough session into three cheap ones, each returning a shallower answer. Both teams hit their token usage targets while the actual work gets worse.
Cost control itself is not the mistake. Like in Uber’s example, the $1,500 monthly cap is a budget decision after the company burned a year’s budget in four months. But setting a spending limit only solves a financial problem. It doesn’t answer whether the tokens bought anything useful.
The way out is to separate two kinds of numbers: signals you watch and results you aim for. Token usage, adoption rate, and the share of AI-written code are signals that show what is happening inside the system. They’re useful when you investigate a problem, but they make poor goals. Because each one can change a lot without the customer noticing any difference.
An organization should aim for results instead. They follow the same logic as any well-built set of software development KPIs: connect an early signal to the result it is supposed to predict. Shopify’s dashboard conversion is the template: same data, nobody’s standing on a leaderboard is attached to it.
Neil Dhar, senior vice president at IBM Consulting, described how the confusion spreads in an essay on AI costs.
#Tokenmaxxing has been all over the headlines lately. The organizational push to use as much AI as possible, as fast as possible, turning usage into a proxy for value. Now the bill is coming due. As AI costs outpace returns, the instinct is to cut. But cutting spend alone won’t fix the underlying ROI problem.
As per IBM, the fix is to treat usage as a signal, and pair it with a result it cannot fake.
No, high token usage does not mean high productivity. The largest datasets available show the two moving independently. Research from developer intelligence platform DX found AI adoption near saturation, while measured productivity gains stayed flat.
DX CTO Laura Tacho shared the numbers. Among developers, 92.6% now use an AI coding assistant at least monthly, and roughly 75% use one weekly. AI writes 26.9% of production code. Yet self-reported time savings have remained at roughly 4 hours per week for over a year. And the initial 10% productivity gain never grew.
Usage kept climbing while results stayed flat. Any metric that tracks usage alone has been reporting a win that never happened.
Google Cloud’s DORA report explains why the same tools produce such different results. It found that AI adoption improved delivery speed but hurt delivery stability. The report describes AI as an amplifier: it magnifies the strengths of well-run organizations and the weaknesses of struggling ones.
DX’s own data shows this amplifier at work. In one group of 67,000 developers, some organizations saw customer-facing incidents double while others cut them in half, using the same tools over the same period. Tacho puts the responsibility where the data points:
This is really a management problem. The hype made it sound like just trying AI would automatically pay off. But so far, most tools have been used for individual coding tasks. To see real impact, we need to use AI at the organizational level, not just for single tasks.
There is a second problem underneath the first: people misjudge their own AI speedup. The nonprofit research lab METR ran a randomized controlled trial. 16 experienced open-source developers completed 246 real issues in repositories they had maintained for an average of five years. Before starting, the developers predicted AI would make them 24% faster. After finishing, they estimated it had made them about 20% faster. The stopwatch said they were 19% slower.
In a follow-up update, the lab explained that its next experiment ran into selection effects it could not correct for. It also said developers are now likely genuinely faster with AI, thanks largely to agentic tools. What survives: self-reported productivity is not a substitute for measured productivity, and the gap between them can run in either direction.
Instead of token usage, measure results at the team and then the organizational level. Treat token usage as a cost signal that no one is ranked on. What matters are the outcomes produced.
One practical rule to live by: pair every signal you publish with a result it cannot inflate. A team can burn tokens without shipping anything. However, it cannot fake a falling change failure rate.
| Metric | Type | How to use it |
|---|---|---|
| Tokens consumed per team | Signal | Watch for cost spikes and runaway agent loops; never rank individuals on it |
| AI tool adoption rate | Signal | Confirm the rollout reached people, then stop looking at it |
| Percentage of AI-authored code | Signal | Context for code review capacity planning |
| Change failure rate | Result | Pair it with any claimed speed gain; problems show up here first |
| Pull requests merged per team | Result | Team level only, always balanced with a quality metric |
| Developer experience score | Result | Catches culture damage before people start leaving |
| Percentage of time on new capabilities | Result | Connects engineering effort to business value |
This structure comes from measurement frameworks that engineering leaders already trust. DORA covers delivery speed and stability, and its finding that AI amplifies both is the reason the pairing matters.
The DX Core 4 measures four dimensions: speed, effectiveness, quality, and business impact. Abi Noda and Laura Tacho built it with Nicole Forsgren and Margaret-Anne Storey, the researchers behind DORA, SPACE, and DevEx. The four dimensions pull against each other on purpose.
A team that improves one at the expense of another exposes the trade-off right away. Neither framework includes a token metric, and neither has added one.
Three rules make the pairing hold in practice:
To set an AI usage policy that employees won’t manipulate, remove every visible number from an individual’s standing, and make five decisions:
Every metric in the policy needs a written purpose before the first dashboard ships. Shopify’s leaderboard worked in its first life. Leadership used it to start conversations with high spenders about what they were building. The number opened an investigation. As soon as the same number closes one, concluding something about a person rather than asking something about the work, it turns into a score. And scores get managed.
Write down three things per metric:
The non-action line does the most work, because employees test the policy against it. If the honest answer to ‘what happens when spend jumps’ involves anyone’s standing, you have built a leaderboard with extra steps.
A shared team envelope replaces the per-person cap, and the difference is behavioral, not accounting. Uber’s $500-to-$2,000 monthly spread across engineers doing comparable work shows what happens without a shared reference point. Everyone invents their own definition of reasonable. Budget envelopes work the same way as any other effort to converge scattered AI spend into one accountable place.
The envelope buys you three things a per-person cap cannot:
Size the first envelope from observed data. Take the team’s trailing three-month average and add headroom for one expensive project. An envelope set by guesswork gets breached in week two, teaching everyone the policy is decorative.
Show engineers the cost of each run instead of capping what they can spend. Agentic runs that loop on failing tests are where budgets disappear, pushing a hard cap to the forefront. Another option is surfacing cost per run to the engineer who triggered it, without reporting it upward.
An engineer who watches a retry loop burn $40 will fix the loop. On the other hand, an engineer who fears a report will stop using the agent entirely, including the times the expensive run was the right call.
Shopify’s circuit breakers work this way: the system catches the anomaly, and the person closest to the work decides what to do. Visibility changes behavior faster than a cap does, and it keeps the expensive-but-correct run available when the work justifies the expense.
Put the separation in writing, because verbal reassurance does not survive a layoff cycle. The Microsoft engineer who described inflating their own usage metrics to The Pragmatic Engineer was not chasing a prize. They were avoiding a label in a year of AI-framed layoffs.
If people believe usage data reaches a calibration meeting, they will manage the data, no matter what anyone says out loud.
The policy language needs exactly two lines:
Then honor both. The first engineer who sees usage data surface in a review will tell everyone, proving the metric redundant.
Every quarter, ask whether each diagnostic still explains the outcome it is paired with. Model pricing, caching behavior, and agent architecture all change faster than an annual planning cycle.
How teams apply AI to planning and reporting keeps shifting. A token count that meant one thing in January means something different by June, after two price cuts and an agent upgrade.
The review has honest outcomes per metric: it still predicts the paired result, needs recalibrating against new prices, or has stopped explaining anything and gets retired without ceremony. Teams resist retirement the most. However, it’s an important one because a metric that outlives its meaning is exactly the kind of number the leaderboard era was built on.
The four most common mistakes are treating adoption as the finish line, trusting self-reported time savings, publishing individual leaderboards, and measuring speed without measuring stability. You can spot each one before it gets expensive.
The rollout dashboard reads 90%, leadership declares the AI initiative complete, and no one asks what changed downstream. DX’s data exposed this trap at scale: 92.6% adoption with productivity flat at 10%. Adoption only confirms that the tools reached people. It says nothing about what the tools changed.
The fix: Retire the adoption chart once the rollout ends, and replace it with a signal-and-result pairing.
A survey says the team saves five hours a week, but cycle time has not moved in two quarters. METR’s trial shows why these two numbers disagree: developers who worked measurably slower with AI still estimated a 20% speedup afterward. What people believe and what the clock records are two different measurements.
The fix: Keep the survey for developer experience, where perception matters. Use system data for any claim about time.
Someone builds it on an internal wiki in an afternoon, gives it playful titles, and the team genuinely enjoys it for about three weeks. Then the incentive takes over. Meta’s Claudeonomics and Amazon’s Kirorank both started as grassroots fun. Both companies retired them once the gaming outgrew the enthusiasm.
The fix: Aggregate the data to team level, or don’t ship it.
Throughput rises, everyone celebrates, and incident volume climbs in a different team’s dashboard. The DORA report identified this exact split: speed improves while stability worsens. Keeping the two numbers on separate dashboards keeps the problem invisible.
The fix: Put change failure rate on the same screen as any speed metric, not in a separate reliability review that nobody cross-references.
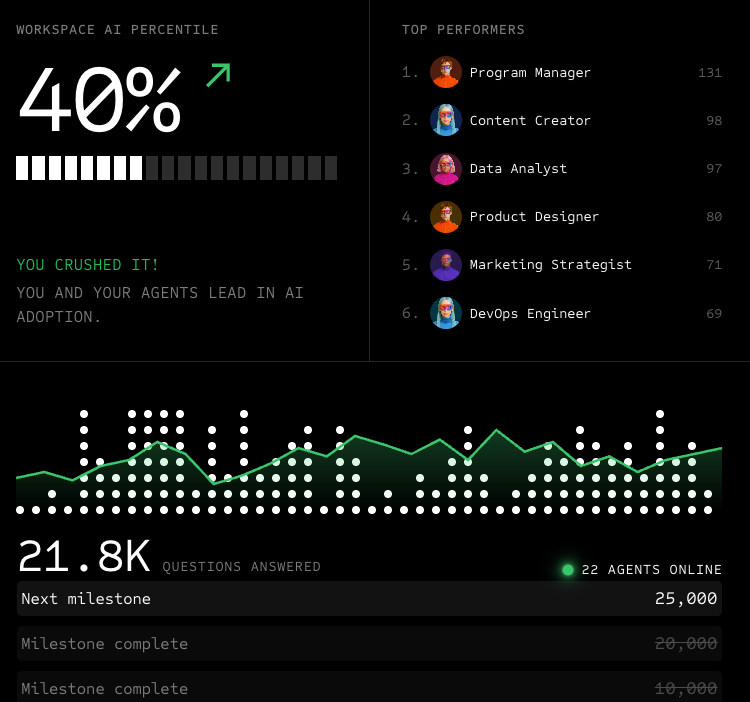
The core problem with tokenmaxxing was never the tokens, but tracking the ROI of those tokens or what they actually produced. The bill went up, but no dashboard connected that bill to work that shipped. That gap exists because most AI tools sit outside the work. You use one system to manage projects and another to run AI, then try to reconcile the two after the fact.
ClickUp Brain eliminates that gap by design. It’s not a standalone AI bolted onto a project tool. Brain lives inside Tasks, Docs, Chat, and connected apps, the same surfaces your team already uses to track deadlines, assignments, and status. When Brain triages a bug report, summarizes a sprint, or drafts a project update, it’s reading and writing to the same objects your team measures progress against. There’s nothing to reconcile because the AI and the work never separated.
Super Agents take that a step further. A Super Agent can monitor a Chat channel for incoming bug reports, create and prioritize tasks automatically, research fixes across your Workspace and the web, and post a solution in the task comments, all without a human babysitting token counts. Brain also hosts several top LLMs, including Claude, ChatGPT, and Gemini, under a single subscription. Pick the model per your needs and switch mid-conversation. Your Workspace context carries across all of them.
Here’s the measurement layer that makes this relevant to tokenmaxxing. Standard Brain usage, asking questions, writing, summaries, research, is and consumes zero credits (for paid plans with a Brain AI or Everything AI add-on). Agents consume AI Super Credits, typically 100 to 300 per run depending on how many actions the Agent performs.
That distinction is deliberate. Credits accumulate only when the Agent takes a concrete action that produces a trackable output: a task created, a Doc updated, a comment posted. Not when someone asks a question.
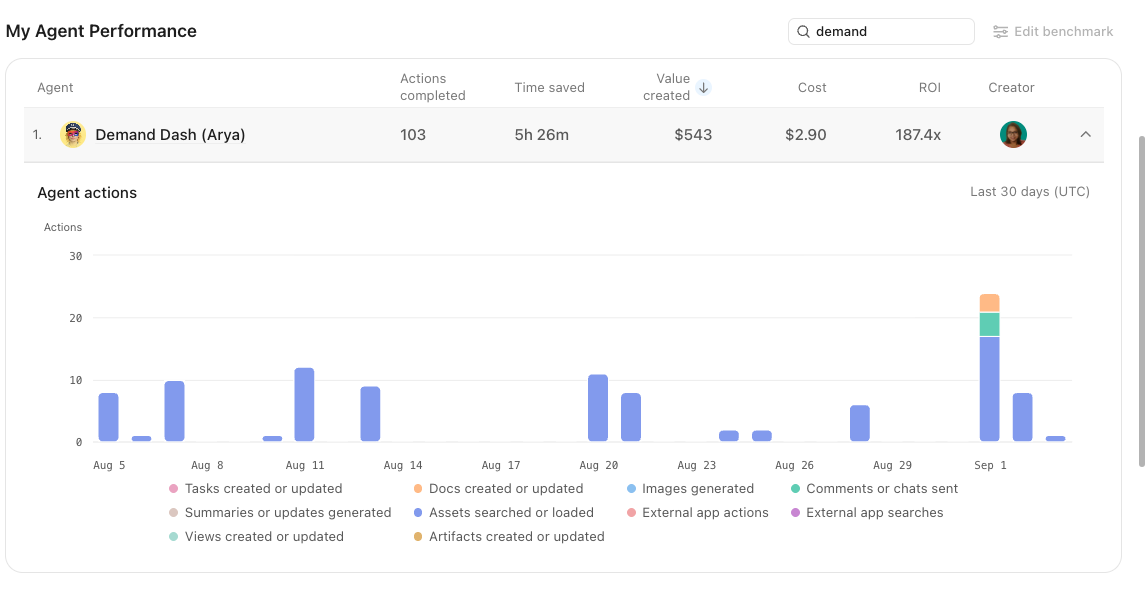
The AI Hub puts both sides of the equation in one view, like this:
| Metric | What it shows | Why it matters for tokenmaxxing |
| Time Saved | Every AI action multiplied by a time benchmark you set | Converts raw usage into a unit your team actually recognizes |
| Human Cost Savings | Time Saved multiplied by an hourly rate | Puts a dollar figure on the outcome, not the input |
| Actions Completed | Tasks created, Docs updated, comments posted, images generated | The concrete output behind each credit spent |
| Agent Cost | What each Manage and edit Super Agent profiles runs cost in AI Super Credits | The diagnostic: how much the AI consumed |
| Agent ROI | Value created divided by cost, shown as a multiplier | The pairing rule this article has been building toward: diagnostic next to the outcome it can’t fake, in one column |
This is what Uber didn’t have. When per-engineer spending ranged from $500 to $2,000 a month and nobody could draw the line between AI-assisted code and features actually shipping, the missing piece was a system where AI usage and work output were already the same data. ClickUp solves that problem by never letting the two separate in the first place.
The honest limitation: ClickUp tracks AI activity across its own platform. If your AI spend also runs through external coding assistants, API calls, or standalone tools, you still need provider consoles or a dedicated tool like DX or Jellyfish for that portion. ClickUp fits the outcome half of the pairing, and it fits best when the work being measured already lives in the Workspace.
If your team is rolling out agents, this shows how to build one with a defined job:
The whole story comes down to one rule: use token data to ask questions, never to grade people. Shopify asked ‘What are our top spenders building?’ and found runaway agents and infrastructure bugs. Meta and Amazon asked ‘Who’s using AI the most?’ and got fake tasks, wasted millions, and dead leaderboards.
So do three things this quarter. Move token tracking to the team level and delete anything that shows an individual’s name. Write down, in the policy, that usage data never touches a performance review. And put one quality metric (change failure rate is the easiest) on the same screen as every speed metric you report.
If you want that screen living next to the actual work instead of in a separate reporting tool, get started with ClickUp for free and build the dashboard before you need it.
There is no official ‘30% rule’ specific to tokenmaxxing. The phrase is usually shorthand for two separate findings people conflate: that AI tends to lift measured engineering productivity by roughly 10%, not 30%, and that developers routinely predict gains around 20–30% that don’t materialize. Treat any fixed percentage as a diagnostic to investigate, never a target to hit.
One million tokens is roughly 750,000 words of English text, since a token averages about three-quarters of a word. Cost depends entirely on the model and the input/output split. At 2026 frontier-model rates, it ranges from a few dollars to low tens of dollars per million. Agentic sessions consume millions of tokens fast because each loop re-reads context, and prompt-cache reads add to the count.
“Tokenmaxxing” combines “token” with the internet suffix “-maxxing,” meaning to maximize a trait. It spread through engineering circles in early 2026 after internal token leaderboards at Meta and Amazon leaked to the press. Business Insider called it “the new Silicon Valley AI debate” in April 2026. Public leaderboards like Viberank and tokenmaxxing.sh then adopted the label, ranking individual developers worldwide by API spend.
Largely, yes. Fortune declared tokenmaxxing over in May 2026 after Meta, Amazon, Microsoft, and Uber walked back or killed their token leaderboards. LeadDev’s AI Impact Report found only 19% of respondents rate tokenmaxxing as effective at measuring AI value, and 57% say it fails outright. Hobbyist public leaderboards persist, but as a game, not a management practice.
There is no established benchmark. Uber’s rollout saw monthly bills range from $500 to $2,000 per engineer before the company capped spend at $1,500 per tool. Nvidia CEO Jensen Huang has argued a $500,000 engineer should consume $250,000 in tokens annually, but that is most likely a provocation, not a standard. Findings show wide variance across comparable work, which means no one has defined what good usage looks like.
Vibe coding is a way of working: delegating implementation to an AI agent and steering by outcome. Tokenmaxxing is a way of measuring: treating the tokens you consume as evidence of productivity. You can vibe code efficiently or wastefully; tokenmaxxing rewards the wasteful version because it only counts consumption. Companies that capped tokens to stop tokenmaxxing often penalized legitimate agentic work in the process.

Praburam Srinivasan
Max 10min read

Manasi Nair
Max 22min read
Manasi Nair
Max 24min read

© 2026 ClickUp