BCG Growth Share Matrix Blog Feature

A Complete Guide to the BCG Growth Share Matrix: Optimizing Portfolio Management

Often considered a revolutionary strategic management tool, the BCG Growth Share Matrix was first introduced in 1970 by the Boston Consulting Group, spearheaded by the group’s founder, Bruce Henderson, with significant contributions from Alan Zakon and his team.

BCG Growth Share Matrix is a strategic tool that can guide you in making crucial product investment and resource allocation decisions. By assessing your products and classifying them based on their market’s growth rate and relative market share, you can effectively identify areas to invest in, divest from, or maintain.

In this article, we’ll break down the framework’s key components, go through some practical application examples, and show you how to create your own BCG Growth Share Matrix using ClickUp, the leading project management platform.  

Summarize this article with AI ClickUp Brain not only saves you precious time by instantly summarizing articles, it also leverages AI to connect your tasks, docs, people, and more, streamlining your workflow like never before.
ClickUp Brain
Avatar of person using AI Summarize this article for me please

What Is the BCG Growth Share Matrix?

Struggling with inefficient resource allocation leads to missed growth opportunities and underperforming businesses. Eventually, you might face:

  • Uneven investment 💰
  • Limited growth  📉
  • Risk of obsolescence ⏳
  • Competitive disadvantage 🥇

The BCG Growth Share Matrix is a long-term strategic planning tool that aims to solve all of the issues mentioned above. It guides investment decisions based on a product’s market growth rate and relative market share. 

The matrix shows two essential aspects companies should consider when deciding where to invest their money: how competitive they are and how attractive the market is. These estimations are based on their current share of the market and how fast that market is growing: 

  • If a company has a big share of the market that’s not growing much, it will generate profits even with minimal investment
  • If a company holds a big portion of a fast-growing market, it needs to invest a lot in it to maintain its dominant position
  • If the market is growing fast but the company does not have a significant presence in it, it needs to decide whether to invest more or give up on it
  • If the market isn’t growing much and the company doesn’t have a significant share of it, it should think about divesting from it or changing its strategy
Summarize this article with AI ClickUp Brain not only saves you precious time by instantly summarizing articles, it also leverages AI to connect your tasks, docs, people, and more, streamlining your workflow like never before.
ClickUp Brain
Avatar of person using AI Summarize this article for me please

Components of the Growth Share Matrix

The BCG Growth Share Matrix places a company’s products into four categories or quadrants based on the competitiveness and growth rates of their respective markets:

  1. Stars 🌟
  2. Cash Cows  🐄
  3. Dogs  🐶
  4. Question Marks ❓

Plotting a particular product on the matrix should not be arbitrary; it should result from careful analysis using measures such as: 

  • Initial categorization: Analytics help accurately place products within the matrix, ensuring alignment with the product strategy
  • Dynamic monitoring: Continuous analytics tracking allows for real time adjustments to changing market conditions
  • Future trend prediction: Analytics enable businesses to anticipate future market shifts, allowing proactive planning
  • Decision validation: Analytics validate strategic decisions by comparing predicted outcomes with actual results, fostering continuous improvement
BCG Growth Share Matrix
Source: BCG

Each of the four categories of the BCG Growth Share Matrix has its unique characteristics and requires different strategies to perform well and generate profits. Let’s take a closer look at each to help you optimize your investment approaches.

Stars

Stars depict your business’s high-growth, high-market-share products, often poised for success and representing a significant source of revenue. As the name suggests, these are the shining stars of your product portfolio that have the potential to dominate the market.

To make the most of your Stars, here’s what you should do:

  • Give them plenty of resources to keep growing fast
  • Keep coming up with new ideas to stay ahead of competitors
  • Finance promotions to maintain their market share
  • Think about how you can turn them into Cash Cows in the future
  • Keep checking how well your Stars are doing to make sure they keep growing

Cash Cows

Cash Cows in the BCG Matrix are your company’s dependable, hardworking assets. They have a significant share in slow-growing markets and usually bring in a steady flow of income. They’re stable, mature, and don’t need much investment.

To make the most of them, focus on keeping their market share and making as much profit as possible.

You can use the money they make to invest in other parts of your business. You might want to try new ways to make your operations more efficient or find other ways to bring in money. But remember, you shouldn’t get too comfortable. The market can change, and an unattended Cash Cow can quickly become a Star in the best-case or a Dog in the worst-case scenario. 

Dogs

Dogs represent products with a low market share in industries where growth is slow, and they don’t bring in much money compared to the resources they consume. But with some smart planning, you can turn the situation around. Here’s how:

  • Sell off these underperforming parts of your business to save resources
  • If possible, try to dominate a smaller part of the market where there’s less competition
  • Find ways to make your operations more efficient and spend less money to make more profit
  • Use these products to block competitors or keep relationships with important clients
  • Try to make these products more appealing to new markets or different types of customers by coming up with new ideas or changing how you advertise and sell them

Question Marks

Question Marks are products that operate in high-growth industries but hold a low market share. This makes them potential winners but also risky investments. They’re the wild cards in your portfolio.

To leverage their potential, you’ll need to invest heavily and strategically. If a Question Mark can gain more market share, it could become a Star and eventually a Cash Cow. However, if it fails to gain a foothold in the market, it might become a Dog.

You’ll need to evaluate their potential carefully, considering market trends, competition, and your company’s available resources.

Summarize this article with AI ClickUp Brain not only saves you precious time by instantly summarizing articles, it also leverages AI to connect your tasks, docs, people, and more, streamlining your workflow like never before.
ClickUp Brain
Avatar of person using AI Summarize this article for me please

How to Create a BCG Growth Share Matrix

Creating a BCG Growth Share Matrix requires carefully looking at your products and figuring out how they’re doing in the market. Here’s how to start:

  1. List your products: Start by making a comprehensive list of your entire product portfolio. Ensure you include every product, even those that may seem less significant at first glance
  2. Check market growth: Once you have your list, assess the growth rates of the markets in which each product operates. This involves understanding how quickly the demand for each product’s category is growing. Look at industry reports, market research, and historical data to gauge the growth trajectory accurately
  3. Determine market share: Determine the market share of each product relative to its competitors. This involves analyzing sales data, financial KPIs, sales KPIs, market surveys, and industry insights to understand how well each product is performing in its respective market. Calculate the percentage of total market sales that each product captures
  4. Put them on the graph: Using the growth rate and market share data you’ve gathered, plot each product onto the BCG matrix. This involves creating a graph with two axes: one representing market growth rate and the other representing relative market share. Place each product on the graph based on its growth rate and market share, categorizing them as Stars, Cash Cows, Question Marks, or Dogs accordingly
  5. Plan your next steps: Once all your products are plotted on the matrix, analyze the results to determine your next steps. For Stars, consider investing resources to maintain their growth. For Cash Cows, focus on maximizing profitability. For Question Marks, decide whether to invest further or divest. For Dogs, consider discontinuing or repositioning them. Develop a strategic plan for each product category to optimize your portfolio’s performance and drive growth

This is a solid plan, but luckily, there’s a tool that can make this process simple, quick, and effortless—ClickUp.

BCG Matrix template

The ClickUp BCG Matrix Whiteboard Template helps medium to large companies manage their product lines more effectively. It’s a ready-made framework for classifying products based on factors like popularity, quality, and functionality.

ClickUp BCG Matrix Whiteboard Template
The BCG Matrix whiteboard template provides a quick and easy way to visualize and analyze a company’s product portfolio

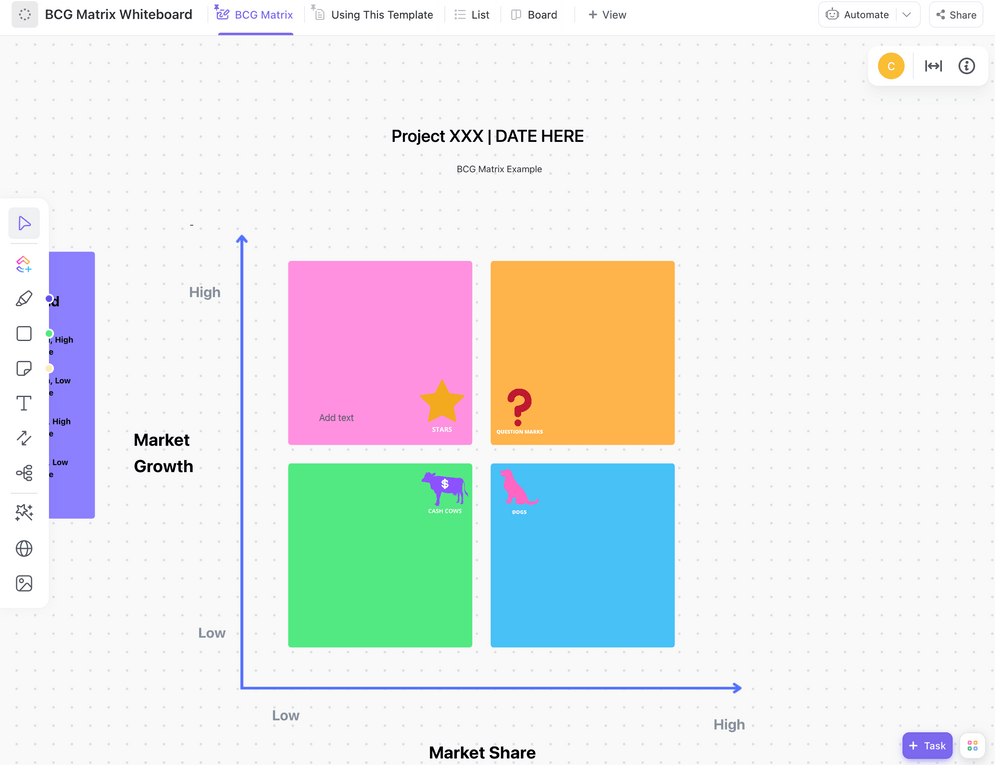
This template is particularly useful for project and product managers because it’s easy to use and helps visualize and simplify complex information. It uses two key product management metricsgrowth and market share—to categorize products into four quadrants:

  • Cash Cows: Products with high market share but low growth
  • Dogs: Low-share, low-profit products that should be discontinued
  • Stars: High-performing products that need constant investment to stay ahead
  • Question Marks: Products needing careful analysis, as they could become successful or fail

Below is a quick, step-by-step guide for effectively utilizing the BCG Matrix Whiteboard Template in ClickUp:

  1. Gather data: Before you start, gather all relevant information about your products. This includes market share, growth potential, competitive positioning, and profitability. ClickUp’s Dashboards feature can help you collect and organize this data in one place, providing a holistic overview of your product portfolio
  2. Customize the Whiteboard: The template comes with a default ClickUp Whiteboard. It is an infinite digital canvas for positioning your products and visualizing your competitive landscape. You can add shapes, images, text, or links to the Whiteboard to track and organize each key data point effectively
  3. Plot your business: Use the data you’ve gathered to determine which quadrant each product belongs to based on its market share and growth potential. ClickUp’s Board view can help you organize and compare different data points effectively within the matrix
  4. Monitor and adjust: Keep an eye on your BCG Matrix regularly to ensure everything’s up to date. Use ClickUp’s recurring tasks feature to remind you to check and update the matrix regularly
ClickUp Whiteboard
Turn your team’s ideas into coordinated actions all in one place using ClickUp Whiteboard

AI Prompts for BCG Matrix Analysis

With ClickUp Brain, the platform’s neural network, you can tailor your strategies to suit your specific objectives using AI-driven insights. Whether you’re looking to spot growth prospects, refine your product lineup, or manage risks, ClickUp Brain offers the support and resources necessary for navigating the challenges of portfolio analysis and business strategy with confidence.

ClickUp 3.0 AI view general
Spark creativity, create templates, or generate copy at lightning speed with the world’s best brainstorming partner

With automated data analysis, you’ll save valuable time and resources while gaining a deeper understanding of your portfolio’s performance. Plus, AI-powered visualizations offer a clear and concise overview, making it easier than ever to track progress and drive innovation.

Try these AI prompts for BCG Matrix analysis:

  1. Evaluate your product portfolio: Identify Stars, Question Marks, Cash Cows, and Dogs and get recommendations for resource allocation and growth strategies
  2. Analyze business units: Assess market attractiveness and competitive position to identify growth opportunities and potential threats
  3. Evaluate product lines: Determine which product lines need investment, divestment, or further development to maximize profitability and market share
Summarize this article with AI ClickUp Brain not only saves you precious time by instantly summarizing articles, it also leverages AI to connect your tasks, docs, people, and more, streamlining your workflow like never before.
ClickUp Brain
Avatar of person using AI Summarize this article for me please

Practical Application and Examples of the BCG Growth Share Matrix

Imagine you’re a product portfolio manager at a big tech company like Apple Inc., in charge of many different products at different lifecycle stages. How do you decide what to focus on and how to design your product marketing strategies? That’s where the BCG Growth Share Matrix comes in:

  • The Cash Cow would be the iPhone. It’s been around for a while, and while the cell phone market is not growing as fast as it used to, the product still accounts for a significant portion of Apple’s revenue without needing much investment
  • The Star could be the AirPods. They’ve quickly become a popular product with high demand and significant growth potential
  • The Question Mark might be the Apple Watch. It’s growing in popularity, but it still hasn’t reached the same level of market share as the iPhone or AirPods
  • A Dog could be something like the iPod Classic. While it was once a flagship product for Apple, it’s now outdated (and discontinued) and has low demand compared to their other offerings

In the table below, you can see a few more examples besides Apple:

Company/ProductRelative Market ShareMarket Growth RateQuadrantStrategy
Google SearchHighLowCash CowMaintain market share, generate cash
Google PixelLowHighQuestion MarkInvest and grow, the potential to become a star
Netflix StreamingHighHighStarInvest heavily for continued growth
Netflix DVD RentalLowLowDogConsider discontinuing
Summarize this article with AI ClickUp Brain not only saves you precious time by instantly summarizing articles, it also leverages AI to connect your tasks, docs, people, and more, streamlining your workflow like never before.
ClickUp Brain
Avatar of person using AI Summarize this article for me please

Limitations of the BCG Growth Share Matrix

While the BCG Growth Share Matrix is a valuable framework for effective resource allocation and decision making, it’s important to consider its shortcomings to fully understand its strategic implications. Like any analytical tool, the matrix has limitations that you must be aware of to make the most effective strategic decisions. Here are the most notable ones:

  1. Simplifies reality: The matrix assumes market growth rate is the only indicator of market attractiveness and considers relative market share as the only measure of competitive advantage
  2. It’s static: The matrix doesn’t account for changes in the business environment or market trends. It’s a snapshot, not a predictor of future potential
  3. Overlooks synergies: The matrix treats each business unit or product independently, not considering potential synergies between different units or products
  4. Two-dimensional: The matrix may neglect other important factors like profitability, market size, or brand strength
  5. Assumes that a higher market share leads to higher profits, which isn’t always the case
Summarize this article with AI ClickUp Brain not only saves you precious time by instantly summarizing articles, it also leverages AI to connect your tasks, docs, people, and more, streamlining your workflow like never before.
ClickUp Brain
Avatar of person using AI Summarize this article for me please

Improve Product Portfolio Management with ClickUp

While the BCG Growth Share Matrix has shortcomings, it remains an invaluable tool for entrepreneurs and businesses navigating the complexities of managing product portfolios. Its simple product categorization into Stars, Cash Cows, Question Marks, and Dogs provides a simple and practical framework for strategic planning and resource allocation.

Applying the BCG Growth Matrix becomes easier than ever with ClickUp. Whether you’re a fledgling startup or an established enterprise, you can use ClickUp’s ready-made matrix templates and collaborative Whiteboards to make smart investment decisions and set your business on the path to sustainable growth. Sign up for ClickUp today and build your own BCG Growth Matrix in minutes!

Questions? Comments? Visit our Help Center for support.

Sign up for FREE and start using ClickUp in seconds!
Please enter valid email address