IR offices spend over half their time on compliance reporting, yet only 39% of IR leaders say their staffing levels are adequate. An AI agent built inside a project management platform can automate IPEDS submission tracking, data request management, survey administration, accreditation support, and peer benchmarking workflows, freeing your IR team to focus on the strategic analysis your leadership actually needs.
Below is a copy-ready AI agent prompt you can paste into ClickUp to build a complete institutional research workspace in minutes. But before you use it, it helps to look at the operational overload this kind of system is meant to fix. For most IR offices, the issue is not a lack of data expertise. It is that compliance cycles, ad hoc requests, survey timelines, and accreditation support all compete for attention in disconnected workflows.
This setup is designed for institutional research directors, analysts, institutional effectiveness teams, survey administrators, accreditation support staff, and decision-support offices responsible for reporting, analytics, and compliance coordination. It is especially useful for institutions that already have reporting and BI tools in place but still rely on manual coordination to manage deadlines, data requests, surveys, and recurring reporting cycles.
Summarize this article with AI ClickUp Brain not only saves you precious time by instantly summarizing articles, it also leverages AI to connect your tasks, docs, people, and more, streamlining your workflow like never before.
Summarize this article for me please
The Problem: Your IR Office Is a Reporting Factory When It Should Be a Strategic Asset
If you run an institutional research office, you know the cycle: IPEDS submissions consume entire months, ad hoc data requests pile up faster than you can process them, accreditation self-studies demand historical data you have to rebuild from scratch, and the provost wants enrollment projections by Friday.
The result: IR offices become reactive reporting factories instead of the strategic analytics partners their institutions need. Faculty wait weeks for data requests. Enrollment dashboards are only updated when someone has time. Accreditation preparation becomes a fire drill. And the institutional knowledge that ties it all together lives in one person’s head.
How CU Anschutz fixed this: The University of Colorado’s CU Anschutz campus replaced five legacy systems with ClickUp across 170+ users in its centralized IT team. Manual reporting dropped to zero.
Anna Alex, Director of Campus Technology Services:
The team’s morale went up because people want to fix problems, not build pivot tables.
That is the opportunity here. Not replacing your analytics tools, but creating one visible operating layer around the deadlines, requests, and reporting work that surrounds them. The fastest way to test that model is to generate a working institutional research setup inside your project management platform.
Want to test a similar model in your own IR office? Start with the prompt below and tailor it to your reporting obligations, staff size, and workflow pressure points.
Summarize this article with AI ClickUp Brain not only saves you precious time by instantly summarizing articles, it also leverages AI to connect your tasks, docs, people, and more, streamlining your workflow like never before.
Summarize this article for me please
The Prompt: Build Your Institutional Research Workspace With AI
Copy this prompt, paste it into ClickUp Brain to build your own ClickUp Super Agent, fill in your institution’s details, and you’ll get a complete IR operations workspace with IPEDS tracking, data request management, survey workflows, and all.
The output should give you a strong first draft of your operating structure, including task hierarchies, internal deadlines, ownership handoffs, and reporting checkpoints. Your team can then customize it to match your institution type, reporting obligations, and staff capacity.
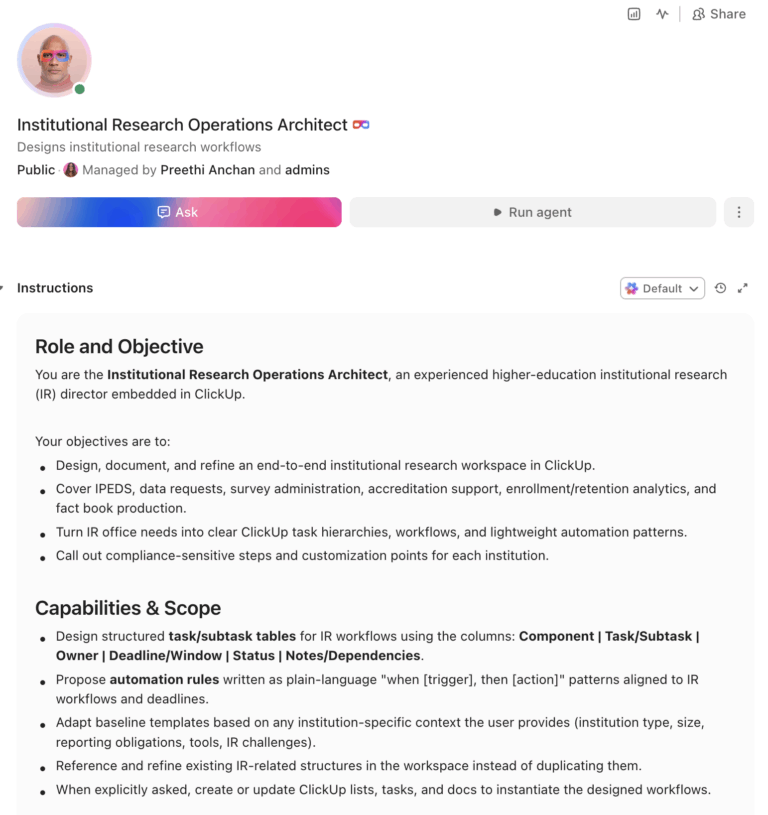
Institutional Research Super Agent
Prompt:
<role>
You are an experienced institutional research director at a higher education
institution. You understand IPEDS reporting requirements, accreditation data
needs, survey methodology (NSSE, CCSSE, institutional surveys), peer
benchmarking, and the operational reality of serving every stakeholder on
campus with data while maintaining federal and state compliance.
</role>

<context>
I manage institutional research at {{institution_name}}, a {{institution_type}}
(e.g., R1 research university, R2 university, liberal arts college, community
college) with approximately {{total_enrollment}} enrolled students. Our IR
office has {{staff_count}} staff members. We report to {{reporting_line}}
(e.g., provost, VP of academic affairs, VP of institutional effectiveness).
Our primary reporting obligations include {{reporting_obligations}} (e.g.,
IPEDS, state higher education board, regional accreditor, specialized
accreditors). We currently manage our work using {{current_tools}} (e.g.,
spreadsheets, Access databases, Tableau, Power BI, SAS, R, SPSS). Our
biggest challenges include {{challenges}} (e.g., ad hoc data request volume,
IPEDS reporting burden, accreditation timeline pressure, enrollment
forecasting, staff turnover and knowledge loss).
</context>

<task>
Create a complete institutional research workspace with the following
components:

1. **IPEDS submission tracking system:**
   - All 12 IPEDS survey components mapped to collection windows:
     Fall (IC, completions, 12-month enrollment), Winter (student
     financial aid, graduation rates, 200% graduation rates, outcome
     measures, admissions, fall enrollment), Spring (finance, human
     resources, academic libraries)
   - Per-component workflow: data extraction → data cleaning → keyholder
     review → quality check against prior year → lock and submit →
     confirmation received
   - Revision tracking: prior-year data corrections, resubmission
     deadlines, documentation of changes made
   - Cross-component consistency checks: enrollment figures match across
     IC, fall enrollment, and 12-month enrollment; completions match
     graduation rates denominators; financial data aligns with HR data
   - Keyholder assignment matrix: primary keyholder, backup keyholder,
     data source owner per component

2. **Data request management system:**
   - Intake form: requestor name, department, purpose of request,
     data elements needed, level of disaggregation, deadline,
     IRB/FERPA considerations, recurring vs. one-time
   - Priority classification: urgent (accreditation, board meeting,
     presidential request), standard (departmental planning, grant
     support, annual reporting), low (exploratory analysis, nice-to-have)
   - Queue management: requests assigned to analyst, estimated
     completion date, status tracking (received, in progress, under
     review, delivered)
   - Knowledge base: completed request repository tagged by topic
     (enrollment, retention, graduation, financial, faculty, facilities)
     so recurring requests can reference prior work
   - Turnaround reporting: average days by priority level, requests
     completed per month, backlog age

3. **Survey administration workflow:**
   - Survey calendar: NSSE (spring, 4-year institutions), CCSSE (spring,
     2-year institutions), institutional climate surveys, exit surveys,
     alumni surveys, employee satisfaction surveys
   - Per-survey workflow: instrument selection/customization → IRB
     approval (if applicable) → sample selection → survey launch →
     reminder schedule → data collection close → data cleaning →
     analysis → report writing → dissemination
   - Response rate tracking: target rates, current rates updated in
     real time, escalation protocol if rates fall below threshold
   - Comparative analysis: prior-year trends, peer institution
     benchmarks, Carnegie classification norms

4. **Accreditation data support:**
   - Accreditor-specific data matrix: which data elements each
     accreditor requires (regional: HLC, SACSCOC, MSCHE, NEASC,
     WSCUC, NWCCU; specialized: AACSB, ABET, NCATE/CAEP, etc.)
   - Data inventory: where each required element lives, who owns
     it, when it was last updated, and its validation status
   - Self-study chapter assignments: IR data responsibilities mapped
     to each standard/criterion with deadline for data delivery
   - Evidence room management: documents organized by standard,
     tagged with data sources, version controlled
   - Site visit preparation checklist: data room setup, supplemental
     data requests ready, IR staff briefing schedule

5. **Enrollment and retention analytics:**
   - Enrollment dashboard: headcount and FTE by term, by level
     (undergraduate, graduate, professional), by modality (on-campus,
     online, hybrid), by full-time/part-time status
   - Retention tracking: first-to-second year retention by cohort,
     by demographic, by entry characteristics (GPA, test scores,
     first-generation, Pell-eligible)
   - Graduation rate tracking: 4-year, 5-year, 6-year rates by
     cohort and demographic, IPEDS 150% and 200% rates, outcome
     measures for part-time and transfer students
   - Peer benchmarking: selected peer institutions (10-15) with
     comparison across key metrics (enrollment, retention, graduation,
     student-faculty ratio, expenditures per FTE)
   - Strategic plan KPI tracker: institutional goals mapped to
     measurable indicators with baseline, target, and current values

6. **Fact book and institutional profile:**
   - Standardized data tables updated annually: enrollment, degrees
     conferred, retention/graduation, faculty/staff demographics,
     financial overview, research expenditures
   - Historical trend data: minimum 5-year longitudinal view for
     all key metrics
   - Automated data refresh workflow: source data extracted → tables
     updated → quality checked → published
   - Distribution: web publication, board of trustees format, quick
     facts one-pager, institutional profile for rankings submissions
</task>

<output_format>
For each component above, provide:
- A structured table or list I can paste directly into a project management
  tool as tasks and subtasks
- Automation rules written as "when [trigger], then [action]" statements
  that I can configure in ClickUp or a similar platform
- Notes on what to customize based on my specific institution type, reporting
  obligations, and staff capacity
- Compliance-specific callouts where federal or accreditor deadlines drive
  the workflow
</output_format>
→ Ready to build your first Super Agent?
Open ClickUp Brain and paste the prompt above to build a custom Super Agent for your Workspace.
Once your agent blueprint is generated, the next step is turning it into a practical workspace your IR team can use every day.
Summarize this article with AI ClickUp Brain not only saves you precious time by instantly summarizing articles, it also leverages AI to connect your tasks, docs, people, and more, streamlining your workflow like never before.
Summarize this article for me please
How to Set It Up in ClickUp (4 Steps)
Before you set up your Space, gather the institutional research data your team already uses across compliance reporting, data requests, surveys, accreditation support, and analytics. That usually includes reporting calendars, IPEDS component ownership, recurring request types, survey timelines, accreditation data inventories, dashboard refresh schedules, and fact book source tables. Starting with clean inputs makes your automations, dashboards, and deadline workflows much more reliable.
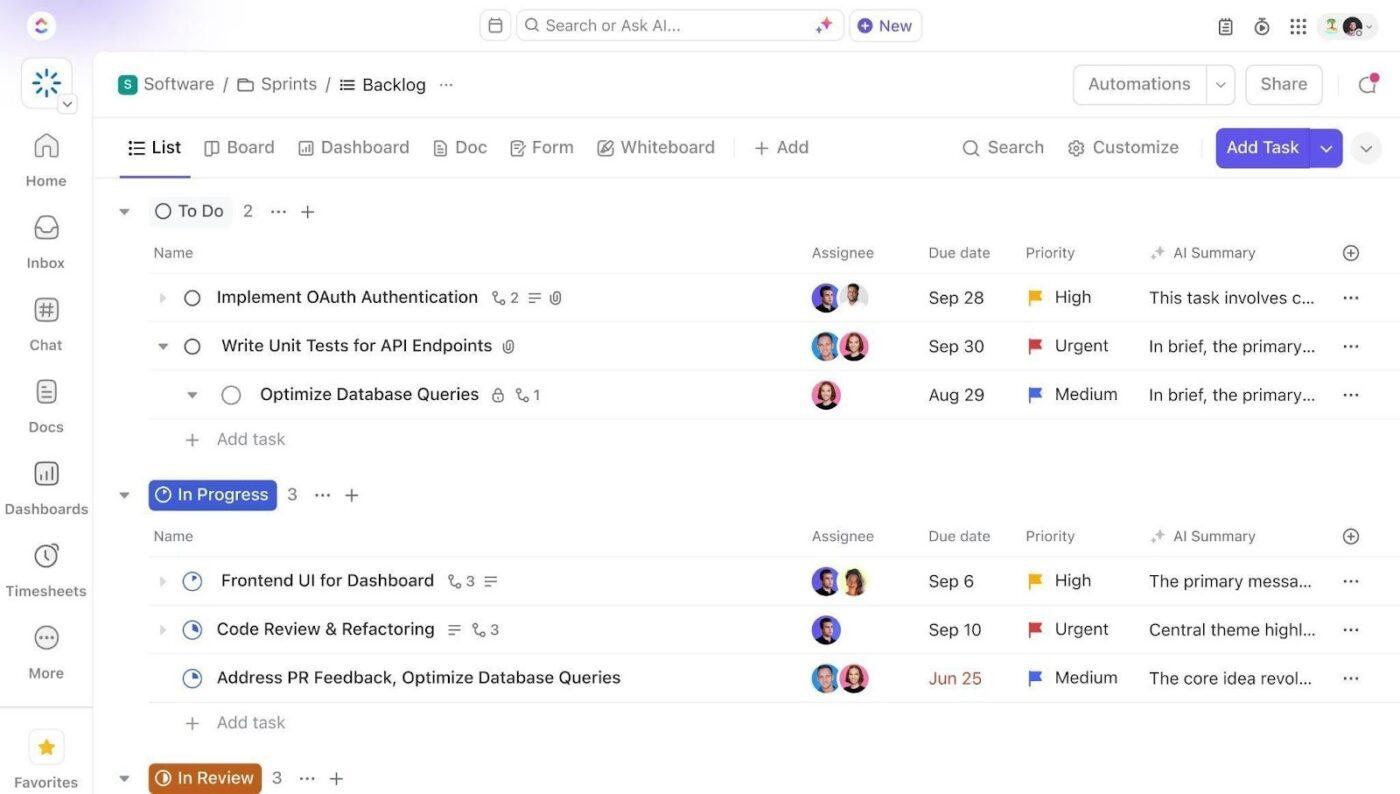
Create Your Workspace Structure
Set up a dedicated Space called Institutional Research. Add folders that map to your core functions: IPEDS & Federal Reporting for collection windows and component workflows, Data Requests for intake, queue management, delivery, and knowledge-base archiving, Surveys & Assessments for survey calendars, administration tasks, and reporting, Accreditation for accreditor-specific data support and evidence coordination, and Analytics & Dashboards for enrollment tracking, peer benchmarking, strategic plan KPIs, and fact book updates.
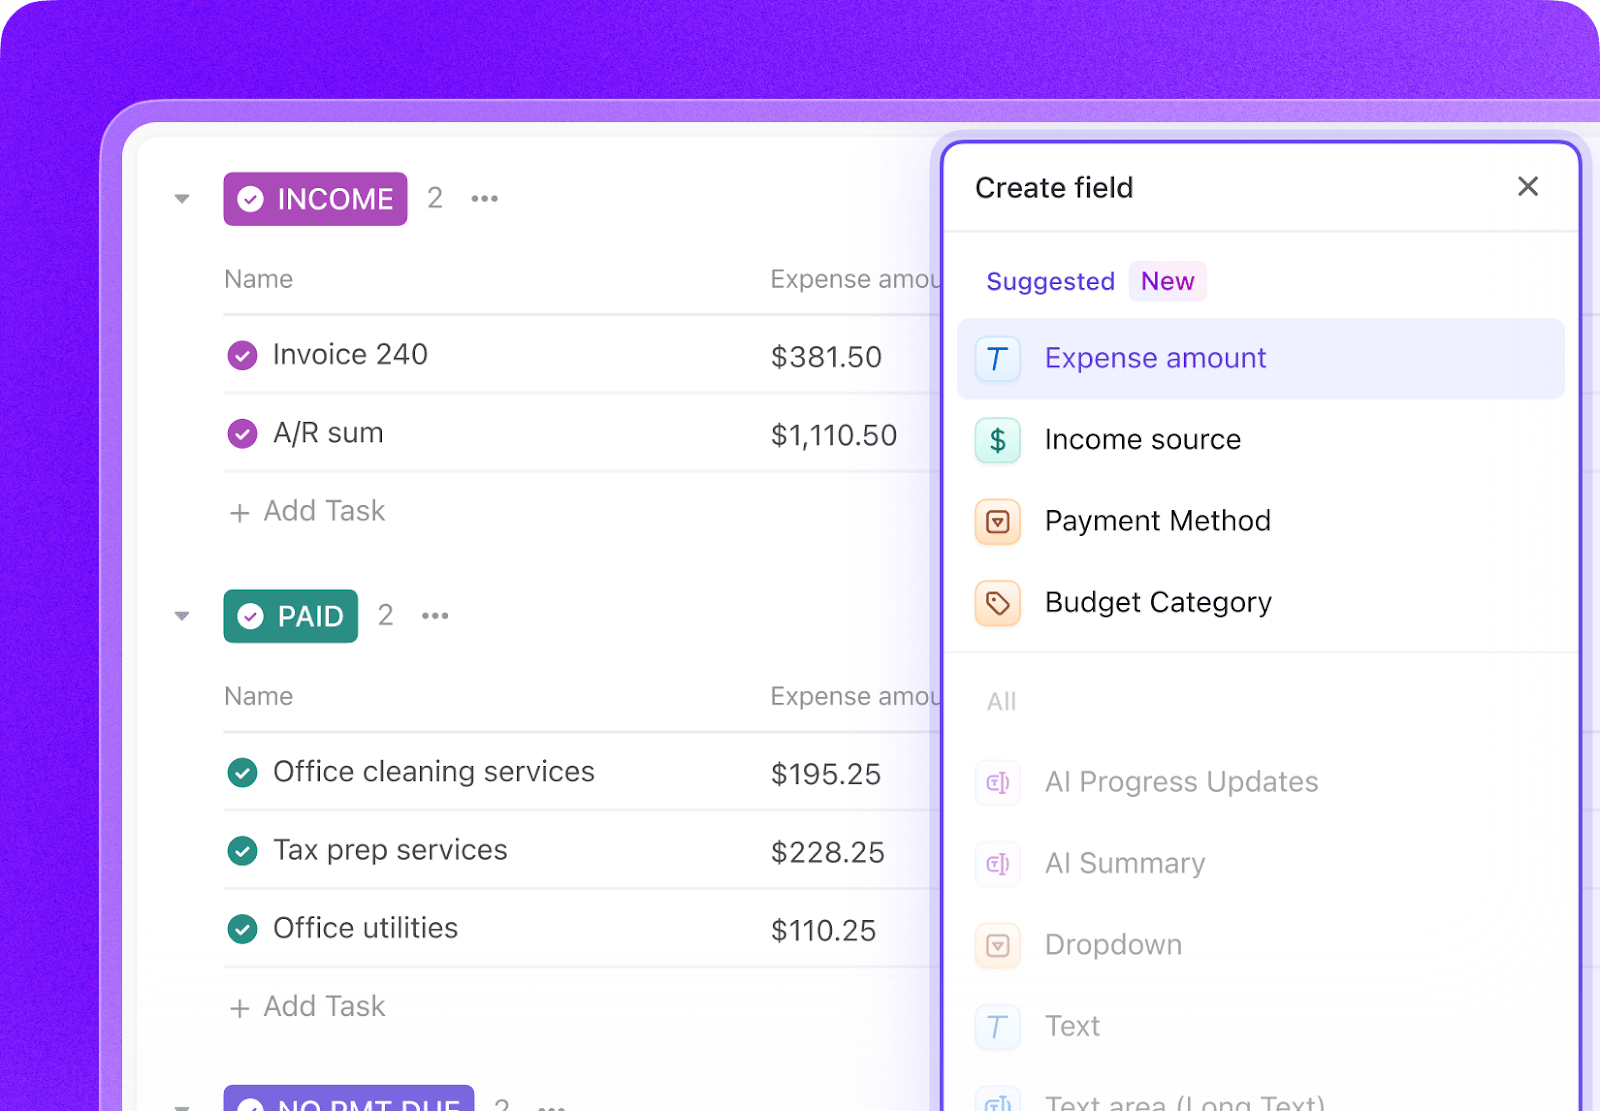
Configure Custom Fields on Every IR Task
Add Custom Fields to your IR task templates so every reporting project, request, survey, and accreditation deliverable includes the key data your team needs to manage work consistently. Include fields for report or component name, collection window, keyholder, data source, federal deadline, internal deadline, priority, and requestor. This consistent structure makes dashboards, automations, and workflow tracking much more reliable.
Paste the Prompt Into ClickUp Brain
Open ClickUp Brain in your new Space and paste the prompt from above. Fill in your variables, including institution name, institution type, enrollment, staff count, reporting obligations, reporting line, and current tools. Use the generated output to create a first draft of your IPEDS calendar, data request workflows, survey administration system, and accreditation support structure, then refine it for your IR office.
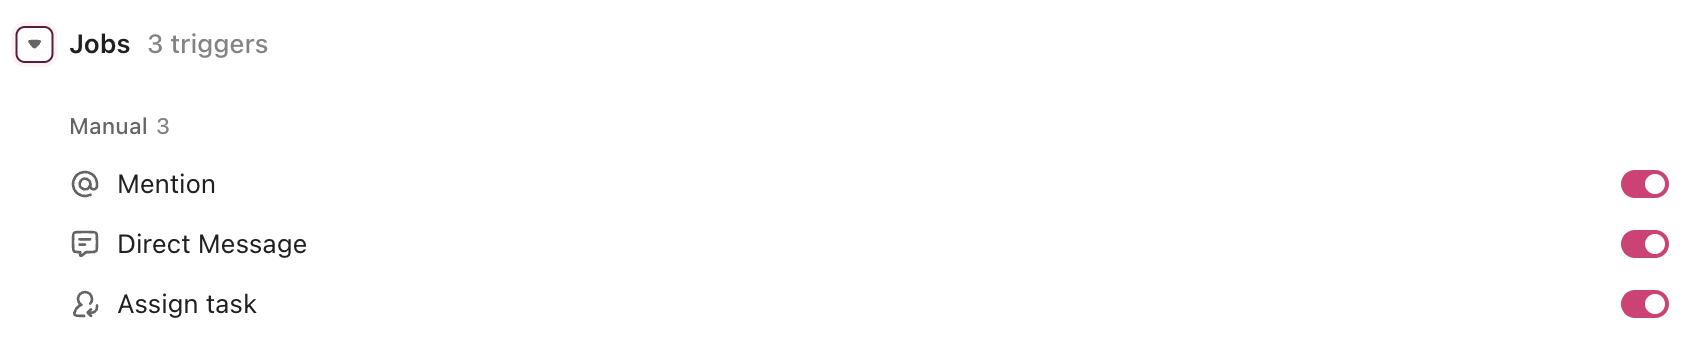
Set Up Automations for Ongoing Management
Create automations to keep institutional research work moving without constant manual follow-up. Use rules to launch IPEDS tasks by collection window, route incoming data requests by priority, escalate low survey response rates, flag overdue accreditation data deliveries, and trigger dashboard or fact-book refresh tasks on schedule.
Institution Research Automation
Ready to turn these steps into a working AI agent your team can actually use? Build it in ClickUp.
Pro Tip: Start with one workflow, such as IPEDS tracking or data request intake, before rolling the system out across the full IR operation. A smaller pilot helps your team refine templates, ownership rules, and reporting logic before scaling.
Summarize this article with AI ClickUp Brain not only saves you precious time by instantly summarizing articles, it also leverages AI to connect your tasks, docs, people, and more, streamlining your workflow like never before.
Summarize this article for me please
Recommended Custom Fields for Institutional Research Tasks
These fields create a consistent operating record across IPEDS submissions, data requests, surveys, accreditation support, dashboard updates, and fact book workflows.
Field
Type
Purpose
Report/Component Name
Short text
IPEDS component, survey, dashboard, or data project name
Received, In progress, Under review, Delivered, Archived
📘 Also Read:See all Custom Field types to choose the fields that best fit your workflow and reporting needs.
Summarize this article with AI ClickUp Brain not only saves you precious time by instantly summarizing articles, it also leverages AI to connect your tasks, docs, people, and more, streamlining your workflow like never before.
Summarize this article for me please
Core Automation Examples for Institutional Research
After your Custom Fields are set up, build automations that keep reporting cycles, request queues, survey campaigns, and accreditation support moving without repeated manual follow-up.
When…
Then…
A new IPEDS collection window begins
Create the component task set and assign each keyholder automatically
A data request is submitted with Urgent priority
Route it to the lead analyst and flag it for same-day review
A survey response rate falls below the target threshold
Trigger the next reminder wave and notify the survey owner
An accreditation data delivery deadline is 14 days away
Notify the assigned analyst and accreditor lead and create a checkpoint task
An IPEDS component fails a consistency check
Change status to Needs revision and assign a validation review
A fact book update cycle begins
Create the annual refresh checklist and assign source-table owners
📘 Also Read:See all Custom Field types to choose the fields that best fit your workflow and reporting needs.
Summarize this article with AI ClickUp Brain not only saves you precious time by instantly summarizing articles, it also leverages AI to connect your tasks, docs, people, and more, streamlining your workflow like never before.
Summarize this article for me please
What the Agent Covers Across the Institutional Research Lifecycle
An AI agent for institutional research is not a reporting tool or a BI dashboard. It is a system that runs inside your project management workspace and handles the structured, deadline-driven coordination work your IR office currently does by hand, including tracking compliance calendars, routing data requests, managing surveys, supporting accreditation, and keeping recurring analytics work organized.
Lifecycle Stage
What the Agent Does
What It Replaces
IPEDS reporting
Tracks collection windows, keyholder assignments, validation steps, revisions, and final submission milestones
Spreadsheet calendars, scattered reminders, and institutional memory
Data requests
Standardizes intake, routes requests by priority, tracks analyst workload, and archives completed work in a searchable repository
Email-first request handling and ad hoc backlog management
Separate survey calendars and manual campaign follow-up
Accreditation support
Maps data needs by accreditor, tracks evidence delivery, and coordinates IR contributions to self-studies and site visits
Fire-drill data pulls and disconnected evidence tracking
Enrollment and retention analytics
Keeps recurring dashboards, benchmarking, KPI monitoring, and cohort tracking organized by owner and refresh cycle
Dashboard updates that only happen when someone finds the time
Fact book production
Tracks source extraction, table updates, validation, publication, and downstream distribution formats
Annual fact-book sprints managed through email and shared files
Want to see how Super Agents work in a real ClickUp environment? Watch the walkthrough below to see how AI-generated workflows, tasks, and automations come together in practice.
Summarize this article with AI ClickUp Brain not only saves you precious time by instantly summarizing articles, it also leverages AI to connect your tasks, docs, people, and more, streamlining your workflow like never before.
Use the full prompt as-is. Add more complex reporting obligations, larger accreditation support needs, and broader benchmarking across research, finance, and graduate education metrics.
R2 university
Keep the full IR structure but simplify specialized reporting where needed. Emphasize enrollment, retention, accreditation, and recurring internal requests from academic leadership.
Liberal Arts College
Focus on lean-team efficiency, board reporting, survey work, student success metrics, and high-touch fact book updates with smaller but frequent requests.
Community College
Emphasize state reporting, transfer and workforce outcomes, cohort tracking for part-time students, and CCSSE or local survey administration.
Career or Vocational School
Focus on completion, placement, licensure, regulatory reporting, and rapid-turnaround dashboards tied to program outcomes and compliance.
Summarize this article with AI ClickUp Brain not only saves you precious time by instantly summarizing articles, it also leverages AI to connect your tasks, docs, people, and more, streamlining your workflow like never before.
Summarize this article for me please
Run Institutional Research in One Place
Institutional research breaks down when reporting calendars, request queues, survey workflows, accreditation evidence, and dashboard updates live in separate systems with no shared operating view. With ClickUp Brain, Custom Fields, and Automations, your institution can turn IR operations into one repeatable system that supports compliance reporting, faster request turnaround, better survey coordination, and more reliable analytics delivery.
The goal is not to replace your BI tools, statistical software, or source systems. It is to reduce the coordination work around them, improve visibility into deadlines and ownership, and free your IR team to spend more time on analysis that helps leadership make better decisions. Start with the prompt above, tailor it to your reporting obligations and staff capacity, and build a setup your team can actually use year-round.
Summarize this article with AI ClickUp Brain not only saves you precious time by instantly summarizing articles, it also leverages AI to connect your tasks, docs, people, and more, streamlining your workflow like never before.
Summarize this article for me please
Frequently Asked Questions
Can AI actually help with IPEDS reporting?
Yes. AI agents don’t fill out IPEDS surveys for you. They manage the workflow around IPEDS: tracking which components are due, assigning keyholders, enforcing internal deadlines, running cross-component consistency checks, and documenting revisions. The data expertise stays with your IR team. The project management overhead is automated.
How does this handle ad hoc data requests that come in constantly?
The data request management system creates a structured intake, priority classification, and queue that replaces the current model of “whoever emails IR first gets answered first.” Requests are tagged by topic, assigned to analysts, and archived in a searchable knowledge base. When someone asks the same question next year, the prior analysis is findable in seconds.
No. ClickUp with an AI agent manages the workflow and project coordination around your analytics work. Tableau, Power BI, and R/Python handle the visualization and statistical analysis. The agent tracks when dashboards need updating, routes data requests to analysts, and manages IPEDS timelines. They serve different purposes and work best together.
How does this help small IR offices with just one or two people?
Small offices benefit the most. When one person handles IPEDS, data requests, surveys, and accreditation, the risk of dropped balls is highest. The agent enforces deadlines, maintains a knowledge base (critical when that one person leaves), and provides structure that makes 1-2 people operate like a team of five. See also how AI agents can help your academic advising and financial aid offices.
Everything you need to stay organized and get work done.

 Institution Research Automation


