مايكروسوفت Excel هو برنامج جداول بيانات يُستخدم بشكل عام لتنظيم وتنسيق كميات كبيرة من البيانات، ولكنه يحتوي أيضًا على معرض أشكال متنوع لإنشاء مخططات انسيابية!
الرسم التخطيطي الذكي هو الرسم التوضيحي المفضل لإنشاء أي مخطط في Excel. ومع ذلك، فأنت بحاجة إلى مخطط انسيابي أكثر إقناعًا للتعاون والتواصل. في هذا الدليل، سنتعرف في هذا الدليل على وظيفة المخططات الانسيابية، وكيفية إنشاء مخطط انسيابي في Excel، وبديلي Excel لجعل مخططاتك الانسيابية تنبض بالحياة. (المفسد: البديلان في نفس البرنامج!)
⏰ ملخص 60 ثانية
- ضع في اعتبارك استخدام أدوات مثل ClickUp لإنشاء مخطط انسيابي وإدارة المهام بشكل أفضل
- المخططات الانسيابية تصور سير العمل والعمليات
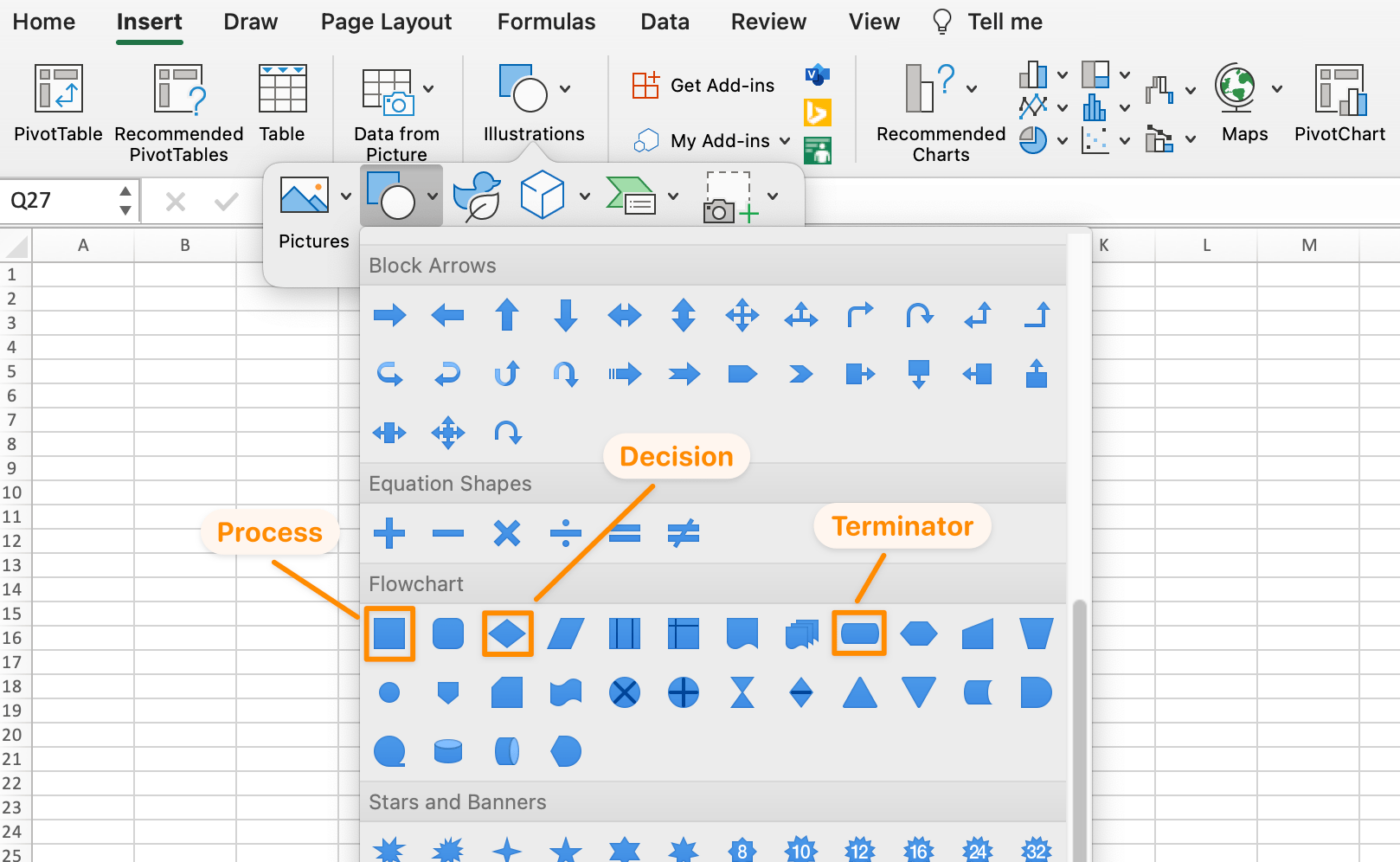
- الأشكال الرئيسية تشمل الشكل البيضاوي (المنهي) والمستطيل (العملية) والماسي (القرار)
- إنشاء مخططات انسيابية في Excel باستخدام إدراج > الأشكال
- قم بتخصيص أحجام الأشكال والنصوص من أجل الوضوح
- ربط الأشكال باستخدام الأسهم لإظهار العلاقات
- Excel ليس مثاليًا للتعاون بين الفرق
ما هو المخطط الانسيابي؟
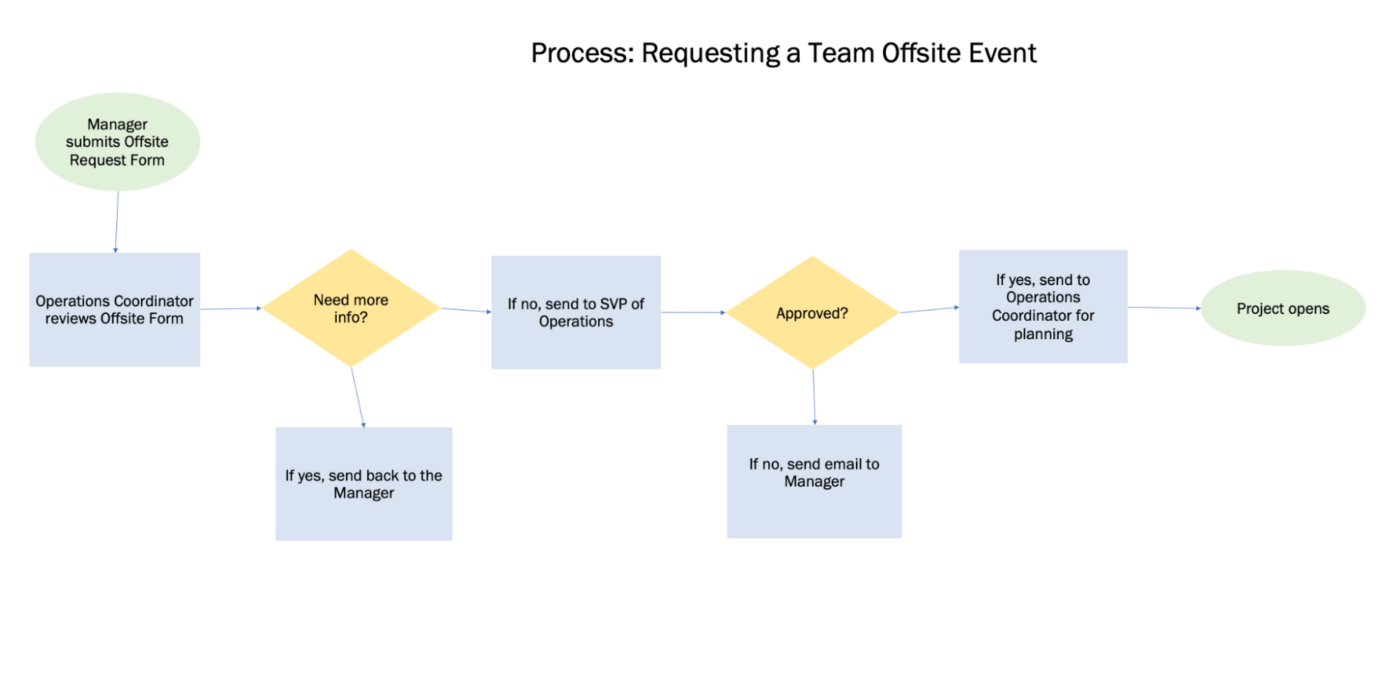
المخطط الانسيابي عبارة عن رسم بياني مكون من أشكال متصلة بأسهم لتصور سير العمل أو العملية أو أي إجراء لصنع القرار. تُعد المخططات الانسيابية مناسبة للجميع لأنها على عكس المستندات المثقلة بالنصوص، فهي تكثف المعلومات حتى يتمكن الجمهور من استيعاب المعلومات بشكل أسرع. تعمل المخططات الانسيابية على تحويل الأفكار إلى إجراءات مدروسة لحل المشاكل، وفي النهاية زيادة الإنتاجية لأن الأمور تسير بسلاسة. فكر في أي حدث واجهته في مرحلة ما في مؤسستك، على سبيل المثال. يمكن أن تكون عملية تعيين موظفين جدد، أو طلب إجازة ما قبل التعيين، أو تنظيم اجتماع انطلاق مشروع. هذه الأحداث لها عملية قائمة بحيث يتخذ الجميع الخطوات الصحيحة باستمرار نحو النجاح. تساعد المخططات الانسيابية الشخص الذي يقوم بإنشاء هذه العمليات على تصور النطاق والتسلسل والمراحل وأصحاب المصلحة المعنيين.
مكافأة: برنامج الرسم البياني!
الأشكال الأساسية المستخدمة في مخططات Excel الانسيابية
ليس من الضروري أن تكون ضليعاً في برمجة المخططات الانسيابية. كل ما تحتاج إلى معرفته هو اللبنات الأساسية لجعل مخططك الانسيابي سهل الفهم. الأشكال الرئيسية الأربعة للمخطط الانسيابي التي سنستخدمها في هذا البرنامج التعليمي هي

| الرموز | الوظيفة | كيفية إضافة |
|---|---|---|
| البيضاوي | الطرفية: نقطة البداية ونقطة النهاية للمخطط الانسيابي | علامة تبويب إدراج > علامة التبويب إدراج > الرسم التوضيحي > الأشكال > المخطط الانسيابي > المنهي |
| المستطيل | العملية: يمثل خطوة واحدة في الإجراء | علامة التبويب "إدراج" > علامة التبويب "إدراج" > الرسم التوضيحي > الأشكال > المخطط الانسيابي > العملية |
| الماس | القرار: يمثل إجراء القرار | علامة التبويب "إدراج" > علامة التبويب "إدراج" > الرسم التوضيحي > الأشكال > المخطط الانسيابي > القرار |
| السهم | السهم: يربط بين الأشكال لإظهار العلاقة | علامة التبويب إدراج > علامة التبويب التوضيح > الأشكال > المخطط الانسيابي > السهم |
هل أنت مستعد لإنشاء مخطط انسيابي خاص بك؟ اختر إحدى أفكارك أو مهامك واتبع دليلنا المفصل خطوة بخطوة لإنشاء هذا المخطط الانسيابي! ⬇️
كيفية إنشاء مخطط انسيابي في Excel بأشكال مخصصة
ملاحظة: في هذا البرنامج التعليمي، نستخدم Microsoft Excel لنظام التشغيل Mac الإصدار 16. 60. قد تبدو الخطوات و الميزات مختلفة إذا كنت تستخدم إصدارًا آخر. *
Excel هو تطبيق كبير يحتوي على مئات الوظائف. الدالتان الأكثر أهمية لاستخدامهما وتسريع عملية إنشاء المخطط الانسيابي هما: النسخ و اللصق. لذا بدلًا من إضافة الأشكال واحدًا تلو الآخر إلى جدول البيانات الخاص بك، سنقوم بتنسيق الأشكال أولًا. بعد ذلك يمكنك نسخ الأشكال ولصقها في عملية المخطط الانسيابي الخاص بك. ها قد بدأنا!
ذات صلة: تعرّف على كيفية إنشاء مخطط انسيابي في محرر مستندات Google.
1. أضف أشكال المخططات الانسيابية للإنهاء والعملية والقرارات
انتقل إلى علامة التبويب إدراج > الإيضاح > الأشكال > مخطط انسيابي> حدد شكلاً > انقر أعلى جدول البيانات للإضافة.
2. ضبط أحجام أشكال المخططات الانسيابية
نريد إضافة نص داخل الأشكال، لذا دعنا نكبرها. حدد أحد الأشكال > اضغط على Command + A على لوحة المفاتيح لتحديد جميع الأشكال > اضغط مع الاستمرار على Shift > انتقل إلى زاوية الشكل واسحب لتوسيع جميع أشكال المخطط الانسيابي الثلاثة.
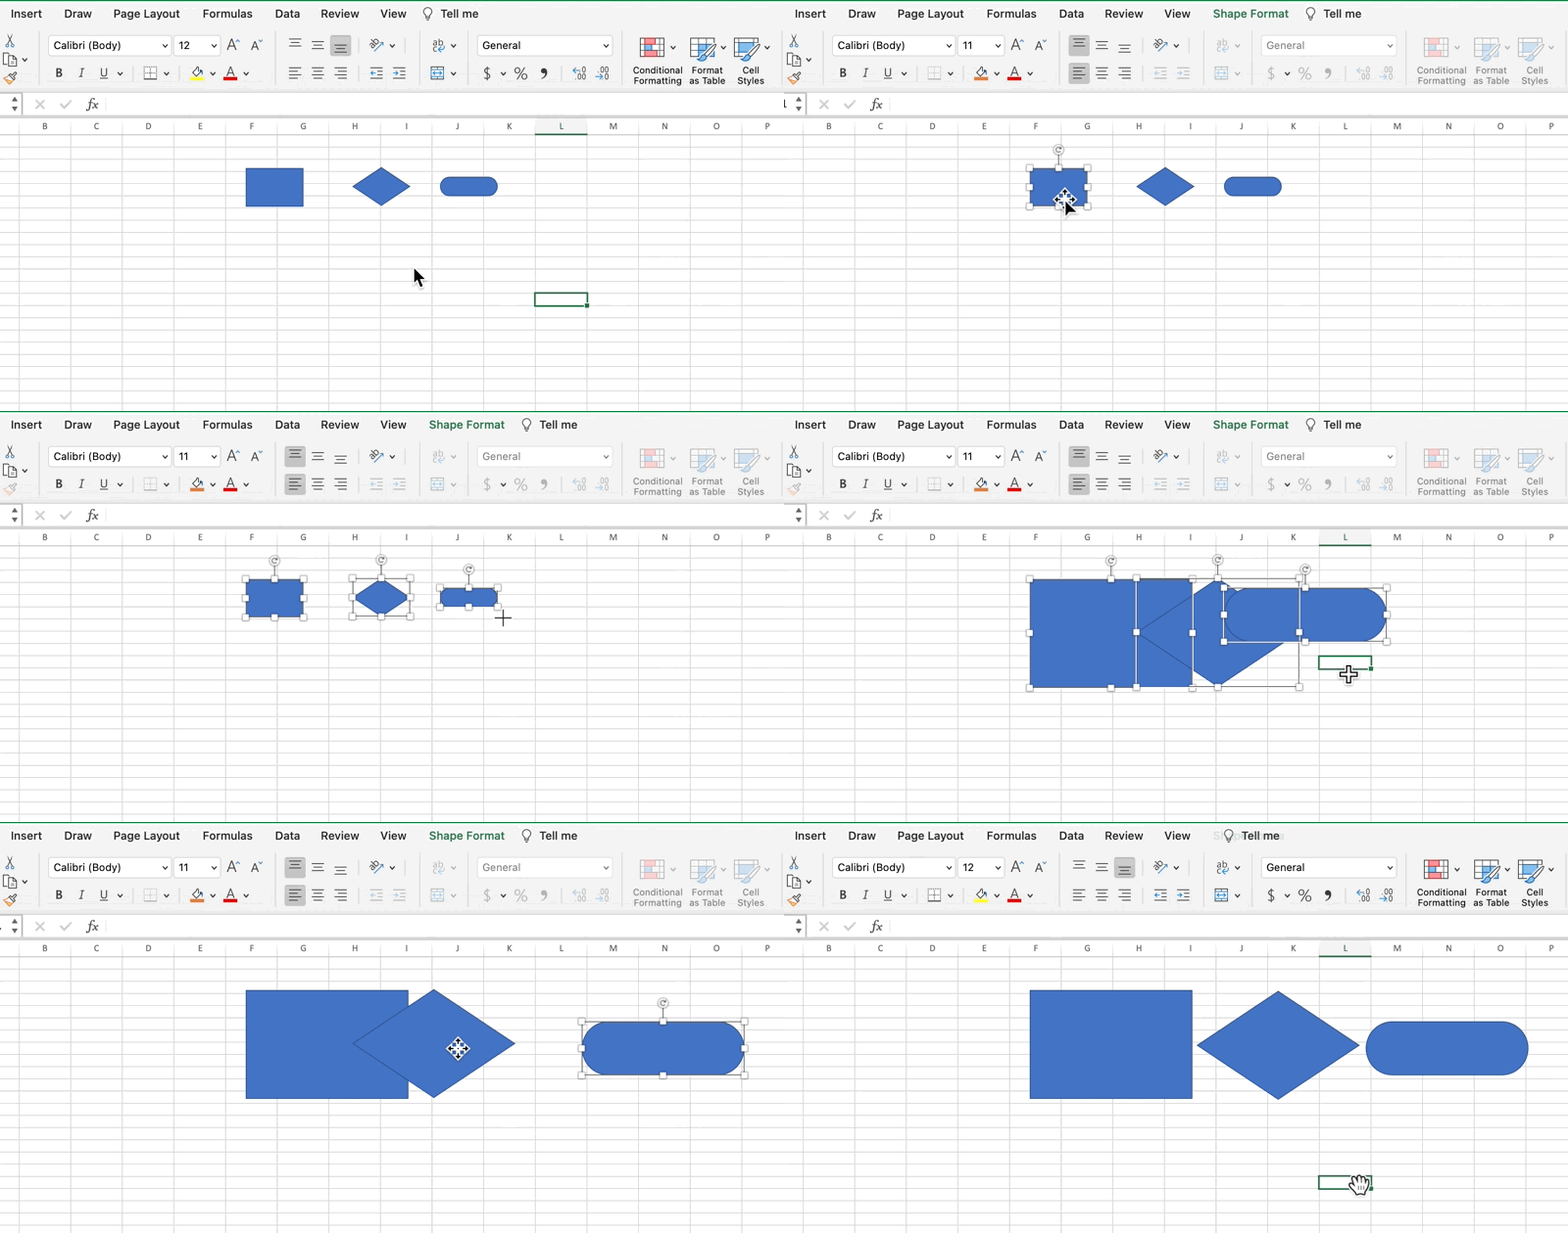
3. تخصيص كل شكل من أشكال المخططات الانسيابية
سوف نستخدم وظيفة النسخ واللصق لتخصيص الأشكال، ولكن هناك أيقونة تنسيق مفيدة لمساعدتنا في ذلك!
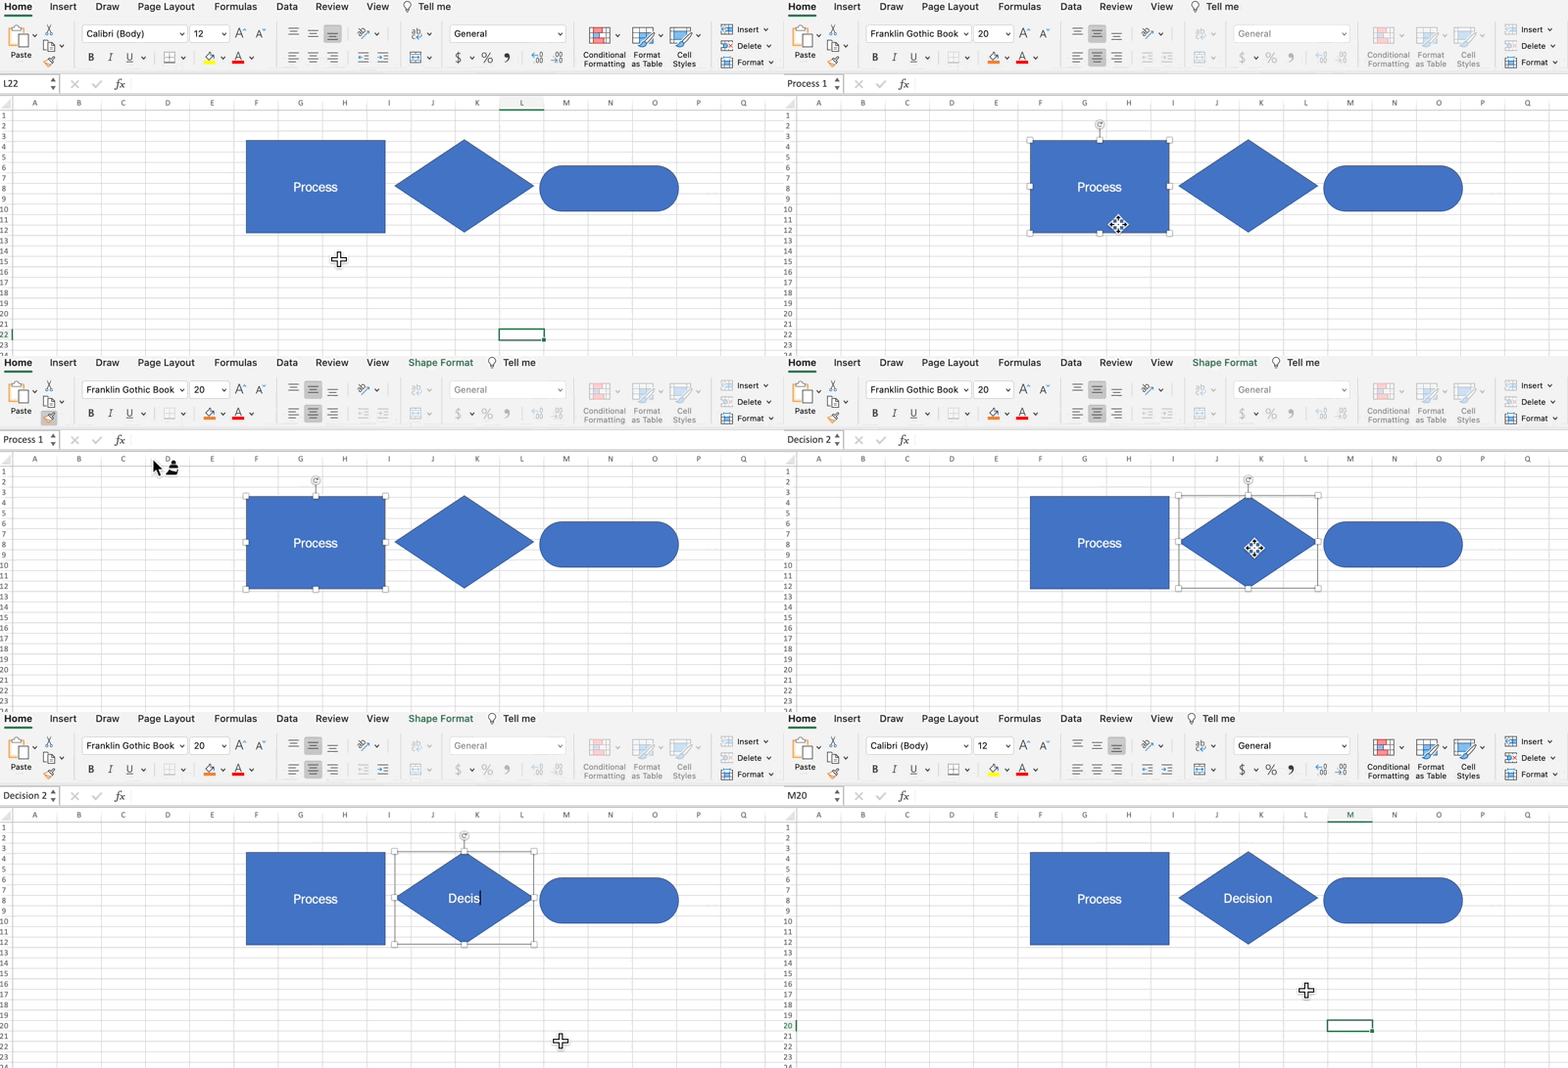
- انقر نقرًا مزدوجًا داخل شكل العملية للكشف عن المؤشر، وقم بتسمية الشكل عملية، وتوسيط النص
- قم بتغيير اسم الخط وحجم الخط حسب تفضيلاتك
- حدد شكل العملية > انقر على أيقونة التنسيق تحت علامة التبويب المنزل > انقر على الأشكال الأخرى للصق التنسيق
- قم بتسمية الشكل الماسي القرار والشكل البيضاوي المنهي
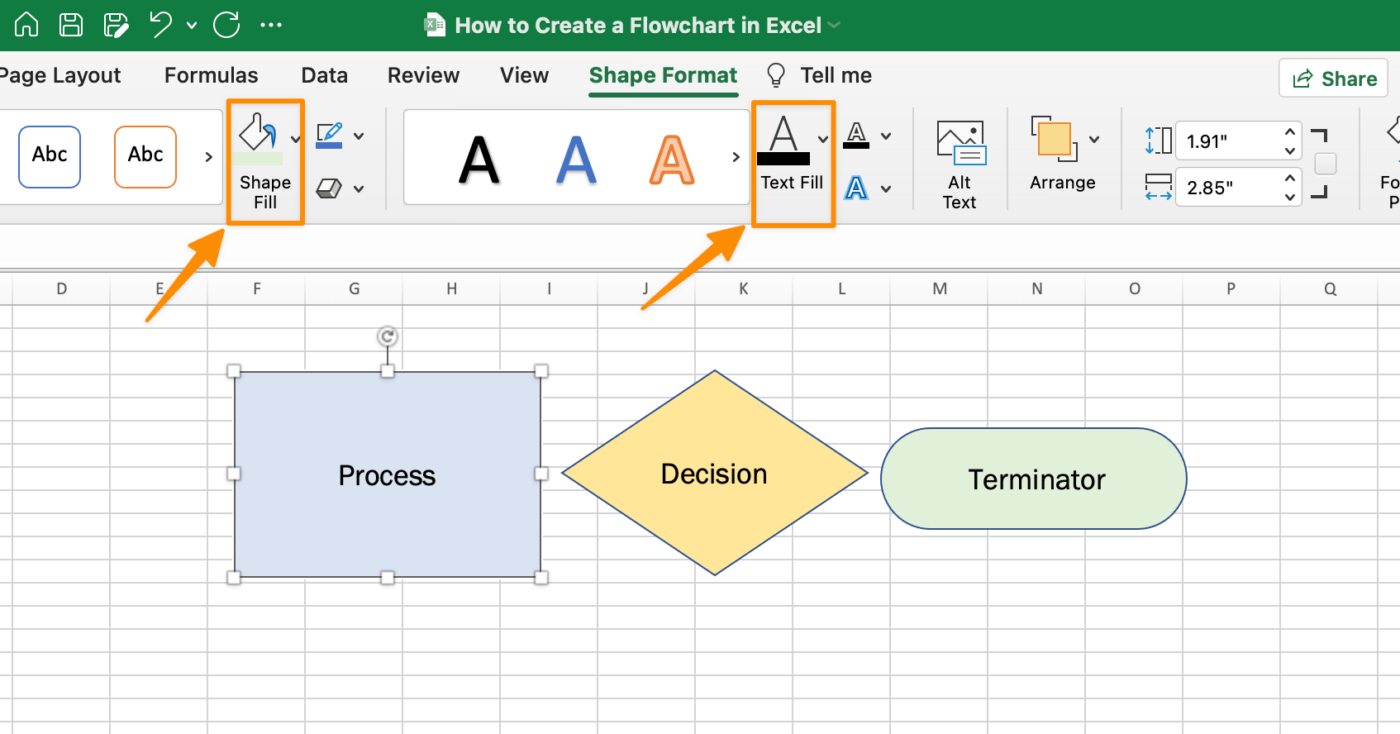
بعد ذلك، حدد ألوان الخلفية والخط لكل شكل. انقر فوق أحد الأشكال > انتقل إلى علامة التبويب الشكل التنسيق > تعبئة الشكل و تعبئة النص
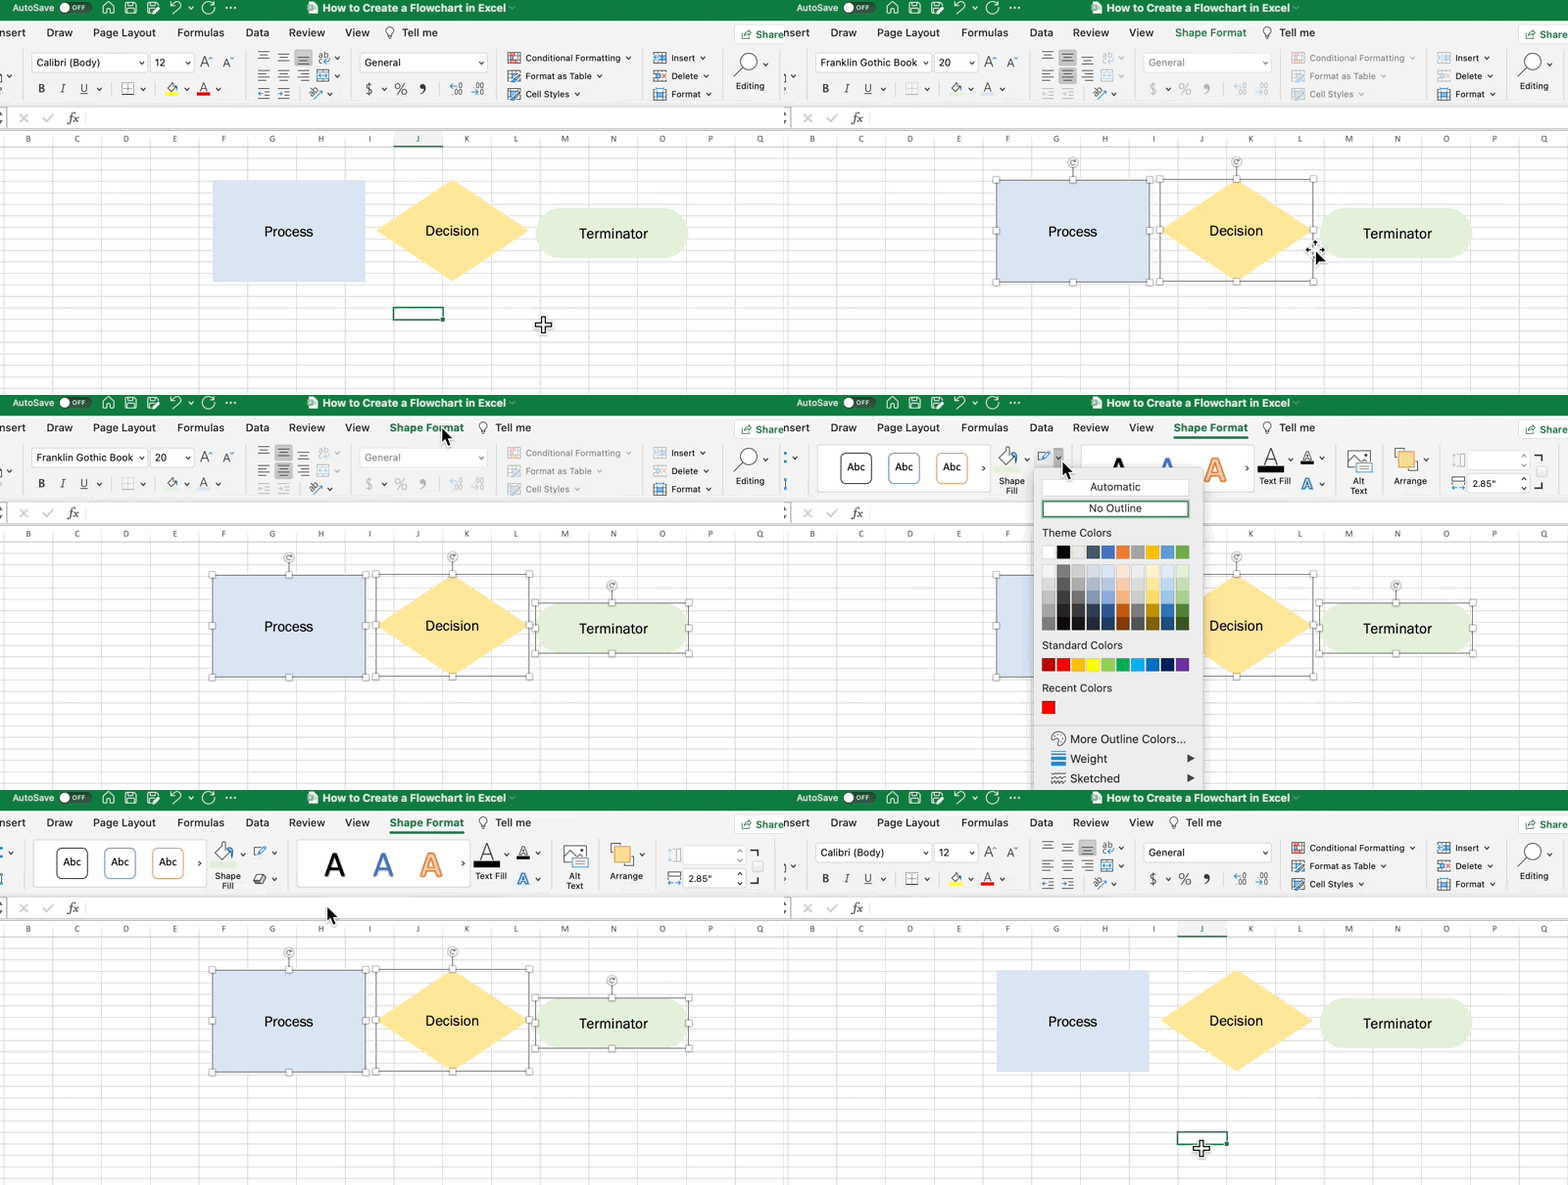
نصيحة احترافية: لإزالة مخطط الشكل للحصول على مظهر أنظف، حدد كل الأشكال > شكل علامة التبويب تنسيق علامة التبويب > شكل مخطط لا مخطط
4. ابدأ بإضافة خطوات المخطط الانسيابي
مع الأشكال المخصصة بالكامل (والمتسقة)، انسخ والصق شكل المخطط الانسيابي في Excel لرسم خطواتك!
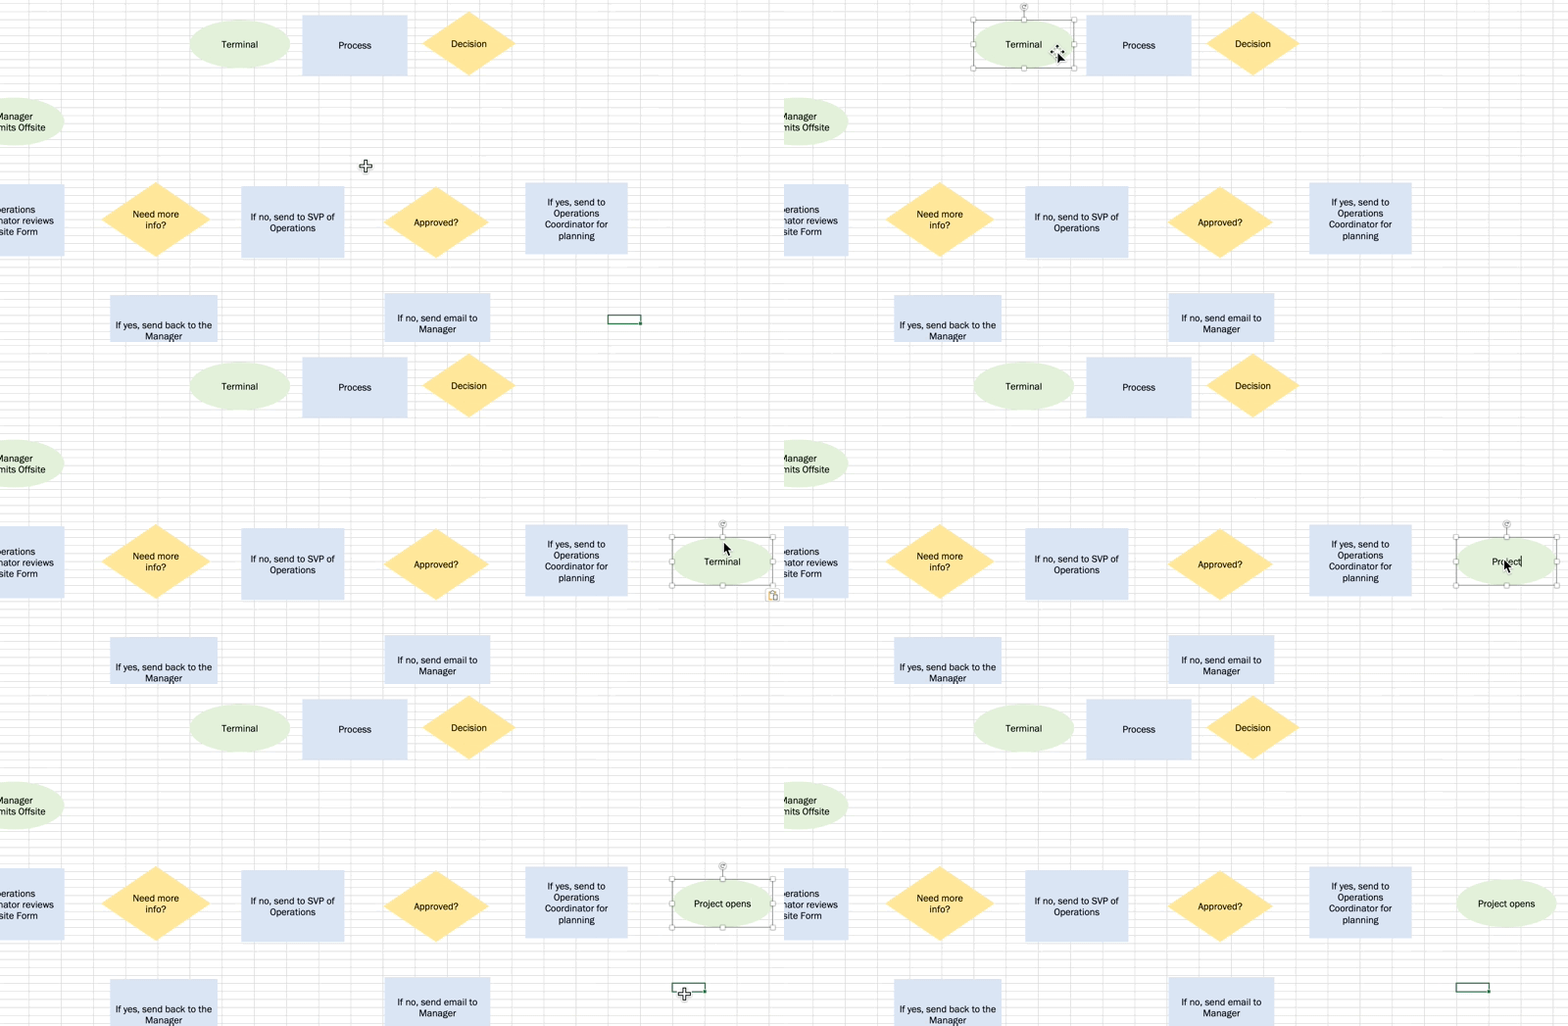
5. إدراج علامة تبويب لإضافة الروابط لإظهار علاقة كل شكل من الأشكال
انتقل إلى علامة التبويب إدراج علامة التبويب الأشكال الخطوط السهم.
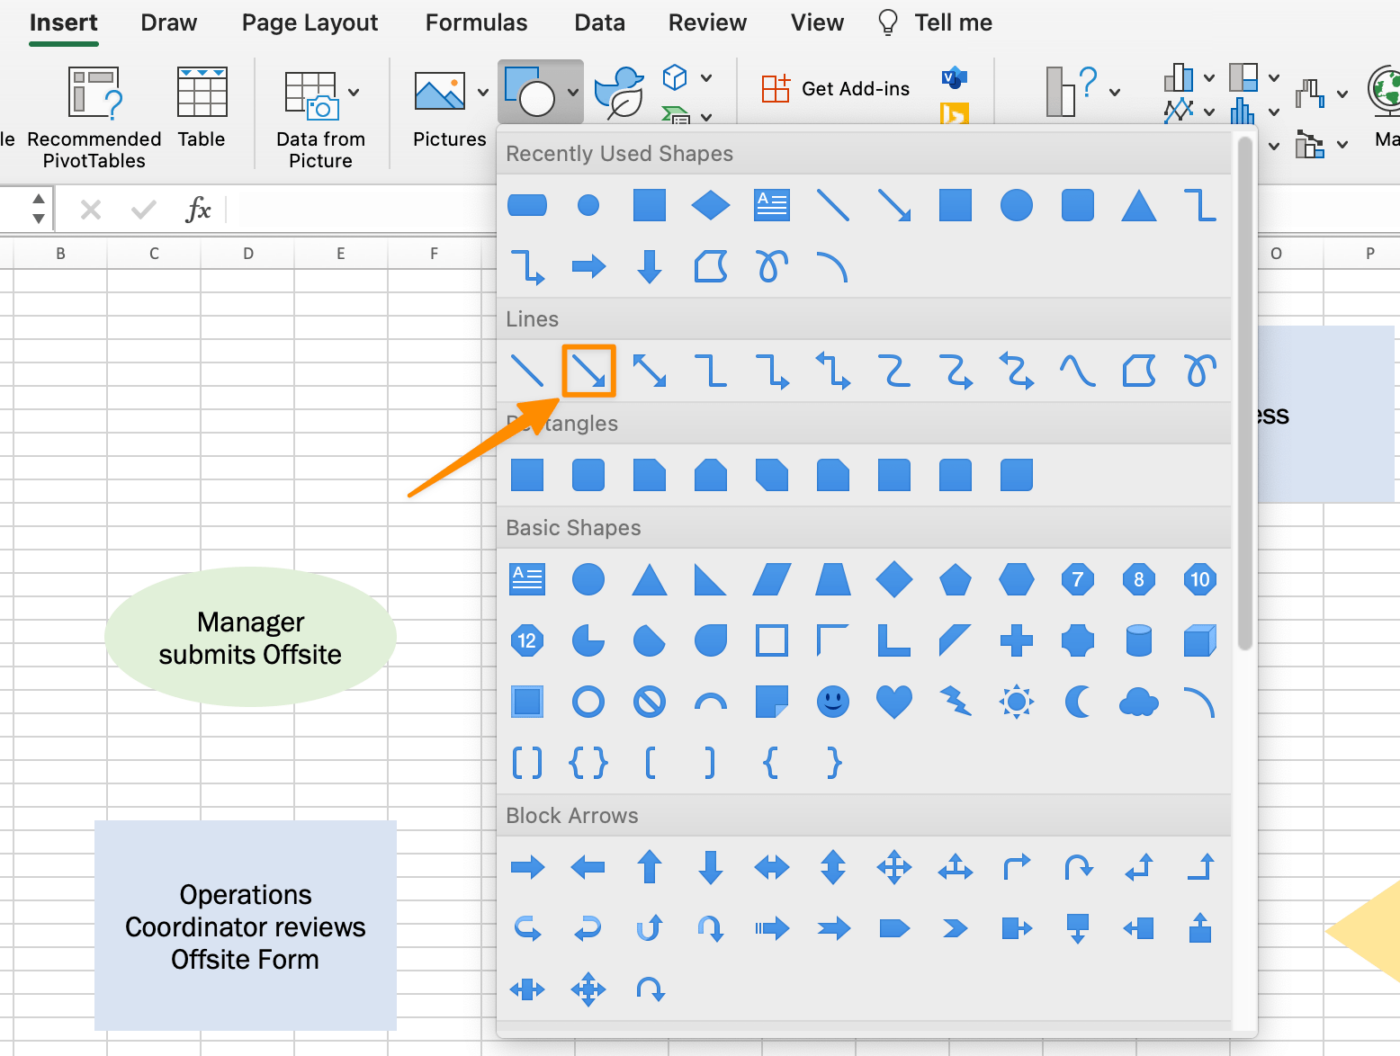
استخدم الدوائر الخضراء كدليل لرسم الأسهم وربط الأشكال.
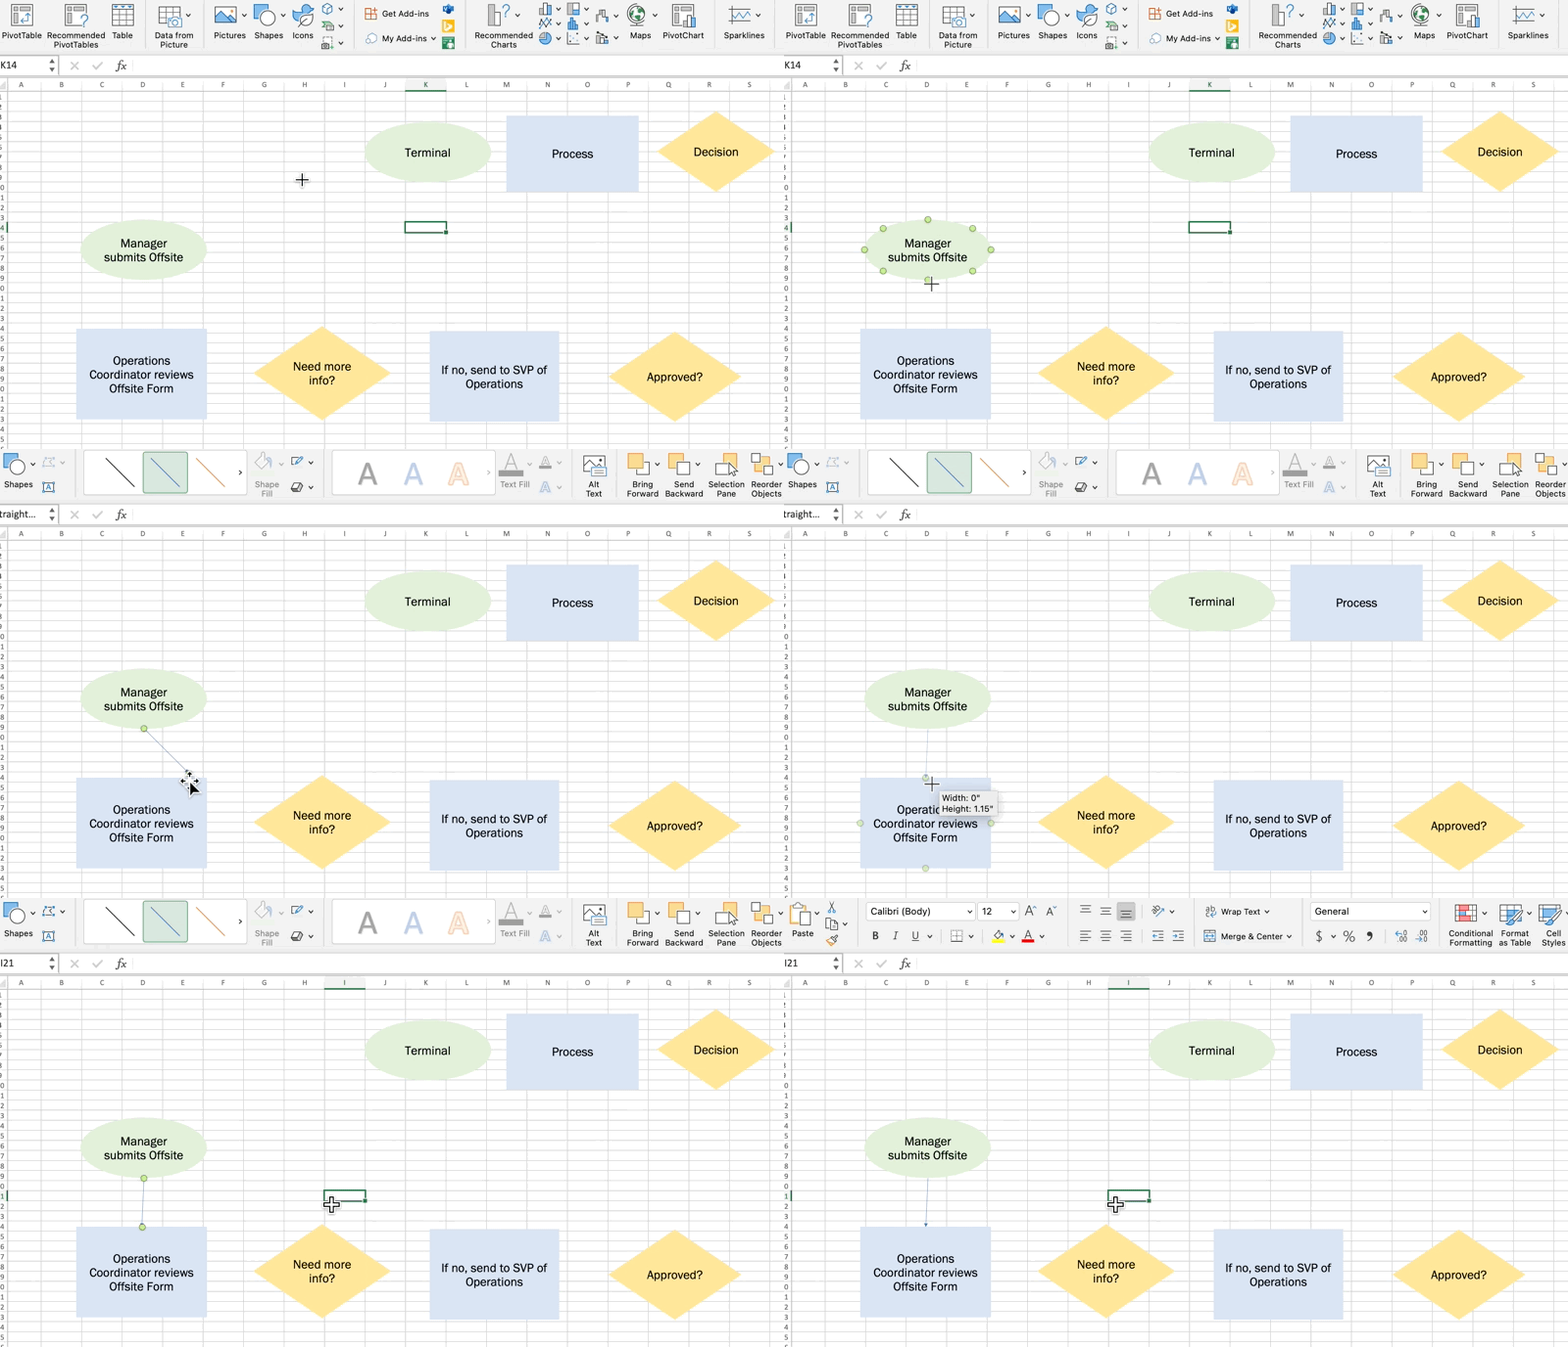
6. أضف عنوانًا إلى مخططك الانسيابي
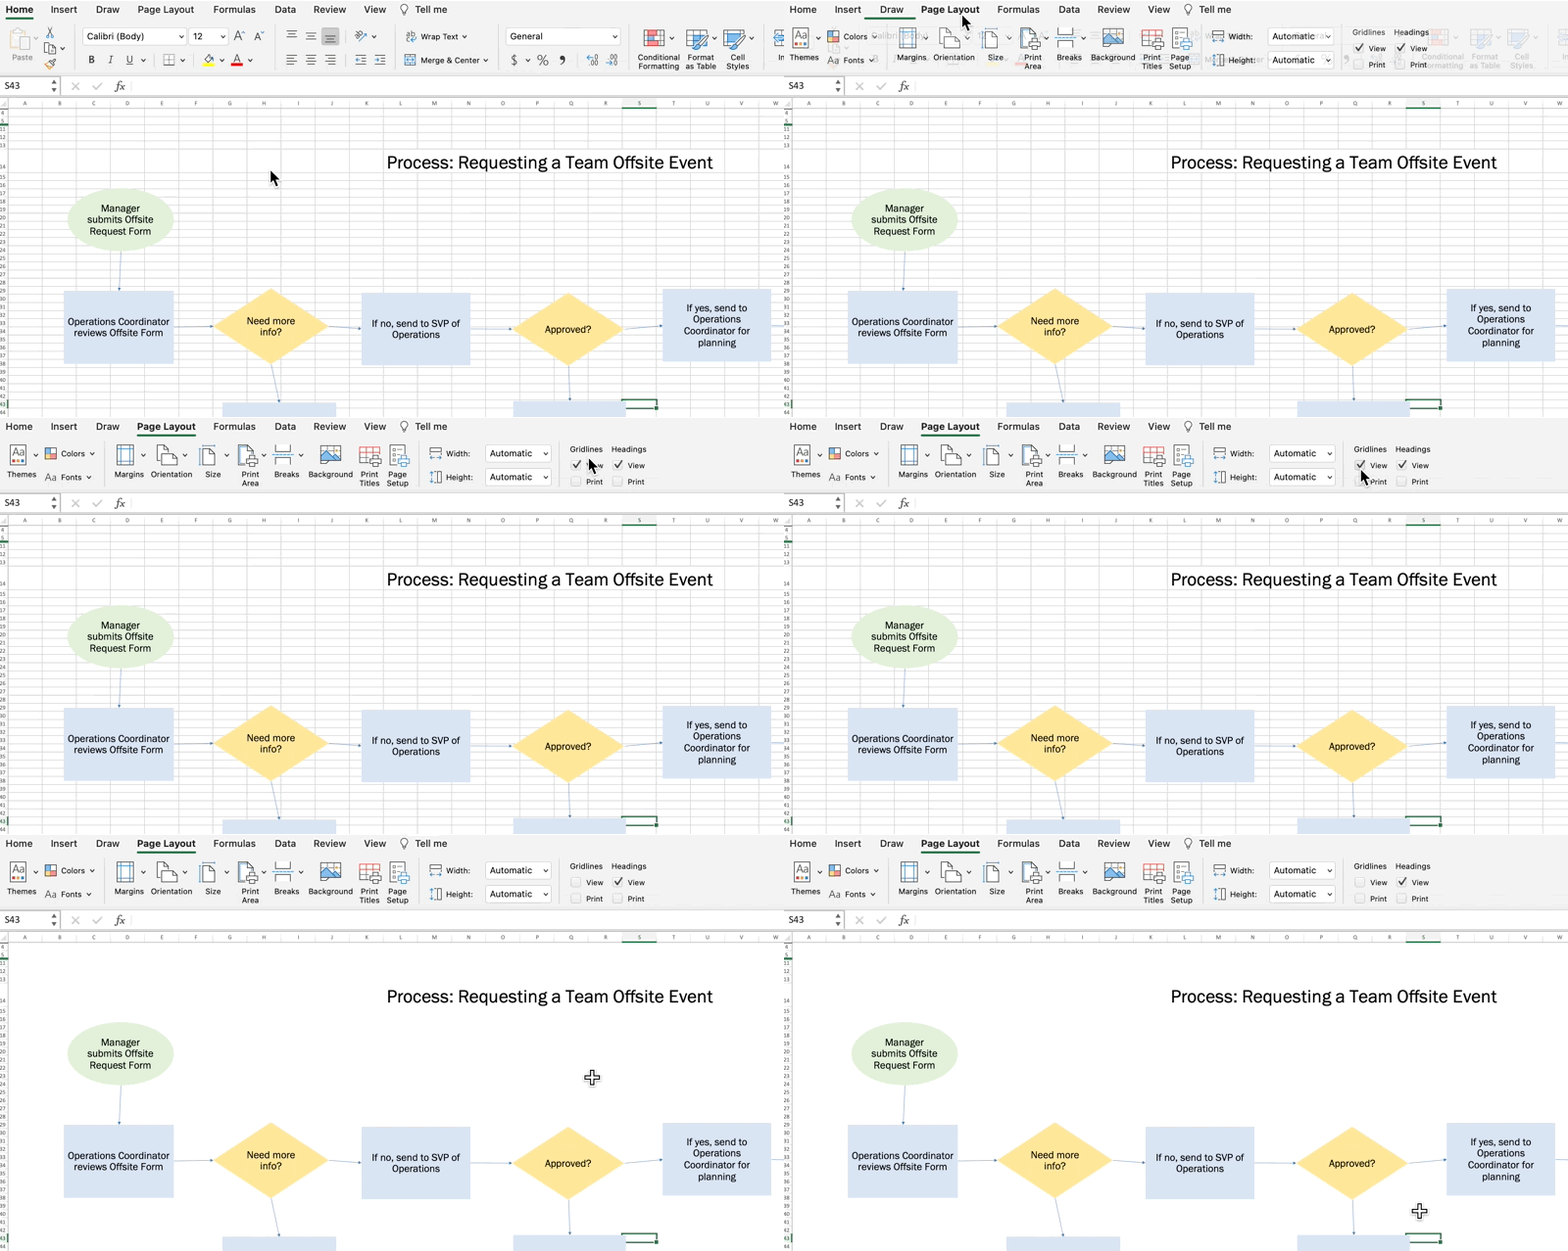
احذف الأشكال الموجودة أعلى جدول البيانات وأضف عنوانًا.
نصيحة: للحصول على مظهر أنظف، قم بإزالة خطوط الشبكة في مخطط Excel الانسيابي. انتقل إلى الصفحة علامة التبويب التخطيط > قم بإلغاء تحديد المربع عرض تحت خطوط الشبكة
مكافأة: أفضل أدوات برامج المخططات الانسيابية لنظام التشغيل Mac
8. احفظ مخطط Excel الانسيابي كقالب
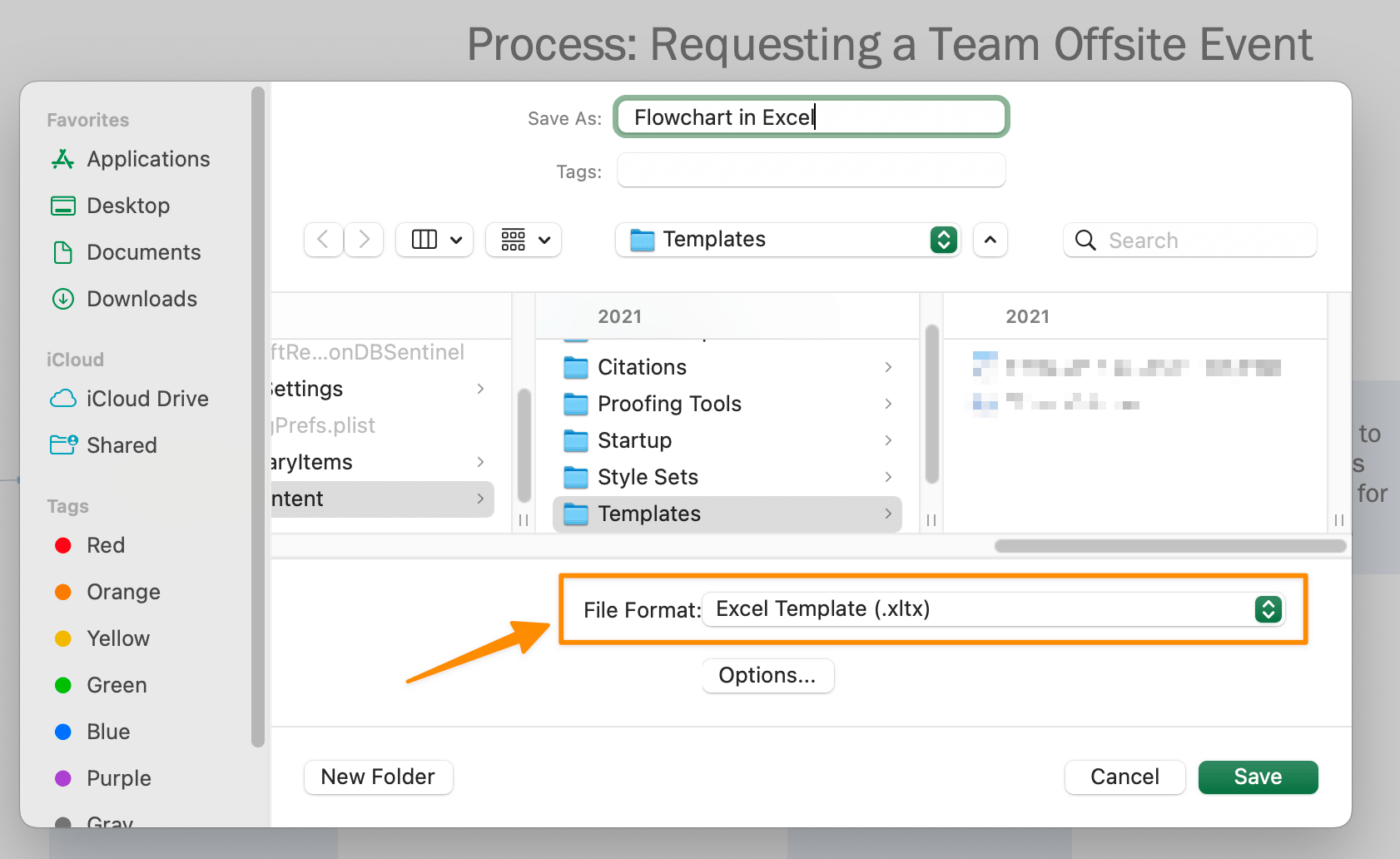
انتقل إلى ملف > حفظ كقالب. قم بتسمية قالب المخطط الانسيابي الخاص بك وانقر على حفظ. (تحقق مرة أخرى من تعيين الملف التنسيق على إكسيل قالب.)
ها أنت ذا! أنت تعرف الآن كيفية إنشاء مخطط انسيابي في Excel! لدينا موارد وتوصيات أخرى من Microsoft Office إذا كنت تبحث عن بدائل أخرى لتحسين احتياجاتك التخطيطية. ⬇️
حدود المخططات الانسيابية في Excel
على الرغم من أنه من المفيد معرفة كيفية إنشاء مخططات انسيابية في أداة شائعة مثل Microsoft Excel، إلا أن جداول البيانات ليست سهلة التعاون. سيواجه الأشخاص الأقل إلمامًا بالتنقل في Excel تجربة أصعب ومنحنى تعليمي أطول لإكمال العمل.
كما نعلم جميعًا (ونختبر جميعًا)، تتغير المشاريع يوميًا. لذلك أثناء انشغالك بإنشاء المخططات الانسيابية يدويًا في Excel، قد تتغير البيانات والأشخاص والظروف، وسيتعين عليك البدء من جديد. ومع ذلك، هذا ليس مثاليًا لجلسات العصف الذهني الإبداعية!
هذا الوضع الذي لا مفر منه هو السبب في ضرورة استخدام أداة برمجية بديهية للمخطط الانسيابي لإزالة العمل اليدوي والتحديث في الوقت الفعلي. مع ClickUp، بديل Microsoft Excel القوي، لن تحتاج إلى إنشاء إصدارات متعددة من قوالب المخططات الانسيابية!
إنشاء مخططات انسيابية باستخدام بدائل Excel
ClickUp عبارة عن منصة إنتاجية شاملة حيث تجتمع الفرق معًا لتخطيط العمل وتنظيمه والتعاون في العمل باستخدام المهام والمستندات والخرائط الذهنية والأهداف واللوحات البيضاء والمزيد! يتيح ClickUp للفرق من جميع الأنواع والأحجام إنجاز العمل بفعالية أكبر، مما يرفع الإنتاجية إلى مستويات جديدة.
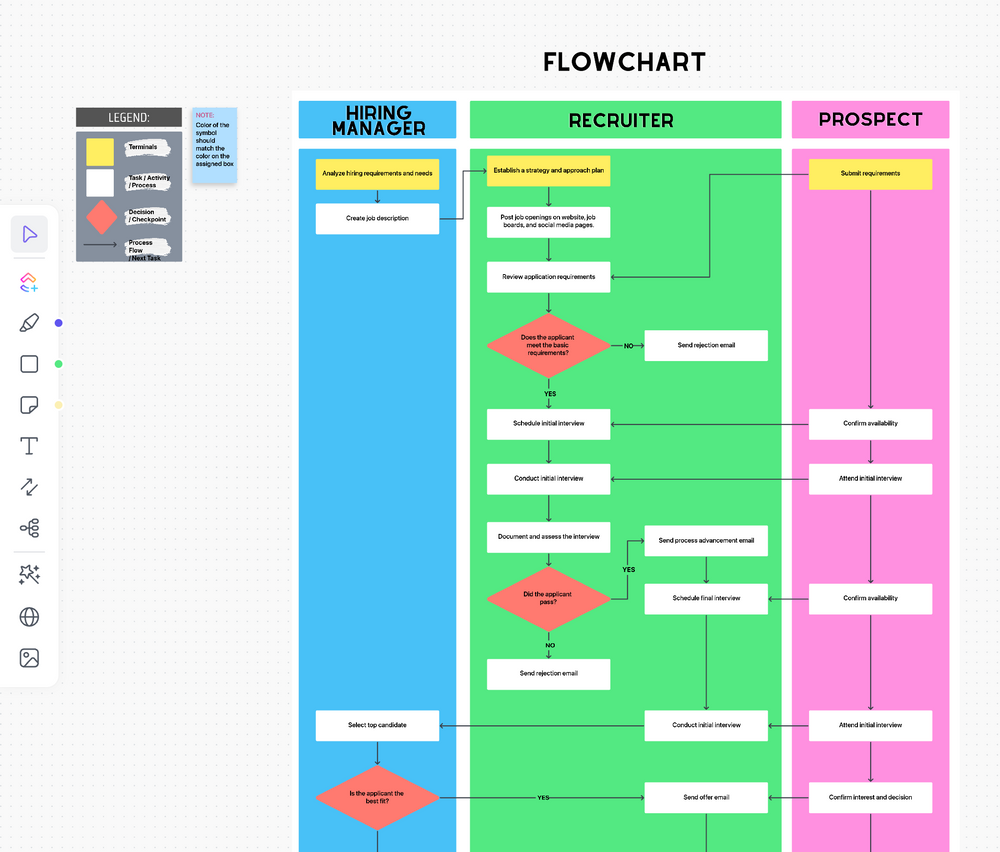
تقوم المخططات الانسيابية في ClickUp بما لا تستطيع جداول بيانات Excel القيام به: تحويل كل عملية تجارية إلى مهام قابلة للتنفيذ.
لم تُصمم المخططات الانسيابية ليتم إنشاؤها وتخزينها في مكان ما في محرك أقراص مشترك. فهي مصممة لتكون حلاً أو سير عمل قابل للاستخدام. باستخدام ClickUp، يتم إنشاء المهام مباشرةً من المخطط الانسيابي بحيث يكون الجميع على دراية بالأدوار والمهام والمواعيد النهائية!
ذات صلة: إظهار التبعيات في Excel وإنشاء مخطط انسيابي في Excel
الخرائط الذهنية في ClickUp
تُعد الخرائط الذهنية في ClickUp مثالية لتفريغ تدفق الوعي أو المعلومات المخطط لها. مع الخرائط الذهنية، لن تضطر إلى الضغط على تفاصيل تنسيق كل شكل أو خطوة. سيكون لديك المزيد من الطاقة الذهنية المحفوظة للعمل الفعلي.
من السهل إنشاء خريطة ذهنية من ClickUp والبدء في مشاريعك وأفكارك وحتى مهامك الحالية للحصول على مخطط مرئي مثالي. لبدء العمل، قم بتنزيل قالب الخريطة الذهنية مع نوعين مختلفين من الخرائط الذهنية:
- الخريطة الذهنية لوضع المهام: قم بتخطيط أفكارك وتحويلها إلى مهام ClickUp قابلة للتتبع
- الخريطة الذهنية ذات الوضع الفارغ: أنشئ مخططات بيانية حرة لتنظيم أفكارك
اللوحات البيضاء في ClickUp
ذكرنا سابقًا أن جداول بيانات Excel ليست مثالية لورش عمل العصف الذهني الإبداعية. إذن، ما هو البديل؟ ClickUp Whiteboards!
على غرار الخرائط الذهنية، توفر ميزة اللوحات البيضاء المزيد من الوظائف مثل الرسم اليدوي الحر، وتنسيق النص المنسق، والصور، وروابط الويب لإنشاء المزيد من السياق أثناء التخطيط. تُعد اللوحات البيضاء أسرع طريقة للتعاون مع فريقك وسد الفجوة بين العصف الذهني وإنجاز العمل.
قد تكون اللوحة الفارغة والمؤشر الوامض مخيفين إذا كنت جديدًا على أدوات التعاون المرئي. تأتي ClickUp أيضًا مع قوالب لبدء جلسات العصف الذهني الخاصة بك! ابدأ مع قالب مخطط تدفق العمليات الخاص بـ ClickUp أدناه ⬇️!
إنشاء مخططات انسيابية لا تُنسى في ClickUp
تخدم جداول البيانات غرض تخزين البيانات. ومع ذلك، فأنت بحاجة إلى برنامج سهل الاستخدام لتتبع مهامك ومشاريعك المتطورة. ميزات التعاون والتخصيص في منصة ClickUp هي كل ما تحتاجه في مكان واحد.
