In the fast-paced world of research and development, staying on top of key performance indicators (KPIs) is crucial for success. With ClickUp's R&D KPI Tracking Template, you can easily monitor and analyze the effectiveness of your team's efforts.
This template empowers R&D managers and teams to:
- Track the development of new products and innovations
- Manage research project timelines and milestones
- Measure the success rate of new ideas and innovations
- Keep tabs on research and development costs
- Calculate the return on investment (ROI) for each project
With ClickUp's R&D KPI Tracking Template, you'll have all the data and insights you need to make informed decisions, optimize your R&D strategies, and drive innovation like never before. Start tracking your success today!
Benefits of R&D KPI Tracking Template
Keeping track of R&D KPIs is crucial for maximizing the effectiveness and success of your research and development activities. With the R&D KPI Tracking Template, you can:
- Measure the number of new products developed, ensuring a steady flow of innovative offerings
- Monitor research project timelines, allowing you to identify and address potential bottlenecks
- Track the percentage of successful innovations, enabling you to focus on what's working and replicate success
- Analyze research and development costs, helping you optimize resource allocation and budgeting
- Calculate return on investment (ROI), providing valuable insights into the profitability and impact of your R&D efforts
Main Elements of R&D KPI Tracking Template
Track and analyze your Research and Development (R&D) Key Performance Indicators (KPIs) with ease using ClickUp's R&D KPI Tracking Template.
This template includes the following key elements to help you stay on top of your R&D goals:
- Custom Statuses: Categorize your KPIs based on their progress with statuses like Completed, Off Track, On Track, Not Started, and At Risk, enabling you to quickly identify areas that require attention.
- Custom Fields: Utilize 7 custom fields such as Progress, Department, Target Value, Actual Value, KPI, Difference, and Variance to track and compare your KPIs' performance, ensuring that you have all the relevant data at your fingertips.
- Custom Views: Access 5 different views like the Summary View, Getting Started Guide View, Departmental OKR View, Progress View, and Timeline View to visualize your KPIs from different perspectives and gain insights into your R&D progress.
- Analytical Tools: Leverage ClickUp's built-in analytics features to monitor and evaluate your KPIs, set goals, track progress, and make data-driven decisions for your R&D initiatives.
How to Use KPIs for R&D
Tracking R&D Key Performance Indicators (KPIs) is essential for measuring the success and progress of your research and development efforts. Follow these steps to effectively use the R&D KPI Tracking Template in ClickUp:
1. Identify your R&D goals
Before you can start tracking your KPIs, you need to determine what specific goals you want to achieve through your research and development activities. Are you aiming to increase the number of new product launches? Improve the success rate of R&D projects? Increase R&D productivity? Define your goals clearly to align your tracking efforts.
Use the Goals feature in ClickUp to set and track your R&D goals.
2. Define relevant KPIs
Once you have your goals in place, identify the key performance indicators that will help you measure progress towards those goals. For example, if your goal is to increase the number of new product launches, relevant KPIs could include the number of new products in development, average time to market, and percentage of successful product launches.
Create custom fields in ClickUp to track and measure each R&D KPI.
3. Track and update data
Regularly update your R&D KPI Tracking Template with the latest data for each KPI. This could include information such as project timelines, research findings, development costs, and success rates. Make sure to track and update the data consistently to get an accurate picture of your R&D performance.
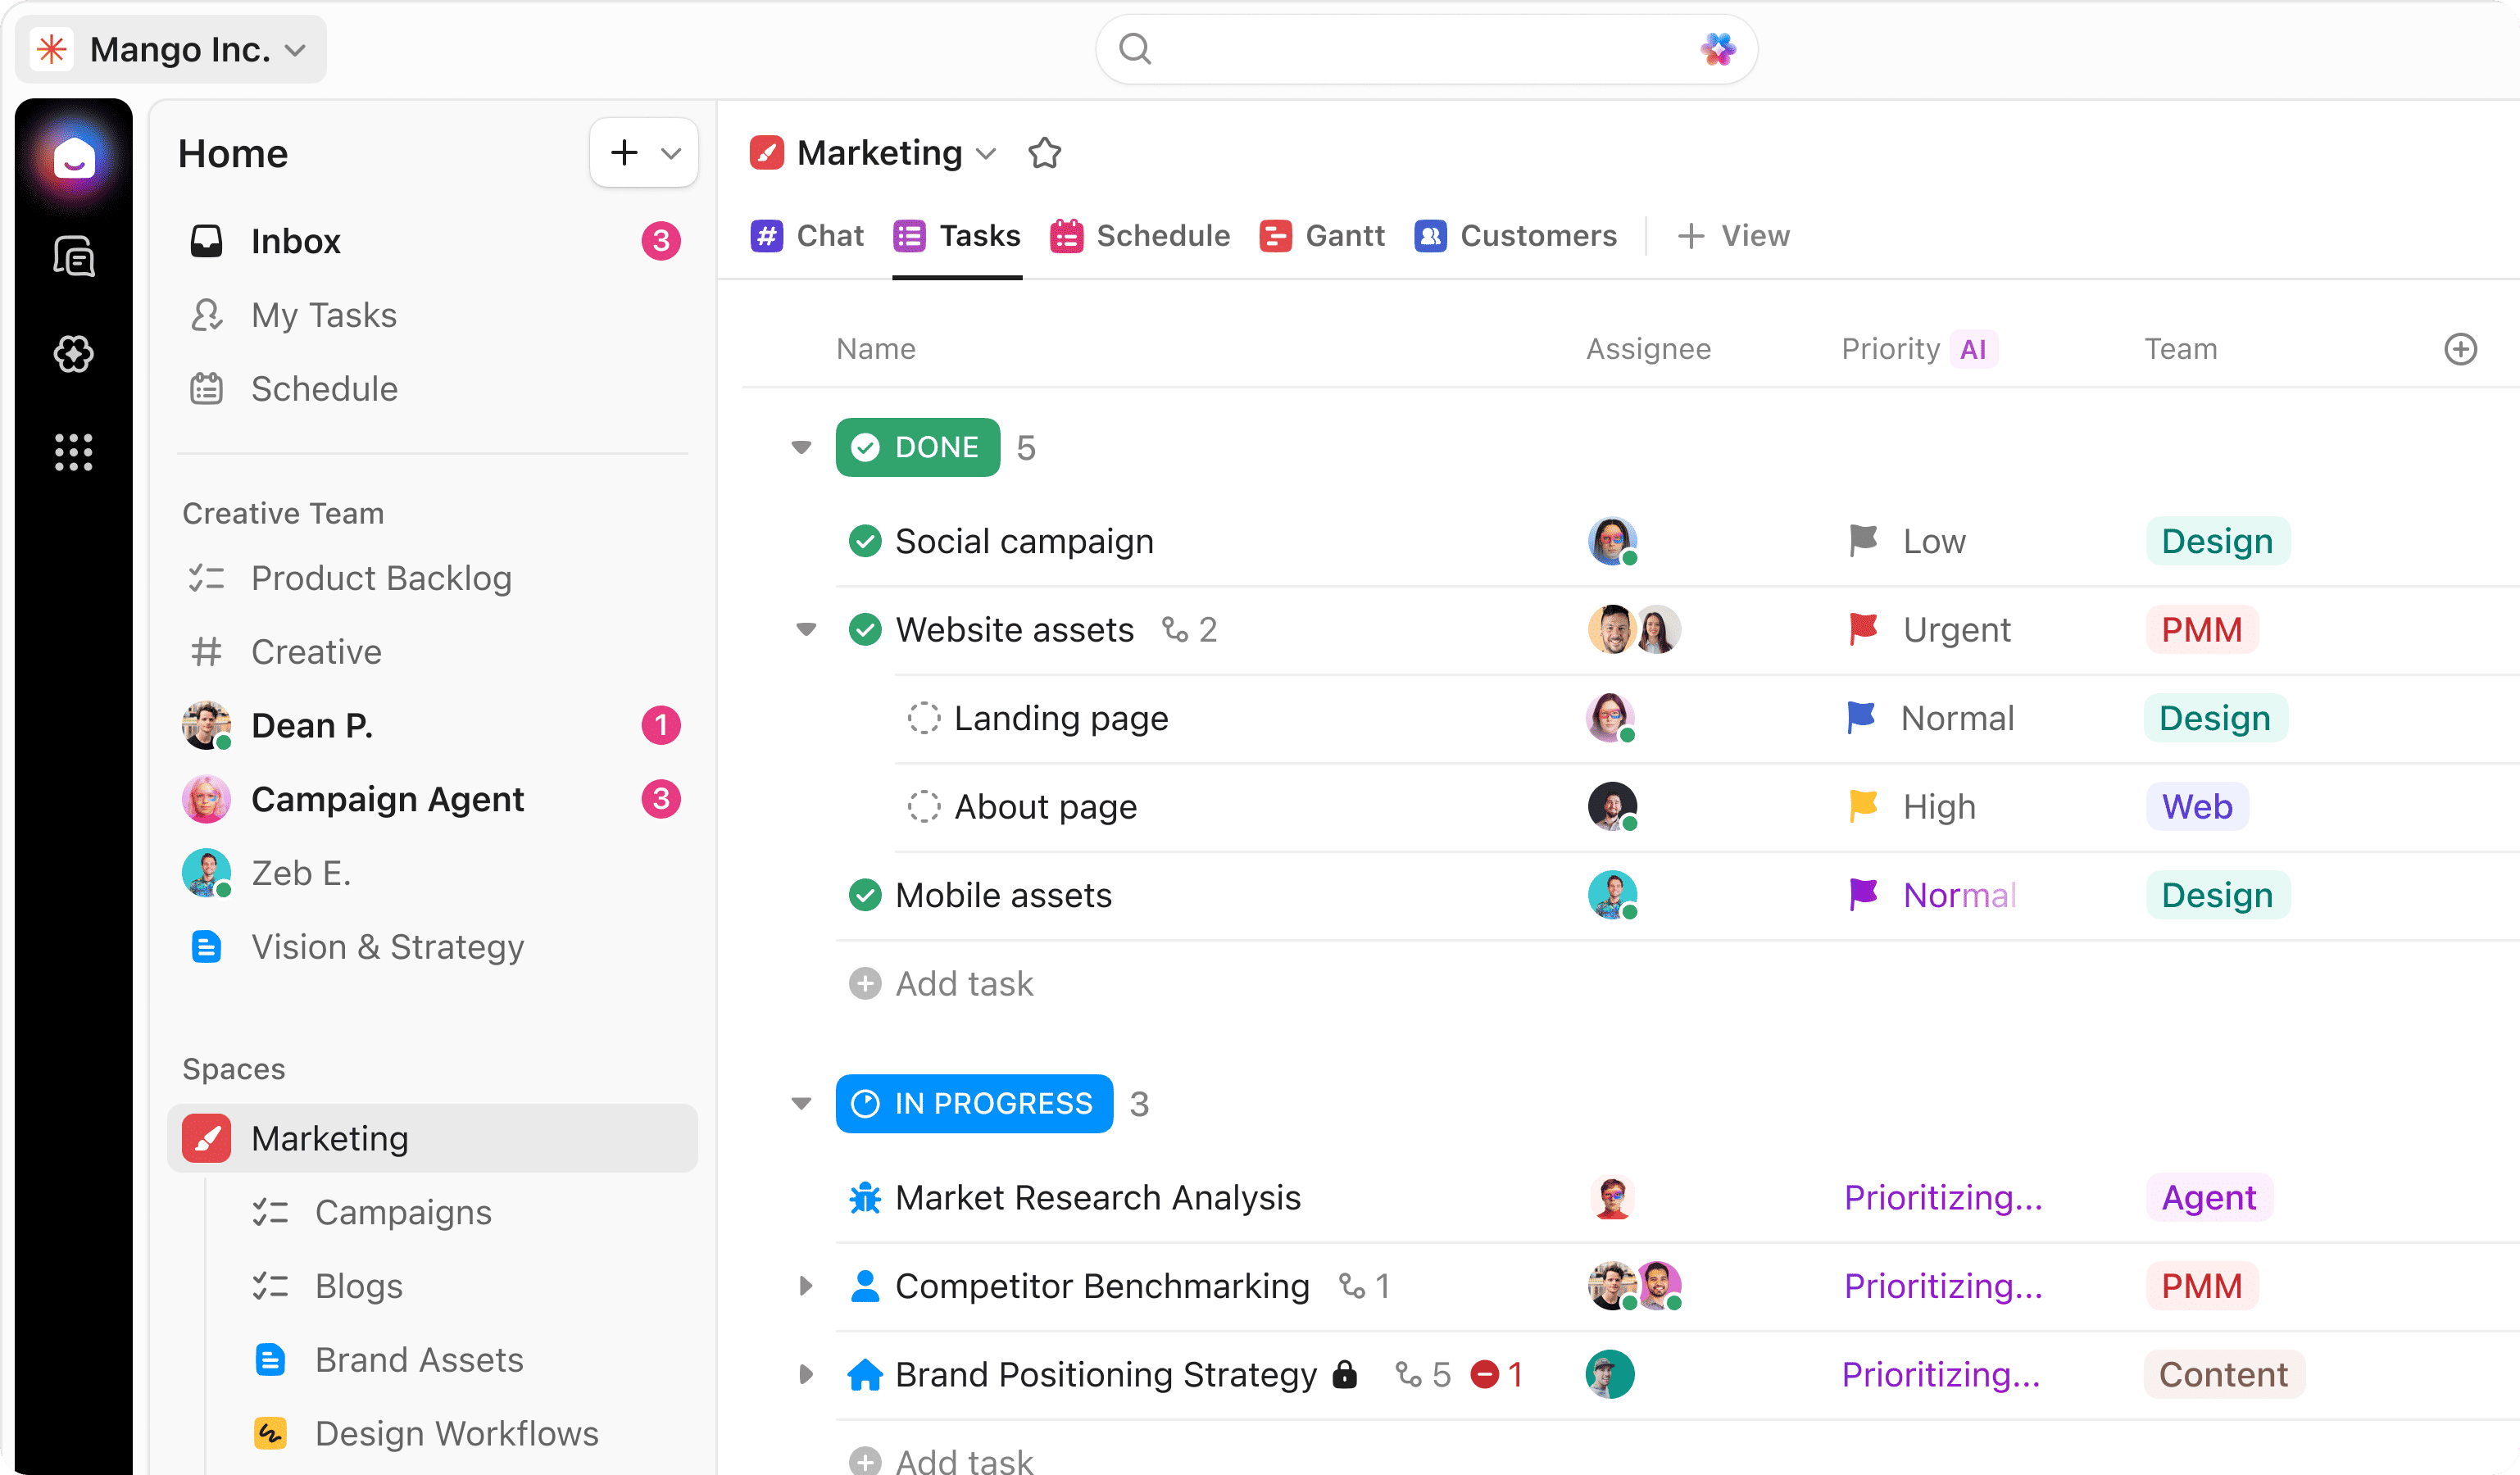
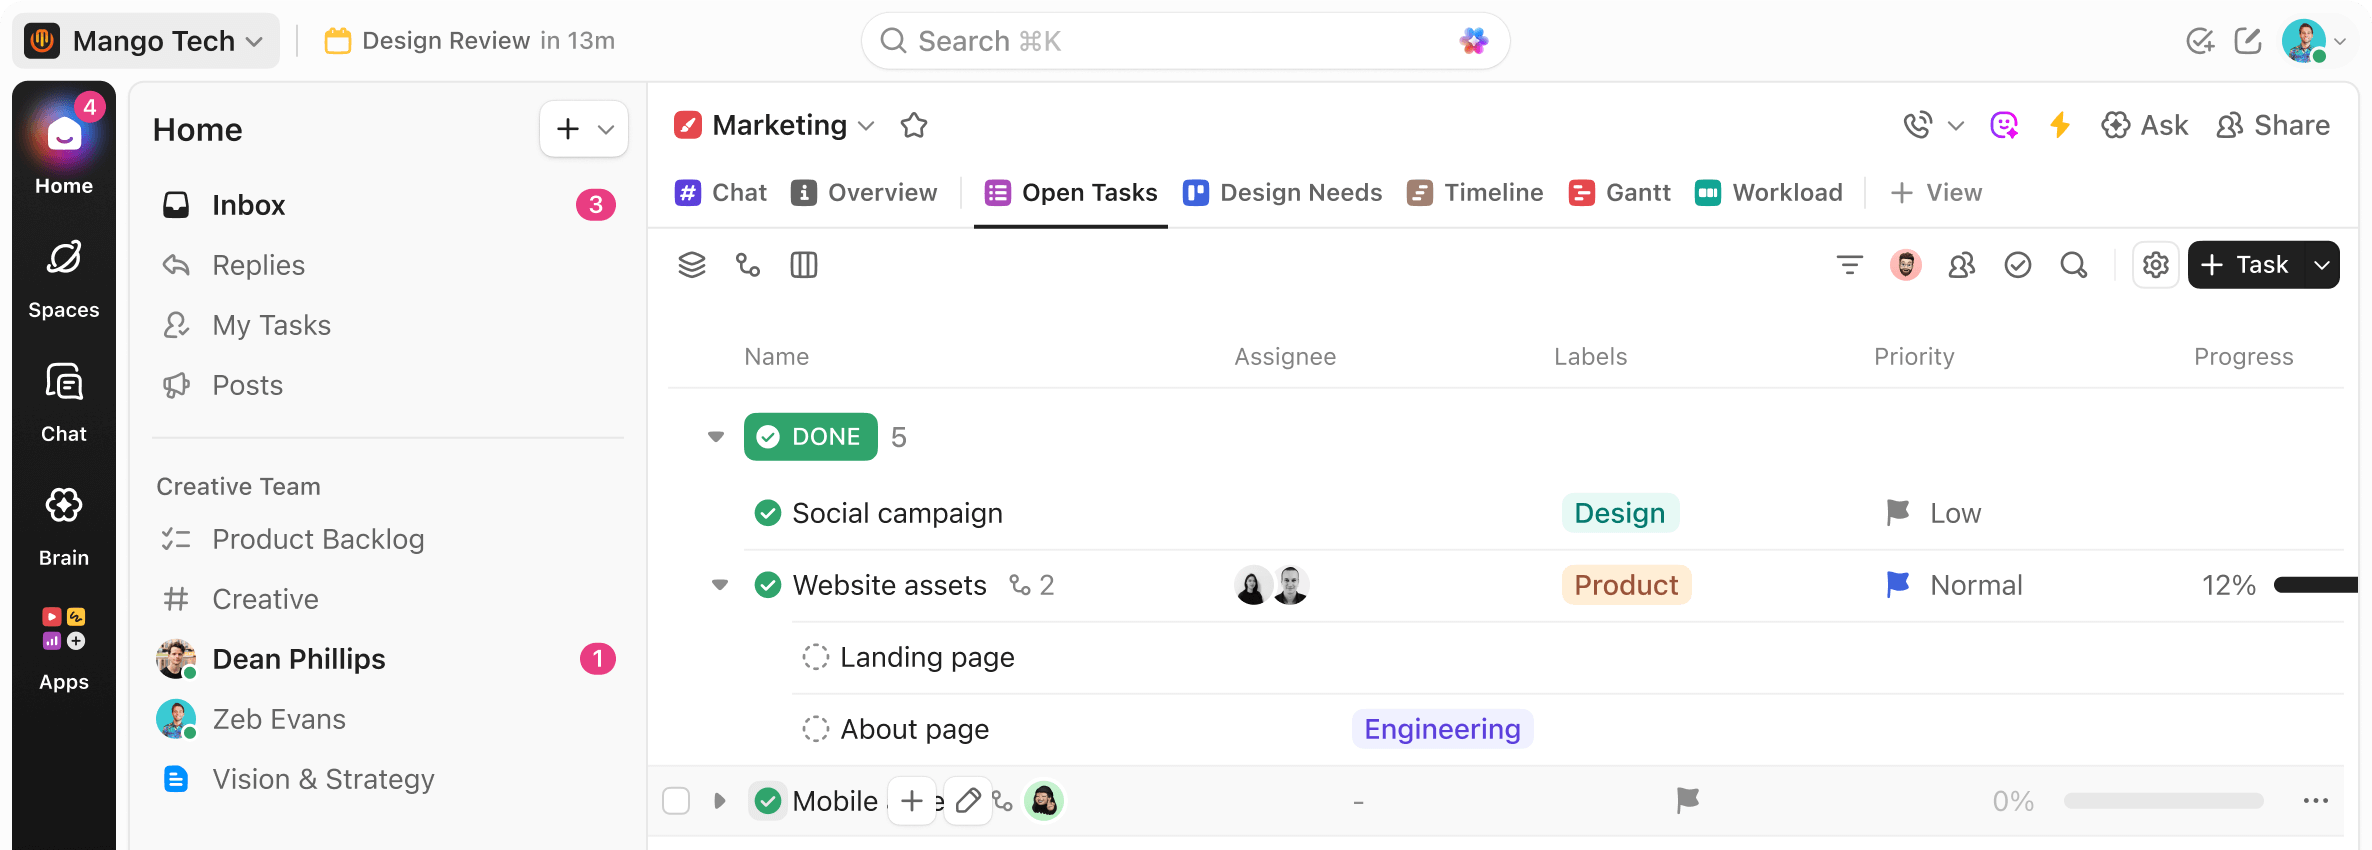
Use the Table view in ClickUp to input and update your R&D KPI data easily.
4. Analyze and optimize
Once you have collected sufficient data, analyze your R&D KPIs to gain insights into the effectiveness of your research and development efforts. Identify trends, patterns, and areas for improvement. Use this information to optimize your R&D strategies, allocate resources more efficiently, and make data-driven decisions to drive innovation and achieve your goals.
Utilize Dashboards in ClickUp to visualize and analyze your R&D KPI data for better insights and decision-making.
Get Started with ClickUp’s R&D KPI Tracking Template
R&D managers and teams can use the R&D KPI Tracking Template to efficiently monitor and analyze key performance indicators for their research and development activities.
To get started, hit “Add Template” to sign up for ClickUp and add the template to your Workspace. Make sure you designate which Space or location in your Workspace you’d like this template applied.
Next, invite relevant members or guests to your Workspace to start collaborating.
Now you can take advantage of the full potential of this template to track and improve R&D performance:
- Use the Summary View to get an overview of all your KPIs in one place
- The Getting Started Guide View will provide step-by-step instructions on how to set up and use the template effectively
- Use the Departmental OKR View to align R&D goals with the overall objectives of your department
- The Progress View will help you track the status of each KPI and identify areas that need attention
- Use the Timeline View to visualize the progress of your research projects over time
- Organize KPIs into five different statuses: Completed, Off Track, On Track, Not Started, At Risk, to keep track of progress
- Update statuses as you make progress or encounter challenges to keep stakeholders informed of the overall performance
- Monitor and analyze KPIs to optimize R&D strategies and drive innovation.