Free Guide · Executive Visibility

The CEO Dashboard Pack: 5 Views That Replace Status Meetings

How to build a real-time read on company health, delivery, and workload without the messiness.

Executive Summary


Somewhere along the path to growth, you lost the ability to see into your own company.

With 5 people, you saw everything because everybody was in the same room. By the time you add the 50th team member, the work is happening across a dozen tools and teams. At this point, no one person or tool can hold the whole picture.

This forces leaders to fall back on time-trusted rituals, such as the weekly status meeting, to make sense of what's happening. While it seems like a necessary aspect of growth, that weekly status rebuild also extracts a real tax from your forward momentum.

Because the meeting on the calendar is simply a sign. Here's the actual tax:

  • Executives spent 5.3 hours a week in unproductive meetings in 2024, up 51% from 3.5 hours in 2019
  • Every 2 minutes a knowledge worker is interrupted during core hours by a meeting, email, or ping: 275 times a day
  • Most leaders would try to fix this by tightening the recap. But the teams that get out of the cycle work upstream of it and are 2x more productive

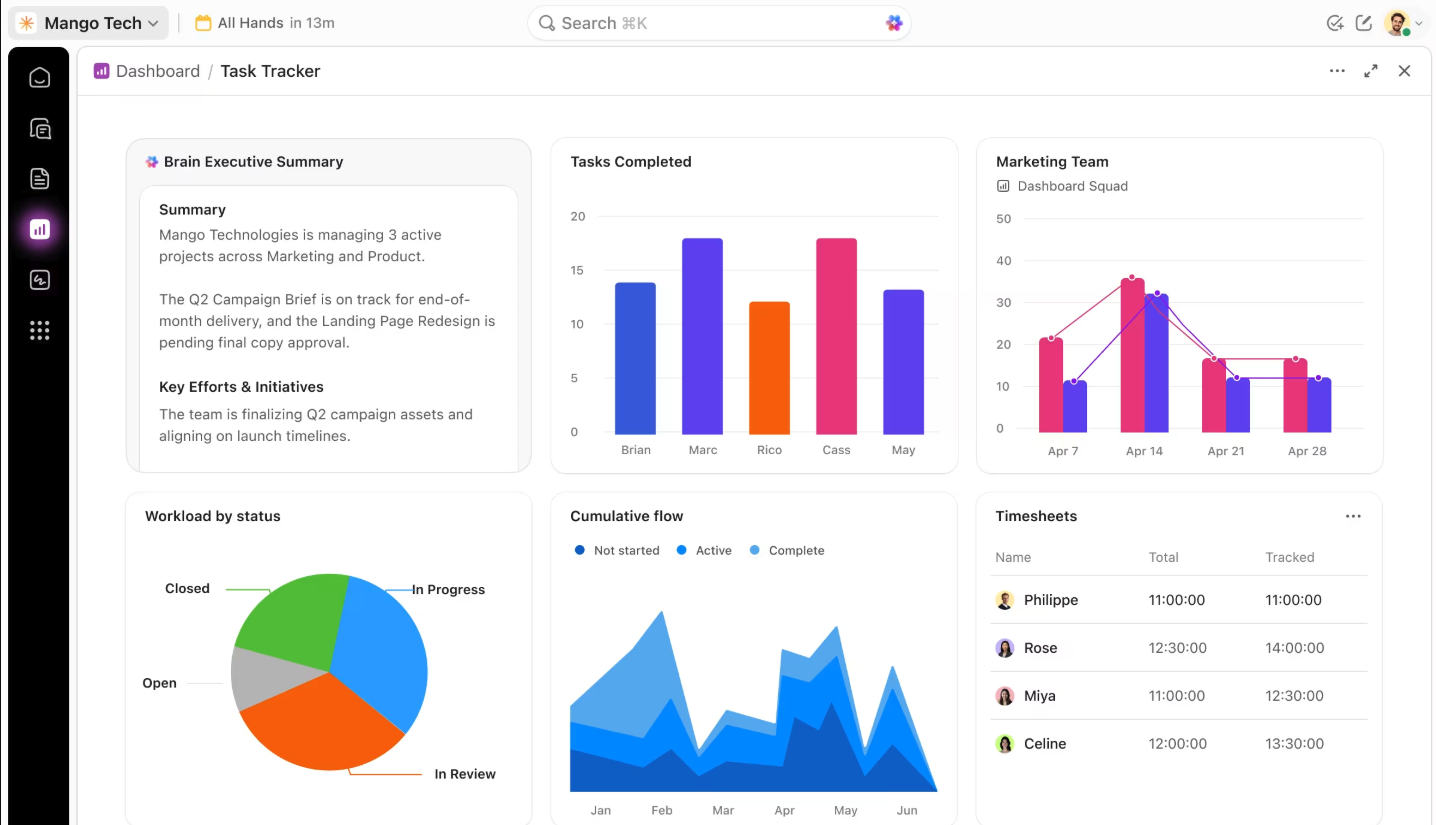
They decide what leadership should be able to see without asking, then build a small set of views that show it on demand. Five views carry most of the load. Each settles a question a CEO keeps asking out loud, and each can be read in under a minute.

P.S. The examples run on ClickUp, where this pack was assembled, but the broader moves should work across any dashboard.

hero dashboard
View 01

Company Health: Your Top-Level Operating Picture


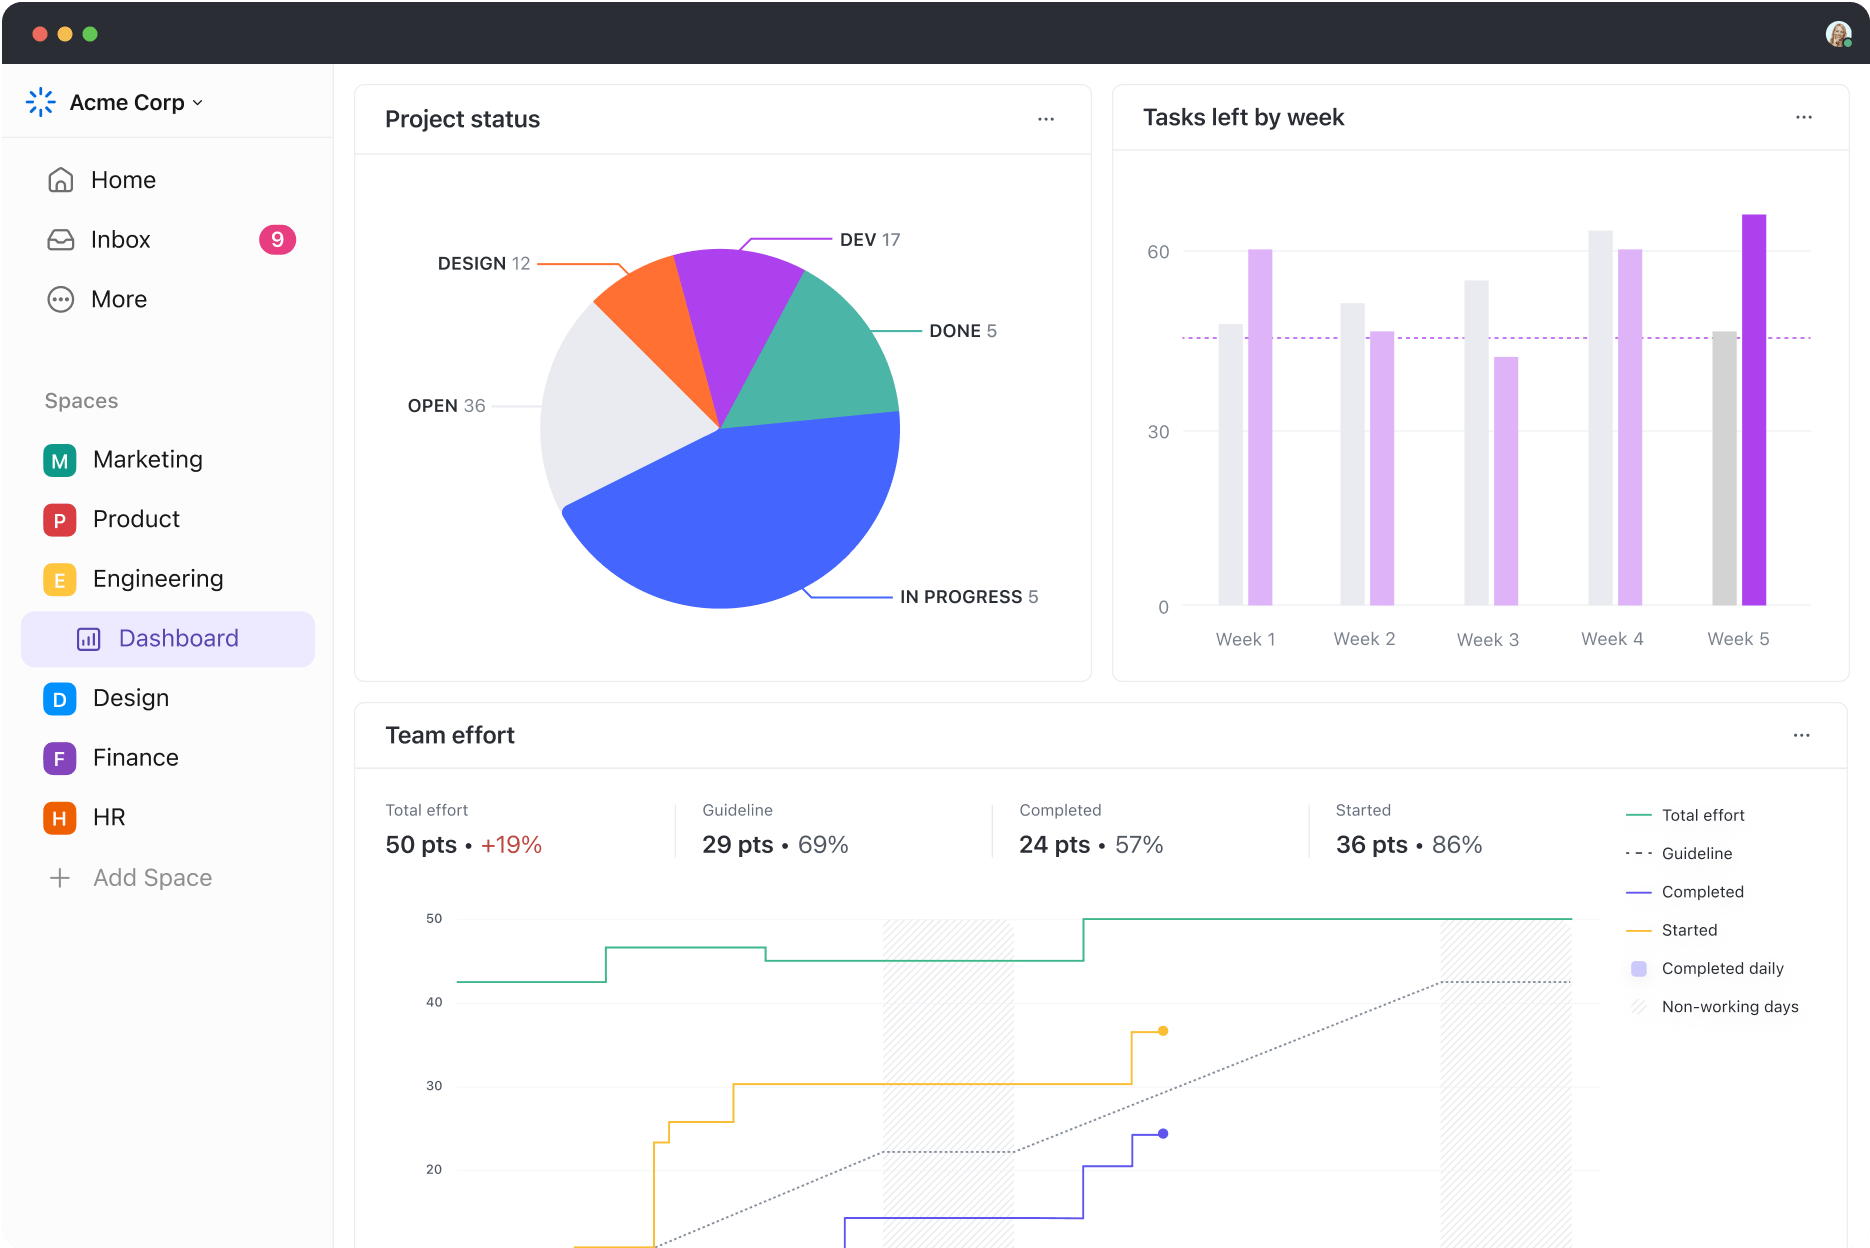
What goes into it: A short list of CEO-level signals: two or three north-star KPIs, overdue work, open blockers, workload pressure by team, and the goals that are slipping. Five or six tiles, no more.

  1. Pick the five or six signals you act on. Two or three north-star KPIs, plus overdue count, open blockers, and at-risk goals. Resist the seventh tile; every one you add costs a second of reading time
  2. Wire each tile to the source of record. A figure someone retypes every week is stale by Tuesday, and a stale health view is one nobody trusts. In ClickUp, each tile pulls from your Lists and Custom Fields; in any tool, connect the widget to the data rather than to a copied number
  3. Put the bad news top-left. Your eyes land there first, so lead with overdue, blocked, and slipping, ahead of the metrics that only ever climb
  4. Give the definitions to one owner. "Healthy" has to mean the same thing every week. Without one person keeping the definitions honest, the view drifts, and you stop relying on it

Clickup-dashboards-4.0

How Brand Right Marketing built it

Brand Right Marketing made this work by refusing a single dashboard for everyone.

Each function had its own working view: project managers saw their queue, designers theirs, developers theirs, and the president sat above it all with a single roll-up of productivity and revenue across departments. The roll-up stayed readable because the work underneath was built for it: task templates and automations kept every team logging work consistently, so the top-level view summarized cleanly rather than collecting exceptions.

"My project managers have one view, my web designers have another, my developers have another. Everyone has a view perfectly set up for them. And I can look at a bird's-eye view to see how each department is doing in terms of productivity as well as revenue. It's been really game-changing for us." — Chaya Fischman, President, Brand Right Marketing Agency

The structure underneath is the part most teams skip.

Custom Field by task type - 60% bento

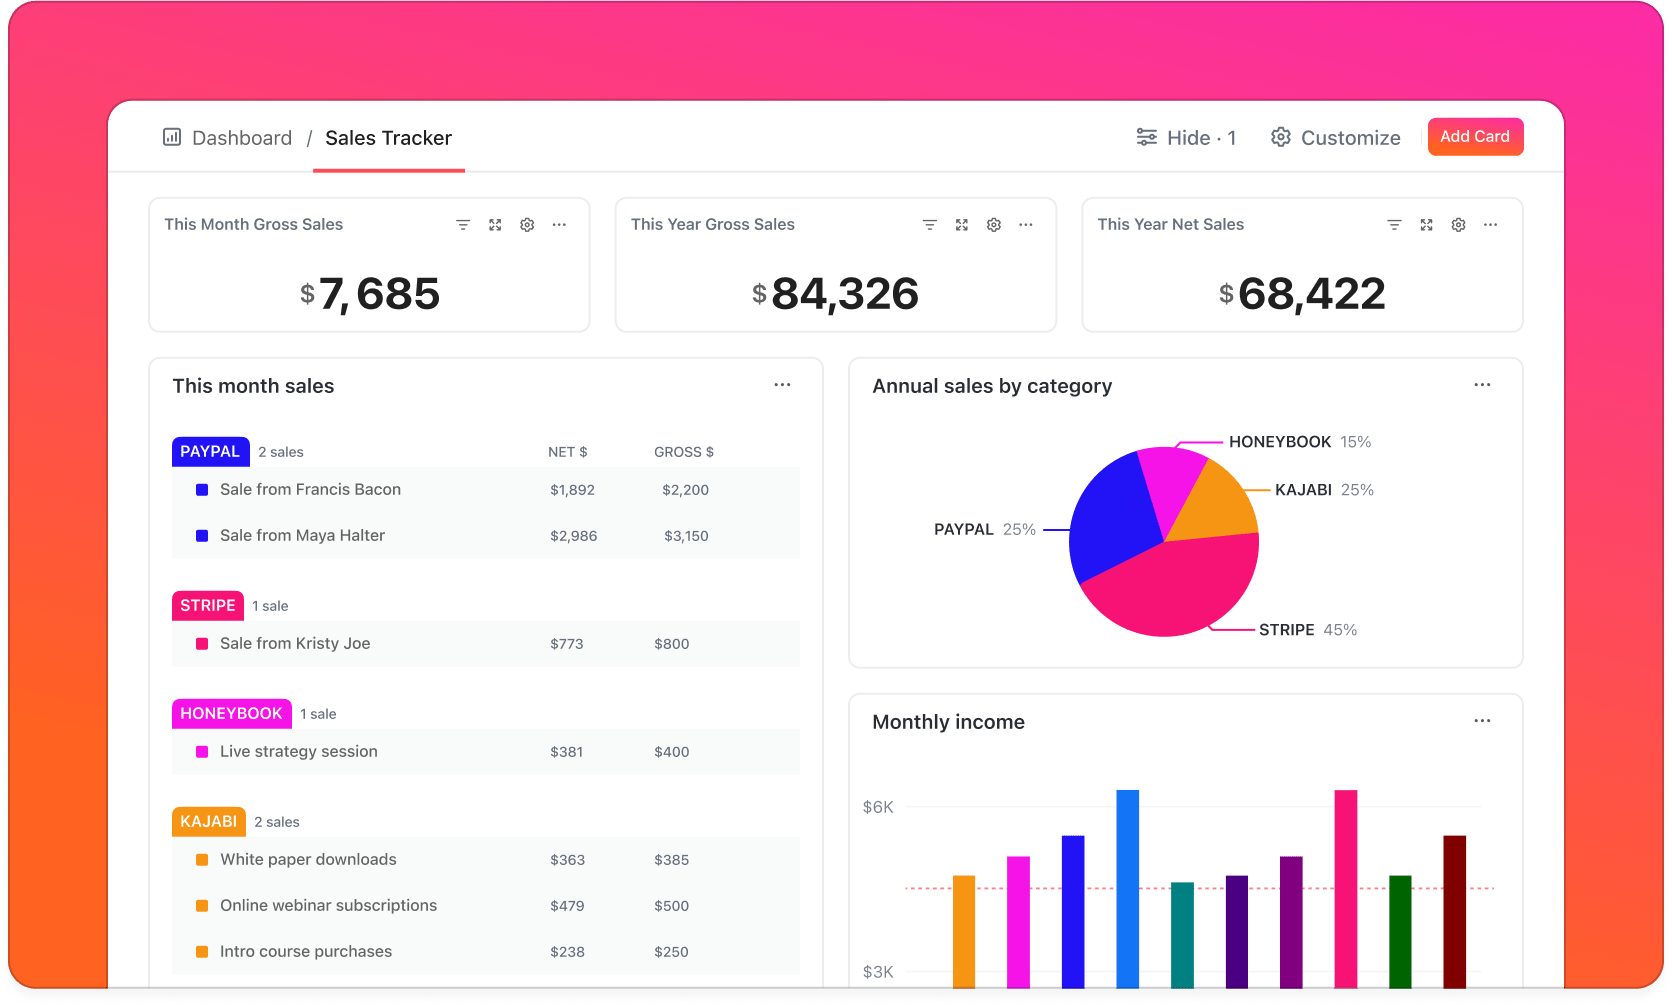
Robert Andrews, Agency Owner from Allstate, shows the same pattern from a KPI angle. The team used Custom Fields to track measurable events, then turned those signals into reports and dashboards leadership could actually use. That matters because a CEO dashboard only works when the operating data underneath it is structured well enough to summarize. Without that discipline, the dashboard becomes a prettier spreadsheet.

Grab the template + agent toolkit 👇🏼

Robert Andrews Allstate

Robert AndrewsAgency Owner, Allstate

"We're able to track different KPIs and measurable events using custom fields, then run reports and build dashboards on them. It also consolidates our to-do lists, provides time estimates, and helps ensure tasks are completed efficiently."

View 02

Delivery Risk: A Live Read on Blockers


What goes into it: Active work only, sorted into four reads: what changed this week, what's blocked, what's overdue, and what's waiting on a leadership decision. This is the view that moves your time from recap mode to decision mode.

  1. Filter hard to in-flight work. Backlog and archive don't belong here. Risk lives in what's moving right now, so cut everything that isn't
  2. Make "blocked" a real status with a reason and a named owner. Blockers buried in comment threads never reach the view; only a status field puts them where leadership sees them
  3. Add an automatic escalation. Anything blocked past a set number of days flags itself, which raises a problem without anyone calling a meeting. In ClickUp, an Automation flips the flag; in any tool, a rule or a saved filter based on the age of the action item does the same job
  4. Read it before the leadership meeting. Walk in already knowing what changed, and the meeting covers only what's flagged: a decision queue in place of a recap

Visualize-marketing-progress-and-KPIs-with-ClickUp-Dashboards

How Pharmacy Mentor eliminated daily account meetings

The Head of Client Relations at Pharmacy Mentor replaced a recurring meeting by building a view around the exact questions the team used to meet about: how many clients sit with each account executive, what's coming up, and where each client is in its journey. Because the dashboard mirrored the conversation the team was already having out loud, it no longer needed a slot on the calendar. They cut daily account meetings entirely and became twice as productive.

Grab the template + agent toolkit 👇🏼

Michael_Turner_Miami_U.jpeg

Lewis NorwoodHead of Client Relations, Pharmacy Mentor

"Before ClickUp, checking a client project's status was time-consuming—work got duplicated and update meetings were constant. I built a dashboard to track clients per account executive, upcoming projects, and journey stage at a glance. We eliminated daily account meetings entirely and became 2x more productive."

View 03

Capacity & Workload: Load Across Owners, Teams, and Stages


What goes into it: Workload made visible across owners, functions, and delivery stages: who's overloaded, what's piling up, and where to add support or cut scope.

  1. Pick one unit of load and use it everywhere. Open tasks, estimated hours, or active projects per owner. Mixing units makes the view impossible to read
  2. Group it by person to catch the individual about to burn out, and by function to catch the team that's turned into the bottleneck. The two groupings answer different questions, and you need both
  3. Set a threshold that turns red. Decide the line and let the view flip an owner to red when they cross it, so overload shows rather than hides
  4. Read it next to the delivery-risk view. Red capacity alongside rising blockers is your headcount-or-scope conversation, now backed by signal

How Plus972 monitors capacity across three dev teams

Plus972 hit this wall at more than 30 concurrent client projects, where a buried team can turn a missed deadline into a fast one. They had been on Monday.com, which showed surface-level status but couldn't maintain that operational depth. After a six-month evaluation, they rebuilt capacity tracking in ClickUp: a shared Workload view watching load across three development teams, with blockers surfaced before they hardened into delays.

WorkloadView

Grab the template + agent toolkit 👇🏼

Kateryna Brik

Kateryna BrikSenior Project Manager, Plus972

ClickUp’s Dashboards changed how we run day-to-day agency operations. We monitor capacity across three dev teams and surface blockers before they become delays, so we spend less time chasing status in Slack threads and more time actually moving client work forward.

View 04

Goals & Initiatives: Targets and Trajectory for the Quarter


What goes into it: The handful of goals and initiatives that belong in a board meeting, each with its target, its current number, and a trajectory call: on track, at risk, or off track.

  1. List only the bets a CEO is judged on. 5 or 6 tiles. 30 rows turn a strategy view back into a task list
  2. Show target versus current, plus a trajectory call. Mark each on track, at risk, or off track. The trajectory is what warns you early; a raw number only confirms the miss after it lands
  3. Link each goal to the work driving it. Then "at risk" connects straight to the blocked tasks underneath, which is where this view hands off to delivery risk, and a red status becomes something you can act on. In ClickUp, Tasks and sub-tasks are the trackable elements that roll up progress automatically
  4. Review it on a slower clock than the rest. Weekly or biweekly. This is the "are we winning the quarter" view, and checking it hourly only adds noise

sales overviews dashboards-2

How Pharmacy Mentor tied departmental goals to company targets

Case in point, Pharmacy Mentor runs its goals the same way it runs delivery. Every department: Client Relations, Web, Development, Marketing, Finance, HR, sets and tracks its own goals in one place. Each one is tied to the company goals they feed. With targets and contributions visible in the same system, the repeated "where are we against plan?" disappeared; the answer is always a click away.

Grab the template + agent toolkit 👇🏼

Michael_Turner_Miami_U.jpeg

Lewis NorwoodHead of Client Relations, Pharmacy Mentor

“Now that we have ClickUp, we’re not doing the same thing over and over, and we’re not confused about who’s responsible for which project. We can see who’s leading it, break it down into sub-tasks, and everyone can see their responsibilities.”

View 05

The Decision Queue: One List of Open Leadership Decisions


What goes into it: One filtered list: everything tagged "needs a leadership decision," from every team, each item carrying its own context: the brief, the blocker, the options, the owner.

  1. Create one cross-team filter on a single tag. Call it "needs leadership decision." Anyone can add to it; only you can clear it
  2. Make each item self-contained. The context and associated details travel with the task: what's blocked, what the options are, who owns the follow-through. In ClickUp, attach Docs, briefs, and comments directly to the task so nothing lives in a side channel
  3. Sort by cost of delay. The expensive calls go first; the cosmetic ones wait. Date order treats a pricing decision and a logo tweak as equals
  4. Clear it on a fixed rhythm. An empty queue is the target. A growing one is itself a signal, usually that a decision right is unclear and worth fixing at the source

ai insights dashboards

How one CEO drops into any project cold

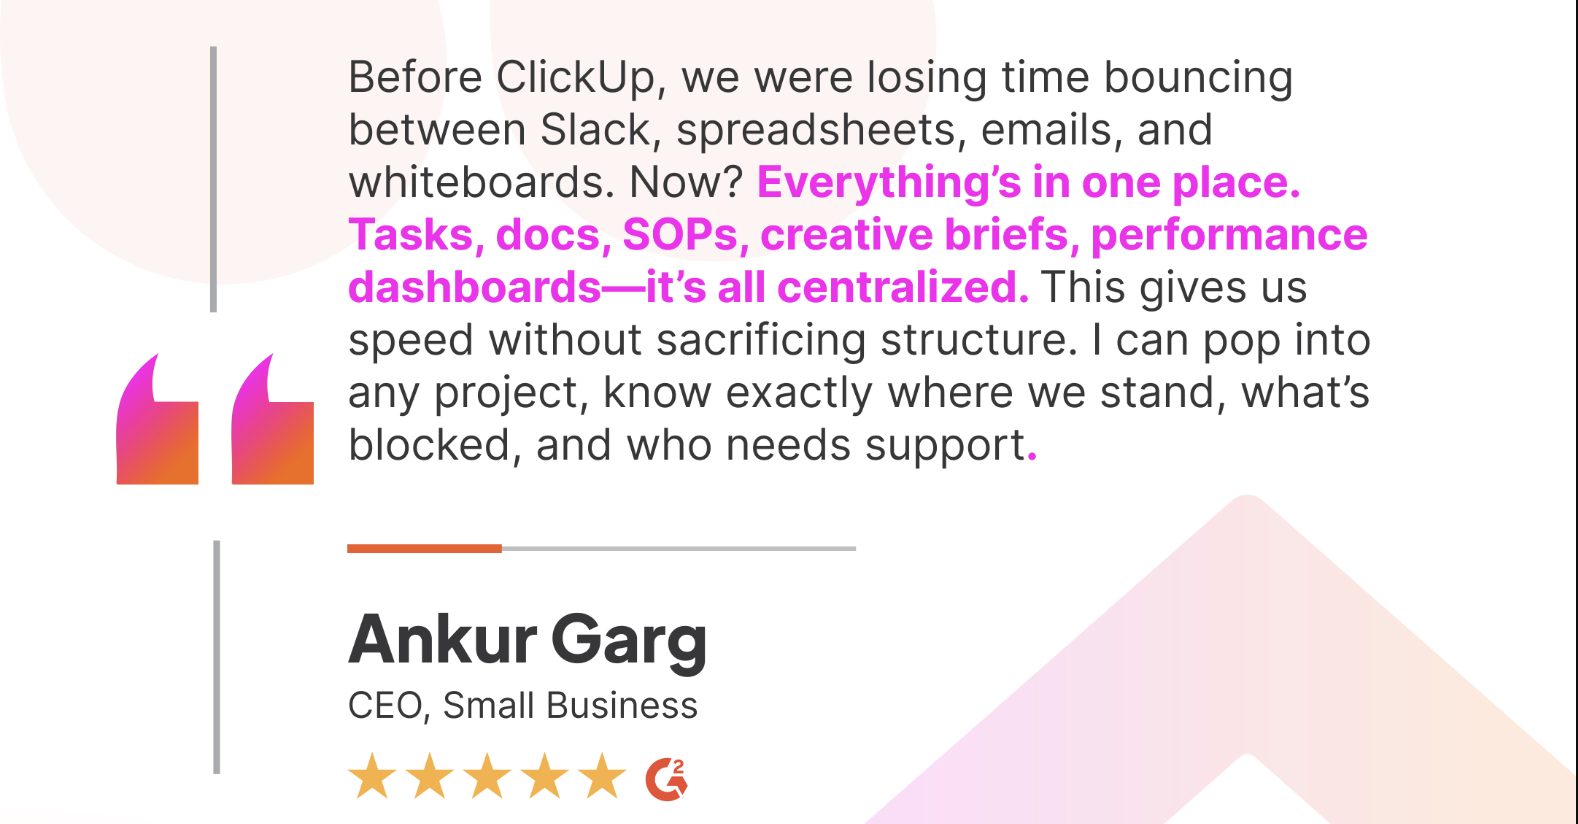
This is what Ankur Garg means about being able to jump into any project with zero context hunting. His team pulled tasks, Docs, SOPs, creative briefs, and dashboards into one place, so any details he needs to make a decision arrives with the work; he can open a project and read where it stands without having to ask around for missing pieces.

Ankur Garg

Grab the template + agent toolkit 👇🏼

Next Steps

What CEOs Get Back When Visibility Is Built-in


⚡ 25 billion work hours a year disappear into ineffective collaboration across the Fortune 500, and 93% of executives say their teams could do the same work in half the time.

A working visibility layer spreads on its own. At Neterra, the deputy CTO's team rolled out one operations workspace; several other C-level managers adopted it in their departments once they saw the clearer task structure and the drop in unnecessary meetings and emails.

Leaders move to a system when they trust what it tells them. Here is what real teams got back:

  • Daily account meetings eliminated. Pharmacy Mentor built a dashboard around account executives, upcoming projects, and client journey stages. The meeting became redundant
  • 2x productivity. Pharmacy Mentor reduced duplicated work and moved status checking into a live view instead of daily recaps
  • Less chasing in Slack. Plus972 used dashboards to monitor capacity across three dev teams and surface blockers before they became threads
  • Bird's-eye leadership visibility. Brand Right gave each team its own working view and leadership a broader roll-up across productivity and revenue
  • Instant project understanding. Ankur Garg centralized tasks, docs, SOPs, briefs, and dashboards so any leader can drop into a project cold and read it in seconds

Not sure where to start?

Every company's visibility gaps are different. If none of these map cleanly, book a 15-minute working session with our team. We'll audit your current setup, identify the highest-leverage view to build first, and map out a phased rollout.

Sources

[1] Asana: 2024 State of Work Innovation (5.3 hours/week in unproductive meetings, up 51% from 2019)

[2] Microsoft Work Trend Index: Breaking Down the Infinite Workday (interrupted every 2 minutes; 275 times a day)

[3] Atlassian: State of Teams 2024 (25B work hours lost; 93% say teams could deliver in half the time)

[4] Customer stories: Brand Right Marketing, Allstate, Pharmacy Mentor, Plus972, Neterra, and CEO/founder reviewers via ClickUp customer stories and public G2 reviews.

Trusted by the best