In 2005, the FBI killed its Virtual Case File system after burning through roughly $170 million. For months, the status reports stayed green and the schedule looked on track, right up until the project was scrapped as a total loss.
The numbers were never the problem. The team was measuring activity, not the signals that predict failure.
That gap gets expensive at scale. The Project Management Institute finds 11.4% of every dollar invested in projects is wasted on poor performance. The teams that do well don’t track more numbers, they track the right three to five with enough discipline to act the moment one moves.
This guide breaks down 20 project management KPIs by category, shows you which to skip and when, and gives you the action thresholds that turn each metric into a decision.
Summarize this article with AI ClickUp Brain not only saves you precious time by instantly summarizing articles, it also leverages AI to connect your tasks, docs, people, and more, streamlining your workflow like never before.
Summarize this article for me please
TL;DR
Tracking KPIs that nobody uses to make decisions slows down team and project performance. Plus, you don’t want to track metrics after problems become visible. Instead, track the signals that predict delays, budget overruns, burnout, or rework early enough to respond.
Schedule KPIs (SV, SPI, on-time completion, cycle time): Catch slippage while you can still re-sequence
Cost KPIs (BAC, CV, CPI, EAC): Built on earned value; EAC answers “will we finish within budget?”
Quality & Stakeholder KPIs (defect rate, rework %, CSAT, scope creep): Expose upstream planning gaps before they compound
Effectiveness & ROI KPIs (ROI, NPS, planned vs. actual, gross margin): Prove whether the work was worth doing
Resource KPIs (utilization, billable %, planned vs. actual hours, allocation balance): Flag burnout and misallocation early
Emerging KPIs for AI-powered and hybrid teams: Decision latency, automation adoption, async collaboration health
Pick 3-5, pair one leading indicator with one lagging, and tie each to an owner and an action threshold. Track fewer numbers and track them well, so your KPIs stop being a dashboard and start being a decision.
Summarize this article with AI ClickUp Brain not only saves you precious time by instantly summarizing articles, it also leverages AI to connect your tasks, docs, people, and more, streamlining your workflow like never before.
Summarize this article for me please
What Are Project Management KPIs?
A project management KPI is a quantifiable metric tied to a specific project objective, like schedule, cost, quality, or resource use. The simplest way to think about it:
KPI = What you measure + why it matters + the target you’re aiming for
For example: Cut average client sign-off time (what) to keep delivery on schedule (why) from 9 days to 4 days by end of Q3 (target). Without all three parts, you have a number, not a KPI. It tells project managers, PMO directors, and team leads whether the project is healthy or drifting, with evidence instead of gut feel.
Strong KPIs are:
Tied to a project objective
Measurable against a baseline
Actionable, with a threshold that triggers a decision
Did You Know? Most schedule and cost KPIs sit on top of the earned value management (EVM) framework. It compares three values: planned value (PV), earned value (EV), and actual cost (AC). These help assess whether a project is ahead, behind, over, or under budget at any point in time.
KPI vs. metrics: How are they different?
Every KPI is a metric, but most metrics aren’t KPIs. A metric is any data point you can track. A KPI is the handful tied to an objective and a decision.
Aspect
Metric
KPI
Focus
Any measurable data point
A metric tied to a specific objective
Intent
Tracks activity
Tracks progress toward a goal
Impact
Informational
Triggers a decision when it moves
Example
Hours logged this sprint
CPI held below 1.0 for two cycles
How do KPIs differ from OKRs?
KPIs and OKRs answer different questions. A KPI measures the ongoing health of work already underway: Is cost performance holding steady? An OKR sets an ambitious goal you’re reaching for: Ship the new onboarding flow and lift activation 20% this quarter.
A KPI like CPI tells you whether you’re on budget right now; an OKR defines what winning looks like next quarter. Project managers lean on KPIs for control and course-correction, and on OKRs for direction. They’re complementary, not interchangeable.
Find Your “One Metric That Matters”
The instinct is to track everything you can. Resist it. Borrow a page from Lean Analytics and pick a single One Metric That Matters (OMTM) for the phase you’re in right now. Authors Alistair Croll and Ben Yoskovitz argue your OMTM is usually the metric that’s most broken: sprint velocity during a development crunch, client sign-off cycle time during delivery. Concentrate the team on that one number and behavior actually changes. Fix it, and the bottleneck moves, so your OMTM moves with it. The other KPIs in this guide don’t disappear. They sit in the background as context. But at any given moment, one number deserves the team’s attention, and naming it is what keeps a dashboard from becoming wallpaper.
Summarize this article with AI ClickUp Brain not only saves you precious time by instantly summarizing articles, it also leverages AI to connect your tasks, docs, people, and more, streamlining your workflow like never before.
Summarize this article for me please
How to Choose the Right KPIs for Your Project
Choosing KPIs is about matching the metric to the project’s risk profile and method. You have to agree on two decisions. First, are you tracking leading or lagging indicators, and second, which project constraint are you most worried about?
1. Leading KPIs vs. lagging KPIs
Leading KPIs predict future performance while lagging KPIs confirm past results. Here’s a quick breakdown:
Aspect
Leading KPIs
Lagging KPIs
Definition
Forward-looking metrics that signal where performance is heading
Backward-looking metrics that confirm what already happened
When useful
During execution, when you can still course-correct
At phase gates, retrospectives, and post-project reviews
Risk if ignored
Problems compound silently until a lagging KPI finally turns red
Teams repeat the same mistakes because they never analyzed outcomes
Leading KPIs vs Lagging KPIs
Most teams over-index on lagging KPIs because they’re easier to measure. But by the time a lagging KPI turns red, the damage is done. McKinsey finds large projects routinely see overruns of 30% to 45% on cost or schedule.
2. KPI selection by project goal and methodology
KPI selection should start with the project’s primary constraint. The project type determines which metrics matter:
Fixed-budget projects: Cost Performance Index (CPI), Budget at Completion (BAC), Estimate at Completion (EAC)
Time-critical launches: Schedule Performance Index (SPI) and Schedule Variance (SV), cycle time
Resource-constrained teams:Resource utilization rate, planned vs. actual hours, capacity allocation
Pick three to five KPIs per project. You also must ensure that each KPI triggers a specific action when it crosses a threshold. If nobody would change behavior based on the KPI, drop it.
Summarize this article with AI ClickUp Brain not only saves you precious time by instantly summarizing articles, it also leverages AI to connect your tasks, docs, people, and more, streamlining your workflow like never before.
Summarize this article for me please
20 Project Management KPIs Every Team Should Track
Below are 20 project management KPI examples grouped into five categories that map to the classic project constraints: time, cost, quality, value, and resources.
Keep each entry as a reference.
Schedule and timeliness KPIs
1. Schedule Variance (SV)
Measures how far ahead or behind the project is in dollar terms
A negative SV means the team has completed less work than planned for the time elapsed
Formula: SV = EV – PV
Indicator: Leading
When to skip this KPI: Projects with rapidly shifting priorities or rolling delivery plans where baseline schedules become outdated within days
2. Schedule Performance Index (SPI)
Expresses schedule performance as a ratio
Values below 1.0 mean the project is delivering less work than planned; above 1.0 means it’s ahead
SPI is more useful than SV for comparing projects of different sizes
Formula: SPI = EV / PV
Indicator: Leading
When to skip this KPI: Small operational projects where delivery speed matters more than earned value precision
3. On-time completion rate
Percentage of tasks or milestones delivered by their baseline due date
Simple but effective for stakeholder reporting and easy to calculate without earned value data
Indicator: Lagging
Benchmark: PMI found that 48% of projects are not completed on time.
When to skip this KPI: Teams that trade deadlines for experimentation, innovation, or iterative feedback cycles
4. Cycle time
Average duration from task start to task completion
Critical for agile teams and any workflow where throughput matters more than milestone dates
Shortening cycle time often has a bigger impact on delivery speed than adding headcount
Indicator: Leading
When to skip this KPI: Projects with long approval chains or external dependencies that slow down actual execution speed
Budget and cost KPIs
5. Budget at Completion (BAC)
Total approved budget for the entire project
Every other cost KPI references this number, so it must be locked at the baseline
Indicator: Baseline
When to skip this KPI: Discovery-phase initiatives where funding changes based on findings rather than fixed scope estimates
6. Cost Variance (CV)
Shows whether the project is under or over budget right now
Positive means under budget; negative means overspending
Formula: CV = EV – AC
Indicator: Leading
When to skip this KPI: Projects with delayed vendor billing or quarterly accounting cycles that hide real-time spending patterns
7. Cost Performance Index (CPI)
Measures how much value each dollar is producing
Below 1.0 signals the project is getting less value per dollar than planned
Formula: CPI = EV / AC
Indicator: Leading
Benchmark: A CPI of 1.0 means the project is earning exactly the value planned per dollar spent. Above 1.0 is under budget; below 1.0 is overspending.
When to skip this KPI: Creative, R&D, or innovation projects where value creation can’t be tied cleanly to current spending
Did You Know? According to Quentin Fleming and Joel Koppelman’s Earned Value Project Management, CPI rarely improves by more than 10% once a project is 20% complete, making early detection essential.
8. Estimate at Completion (EAC)
Projects the total cost based on current performance
The single most useful number for answering “will we finish within budget?”
Formula: EAC = BAC / CPI
Indicator: Leading
When to skip this KPI: Projects undergoing major scope revisions, since historical performance no longer predicts future cost accurately
The four KPIs in this section form a chain: BAC (Budget at Completion) sets the target, CV (Cost Variance) and CPI (Cost Performance Index) measure current performance, and Estimate at Completion (EAC) projects the outcome.
Denver International Airport’s automated baggage system is the cautionary tale every project manager should know. Through development, status reports tracked component-level progress, motors installed, code modules “complete,” milestones hit. The dashboards looked healthy. The integrated system, meanwhile, was shredding luggage in testing.
The airport opened 16 months late and roughly $560M over budget, with the baggage system itself running about $186M before it was scrapped.
This is Goodhart’s Law in action: when a measure becomes a target, it stops being a good measure. The team optimized for “tasks marked done” instead of “system that works,” and got exactly what they measured. PMs call the result a watermelon project: green on the outside, red in the middle, right up until it isn’t.
The fix isn’t more metrics. It’s pairing every KPI with a counter-metric that catches the gaming: Tracking velocity? Also track defect escape rate. Tracking tasks completed? Also track rework percentage. Tracking on-time milestones? Also track scope creep. If a number can be moved without the underlying work actually improving, it’s a target waiting to be gamed. Pair it, or drop it.
Quality and stakeholder KPIs
9. Defect rate
Number of defects or errors per deliverable, or per sprint
High defect rates often correlate with rushed timelines or unclear requirements, making this KPI a useful cross-check on schedule pressure
Indicator: Leading
When to skip this KPI: Internal strategy or research projects where outcomes aren’t measured through deliverable quality checks
10. Rework percentage
Proportion of completed work that requires correction
A lagging indicator of quality problems upstream
If rework consistently exceeds 4-10% of total effort, the root cause often traces back to planning or requirements gaps rather than execution failures
Indicator: Lagging
When to skip this KPI: Agile product teams that intentionally use iteration and refinement as part of the development process
11. Customer Satisfaction Score (CSAT)
Direct feedback from the client or end user, typically on a one-to-five scale
The only KPI that measures whether the deliverable actually met expectations
Indicator: Lagging
Benchmark: Although benchmarks vary by sector, on average, a good CSAT score falls between 75–85% for most industries. The US national average is 77–78% according to the ACSI
When to skip this KPI: Infrastructure or backend projects where end users rarely interact directly with the delivered work
12. Scope creep percentage
Amount of unapproved work added beyond the original baseline, expressed as a percentage of total planned scope
Rising scope creep without corresponding budget or timeline adjustments is the most common silent project killer
Indicator: Leading
When to skip this KPI: Retainer-based or continuous delivery engagements where evolving scope is already built into the operating model
Effectiveness and ROI KPIs
13. Return on Investment (ROI)
It’s the ultimate lagging KPI, answering whether the project was worth doing
Calculating ROI is useful at the portfolio level for prioritizing future investments
Formula: ROI = Net Project Benefits / Total Project Cost
Indicator: Lagging
When to skip this KPI: Compliance, security, or risk-reduction projects where the value comes from preventing losses rather than generating revenue
14. Net Promoter Score (NPS)
Measures whether stakeholders or internal sponsors would recommend the project process or outcome
Useful for PMOs benchmarking delivery quality across a portfolio of programs
Formula: NPS = %Promoters – %Detractors
Indicator: Lagging
When to skip this KPI: One-time internal projects with too few stakeholders to generate statistically meaningful feedback trends
15. Planned vs. actual completion
Ratio of projects or phases completed on time and within budget vs. total projects
A portfolio-level effectiveness measure that reveals systemic patterns in estimation accuracy
Indicator: Lagging
When to skip this KPI: Portfolios combining highly different project types, where comparisons create misleading conclusions about performance
16. Gross profit margin
Revenue generated by the project minus direct costs, divided by revenue
Relevant for agencies, consultancies, and any client-facing work where project profitability is the bottom line
Formula: Gross Profit Margin = (Gross Profit / Total Revenue) X 100
Indicator: Lagging
When to skip this KPI: Nonprofit, government, or internal transformation projects where profitability isn’t the success metric
Resource management KPIs
17. Resource utilization rate
Percentage of total available hours spent on productive project work
Formula: Resource Utilization Rate = (Actual Time Worked / Total Available Time) × 100
Indicator: Leading
When to skip this KPI: Teams focused on deep creative, strategic, or innovation work where constant utilization reduces output quality
18. Billable utilization rate
A subset of utilization: hours billed to clients vs. total available hours
The core profitability metric for services firms, and the number most directly tied to revenue per person
Indicator: Leading
Benchmark: Benchmark billable utilization rate stood at 69% in the last report from Kantata
When to skip this KPI: Product-led or subscription businesses where revenue isn’t tied directly to employee billable hours
19. Planned vs. actual hours
Compares the task estimation for effort per phase against actual effort logged
Persistent gaps reveal estimation problems that compound across future projects
Indicator: Lagging
When to skip this KPI: Fast-moving startup teams where work changes too quickly for detailed effort estimates to stay relevant
20. Resource allocation balance
Whether team members are overloaded or underused relative to project capacity
It doesn’t have a single formula, so it’s typically visualized as a heatmap or workload chart that shows each person’s committed hours against their available hours
Indicator: Leading
When to skip this KPI: Very small teams where responsibilities overlap constantly, and formal workload balancing adds little operational value
Bonus KPIs to track
Here are some bonus KPIs that measure things that directly affect delivery speed, profitability, resilience, and long-term scalability:
Category
New KPIs to consider
Value velocity
Decision Latency (time from issue identification to resolution), Velocity-of-Value metrics
AI/Automation
AI-driven workflow adoption rate, Automation completion rate, Forecast accuracy using ML
Hybrid/remote teams
Asynchronous collaboration effectiveness, Virtual team engagement score, Cross-timezone dependency resolution time
Dependency Heatmap weight, Early risk detection rate, Rework rate due to scope creep
Bonus KPIs to track
Summarize this article with AI ClickUp Brain not only saves you precious time by instantly summarizing articles, it also leverages AI to connect your tasks, docs, people, and more, streamlining your workflow like never before.
Summarize this article for me please
Action Thresholds: The Point Where a KPI Should Trigger Action
A KPI becomes useful only when the team agrees on what happens after the number moves. Without thresholds, dashboards turn into passive reporting systems that document problems after the damage is already done.
Here’s what that looks like across the five KPI categories in this guide.
KPI category
Example action threshold
Recommended response
Schedule and timeliness
SPI falls below 0.9 or on-time completion drops below 85%
Re-sequence milestones, remove blockers, or reduce in-flight work before delays compound
Budget and cost
CPI stays below 1.0 for two reporting cycles
Freeze discretionary spending and review scope assumptions before approving new work
Quality and stakeholder
Rework exceeds 10% of total effort or defect rates spike between sprints
Audit requirements, approvals, and handoff quality before increasing delivery pressure
Effectiveness and ROI
CSAT or NPS declines after delivery
Collect stakeholder feedback immediately and adjust the next release, onboarding flow, or delivery process
Resource management
Resource utilization exceeds 90% for more than two weeks
Rebalance workload, delay lower-priority work, or add temporary support to prevent burnout
Action thresholds for KPIs
Summarize this article with AI ClickUp Brain not only saves you precious time by instantly summarizing articles, it also leverages AI to connect your tasks, docs, people, and more, streamlining your workflow like never before.
Summarize this article for me please
How to Choose 3-5 KPIs?
Each KPI should map to one decision, owner, and a threshold for action. Here’s a simple way to choose:
1. Start with the project’s biggest risk: If the project is likely to slip, track schedule. If the budget is tight, track the cost. If quality is the issue, track defects or rework
2. Pick leading and lagging indicators together: Choose at least one early-warning metric and one outcome metric so you can spot trouble before the final result is already locked in
3. Choose controllable metrics: Track numbers your team can influence, not broad outcomes
4. Make sure each KPI triggers a decision: If crossing a threshold would not change scope, staffing, budget, or timing, it is probably just a report metric
Pro Tip: A good KPI set should answer:
What should we do about it?
Are we on track?
What is about to go wrong?
Summarize this article with AI ClickUp Brain not only saves you precious time by instantly summarizing articles, it also leverages AI to connect your tasks, docs, people, and more, streamlining your workflow like never before.
Summarize this article for me please
Which KPIs Should You Avoid?
Most bad KPIs fall into one of the three categories:
Vanity metrics that inflate progress
Activity metrics disconnected from outcomes
Lagging metrics reviewed too late to fix anything
Here are the most common project management KPIs teams should avoid or heavily qualify:
KPI to avoid
Why it can mislead
Better alternative
Number of tasks completed
Rewards teams for breaking work into smaller tasks instead of delivering meaningful outcomes
Cycle time, sprint goal completion, or milestone completion rate
Hours worked per person
High hours often signal overload, poor planning, or inefficient workflows instead of productivity
Resource allocation balance or throughput
Raw utilization rate as the primary KPI
Maximizing utilization above 90% usually increases burnout, delays, and quality issues over time
Sustainable utilization paired with rework and cycle time
Velocity without context
Teams can inflate story points over time, making velocity trends meaningless across quarters
Velocity trend plus release outcomes and defect rate
Number of meetings held
More meetings rarely improve alignment and often increase coordination overhead
Decision latency or blocker resolution time
Total bugs reported
Higher bug counts can mean stronger QA coverage, not worse engineering quality
Defect escape rate or rework percentage
Dashboard views or report opens
Measures whether people opened the dashboard, not whether decisions improved
Threshold-triggered interventions and corrective actions
Budget remaining as a standalone KPI
Doesn’t reveal whether the project is actually delivering value efficiently
CPI, CV, and EAC together
Percentage of “green” project statuses
Teams often avoid marking projects red until problems become unavoidable
SPI, dependency risk, and milestone slippage
Number of features shipped
More output doesn’t guarantee customer adoption or business impact
CSAT, NPS, adoption rate, or ROI
KPIs to avoid
Summarize this article with AI ClickUp Brain not only saves you precious time by instantly summarizing articles, it also leverages AI to connect your tasks, docs, people, and more, streamlining your workflow like never before.
Summarize this article for me please
How to Track Project Management KPIs With Dashboards
A well-built project management KPI dashboard pulls live data, highlights what’s off-track, and makes the next action obvious.
What a PM KPI dashboard needs:
Live data connection: Pulls KPI data directly from project plans, time tracking, budgets, and workload systems
Threshold-based alerts: Automatically flags schedule delays, budget overruns, utilization spikes, or risk thresholds using color coding or notifications
Portfolio-level and project-level views: Lets PMOs monitor overall delivery health while giving project managers access to detailed execution-level metrics
Customizable widgets: Allows teams to track metrics relevant to their delivery model
Shareable and permission-controlled: Gives stakeholders visibility into progress, risks, and performance without exposing editable formulas, filters, or sensitive project data
Here’s a quick guide to building your own project management dashboard with relevant KPIs:
Summarize this article with AI ClickUp Brain not only saves you precious time by instantly summarizing articles, it also leverages AI to connect your tasks, docs, people, and more, streamlining your workflow like never before.
Summarize this article for me please
How We Track Project KPIs in ClickUp
ClickUp works well when KPI tracking needs to stay connected to execution instead of living in a separate reporting layer. Our editorial and operations teams run KPI tracking directly inside the platform.
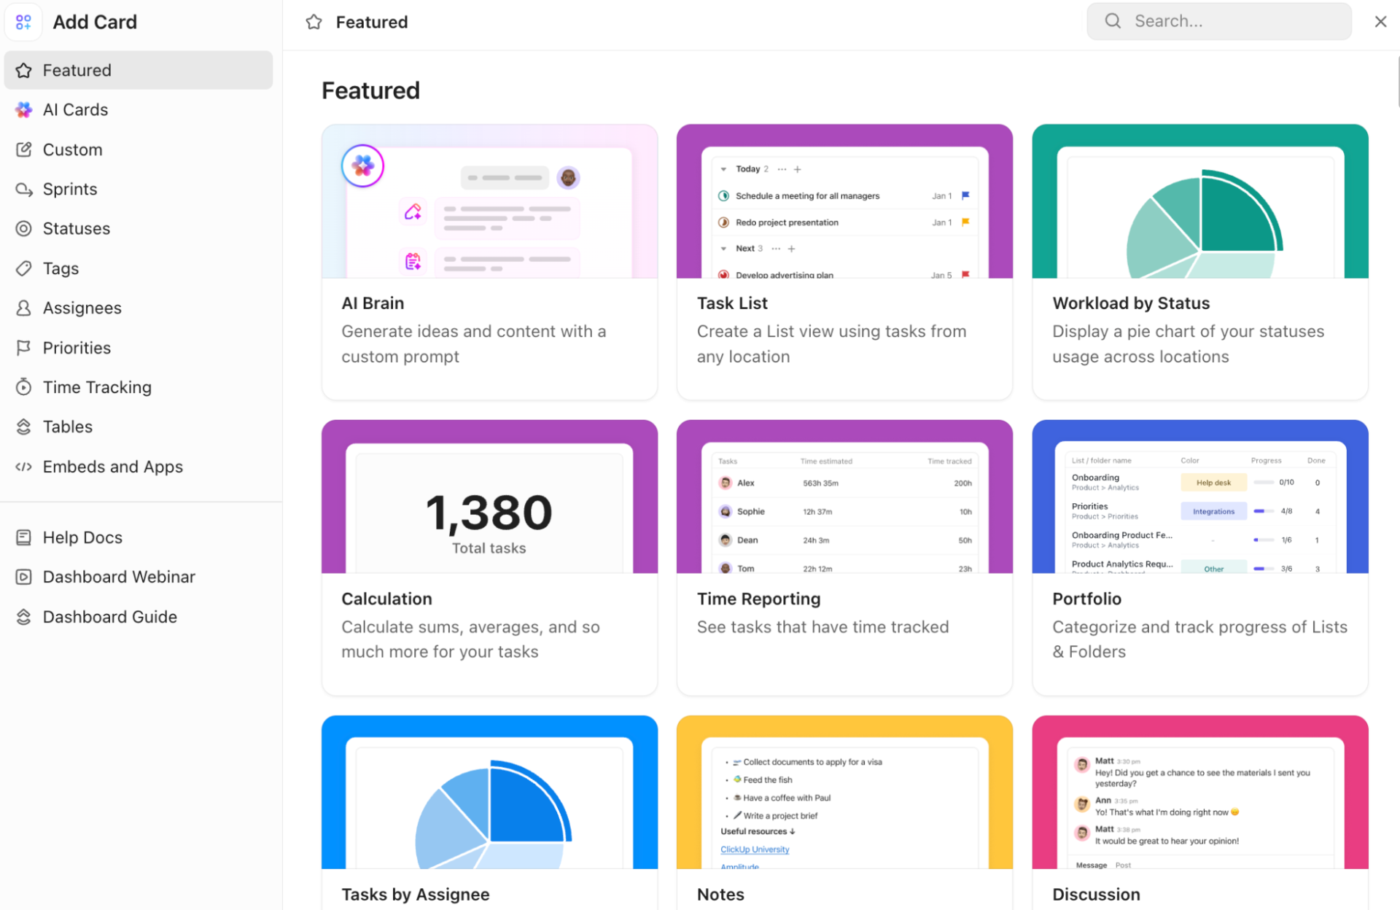
ClickUp Dashboardspull information directly fromactive Spaces, task statuses, time estimates, sprint points, and deadlines already inside the platform.
Customize your ClickUp Dashboard to add only relevant cards and track specific metrics
The most used cards internally are:
Task List cards for blocked or overdue work
Calculation cards for completion rates, open tasks, and sprint totals
Workload cards for capacity planning
Portfolio cards for high-level project health across teams
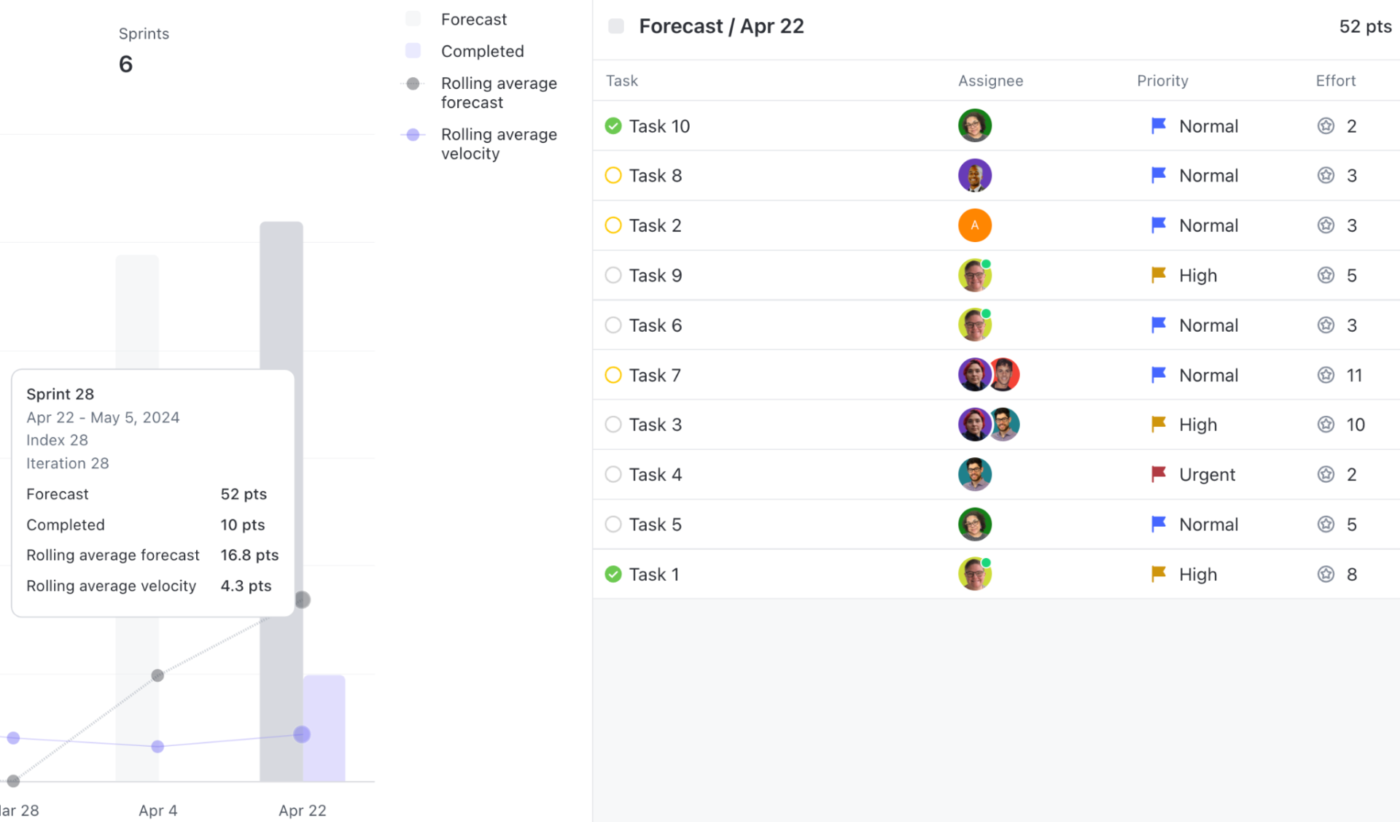
Sprint cards that show whether execution is drifting before the sprint ends
The drill-down view in the velocity charts on a sprint dashboard card helps understand the tasks and effort behind calculations on a ClickUp Dashboard
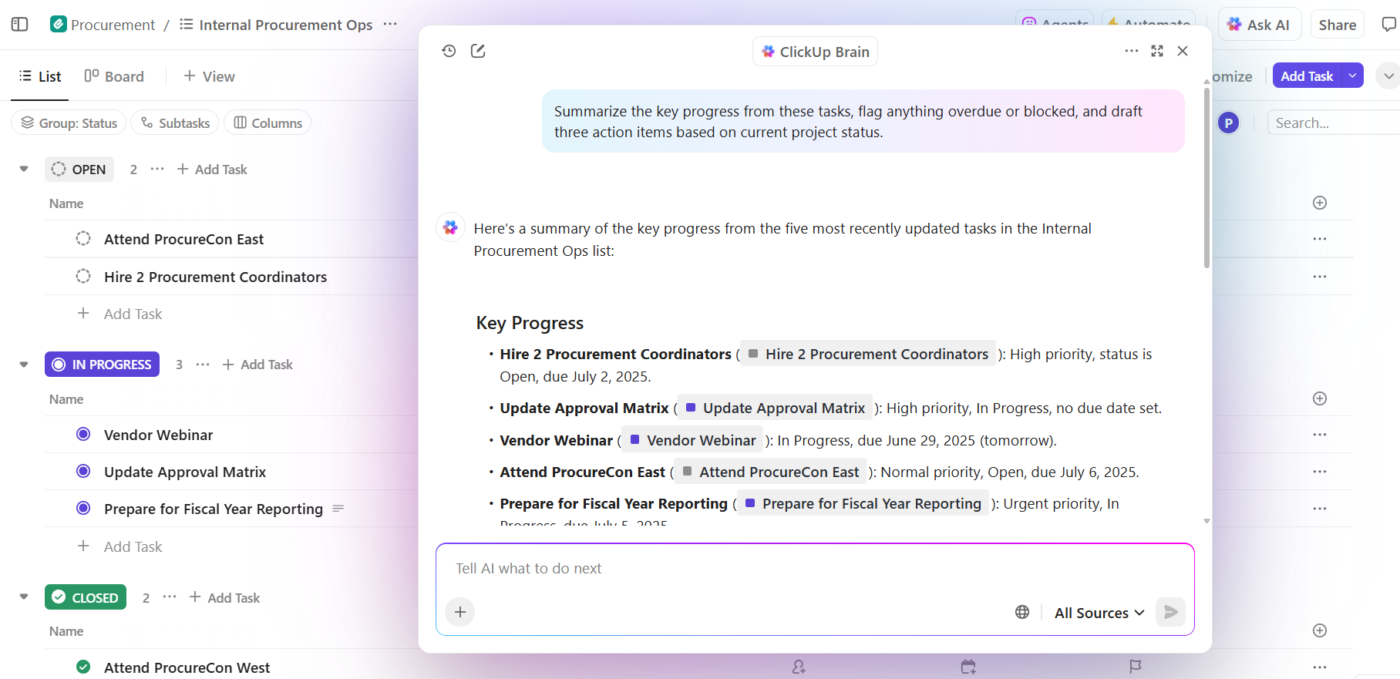
ClickUp Brain surfaces trends across those cards, summarizing updates, flagging blocked tasks, and catching missed deadlines, which saves real time when you’re reviewing several projects at once. We still validate forecasts by hand, because an AI summary isn’t a substitute for delivery judgment.
We keep the system honest by documenting KPI definitions in ClickUp Docs linked to each dashboard, and by running a quarterly review task to retire any metric that’s stopped driving decisions.
Ask ClickUp Brain to optimize your team’s workload and project progress
Honest limitations
ClickUp fits best if: The dashboard, the work itself, and the people responsible for that work all live in the same system. The more cross-functional coordination, recurring reporting, and operational complexity you manage, the more valuable the setup becomes.
Skip if it: Your projects are mostly static checklists or short-term tasks. A spreadsheet or a lightweight Kanban tool will usually be faster to maintain. Teams coming from standalone docs tools or simpler task managers often need time to adjust to the hierarchy of Spaces, Folders, Lists, dashboards, and reporting views.
We simplify all the processes of our departments by integrating business intelligence platforms, mailing tools with automation, and storing KPIs, forms, process documents and dependencies in one app (ClickUp).
Christian Gonzalez, Administrative Coordinator, Cámara Nacional de Comercio, Servicios y Turismo de Guadalajara
Summarize this article with AI ClickUp Brain not only saves you precious time by instantly summarizing articles, it also leverages AI to connect your tasks, docs, people, and more, streamlining your workflow like never before.
Summarize this article for me please
KPIs Need To Change Behavior
Projects usually fail because nobody noticed the warning signs early enough or because the metrics being tracked never triggered action in the first place.
The strongest KPI systems are usually the simplest ones. A handful of well-chosen indicators tied to clear thresholds will outperform massive dashboards filled with numbers nobody uses. You want to spot schedule drift, budget pressure, quality issues, and workload imbalance early.
That’s also why KPI tracking works best when it stays close to execution. Teams move faster when reporting, documentation, workloads, sprint tracking, and corrective actions all live in the same operational workflow.
Summarize this article with AI ClickUp Brain not only saves you precious time by instantly summarizing articles, it also leverages AI to connect your tasks, docs, people, and more, streamlining your workflow like never before.
Summarize this article for me please
Frequently Asked Questions About PM KPIs
How many KPIs should a project track?
Track three to five KPIs per project, and no more than seven to ten total per team. Beyond that, attention fragments and most metrics stop driving decisions. The discipline isn’t collecting more numbers, it’s picking the few that predict trouble and pre-committing to the action each one triggers. PMI’s research consistently ties strong project performance to focused, decision-linked measurement rather than dashboard volume.
How often should project KPIs be reviewed?
Leading KPIs (sprint burndown and resource availability) should be reviewed weekly or at every standup. Lagging KPIs (final CPI, on-time completion rate) are reviewed at phase gates or retrospectives.
How do you set KPI targets for a new project with no historical data?
Use industry benchmarks as a starting baseline, like 70-80% resource utilization for top-performing firms. For schedule and cost KPIs, set thresholds at ±5% variance for the first phase, then tighten based on actuals after the first milestone review.
Can agile teams use earned value KPIs?
Yes, but it requires adaptation. Map story points completed to earned value and planned sprint capacity to planned value. SPI and CPI then work at the sprint or release level. Teams that prefer flow metrics often substitute cycle time and throughput for SV and SPI, since both measure delivery speed without requiring dollar-denominated baselines
What causes scope creep, and how do you measure it?
Scope creep is the uncontrolled expansion of project work without matching adjustments to time, budget, or resources, and it affects 52% of projects according to PMI. Measure it as unapproved work added beyond the original baseline, expressed as a percentage of total planned scope. Rising scope creep without corresponding budget or timeline changes is one of the most common silent project killers, so pair it with a formal change-control step.
Everything you need to stay organized and get work done.