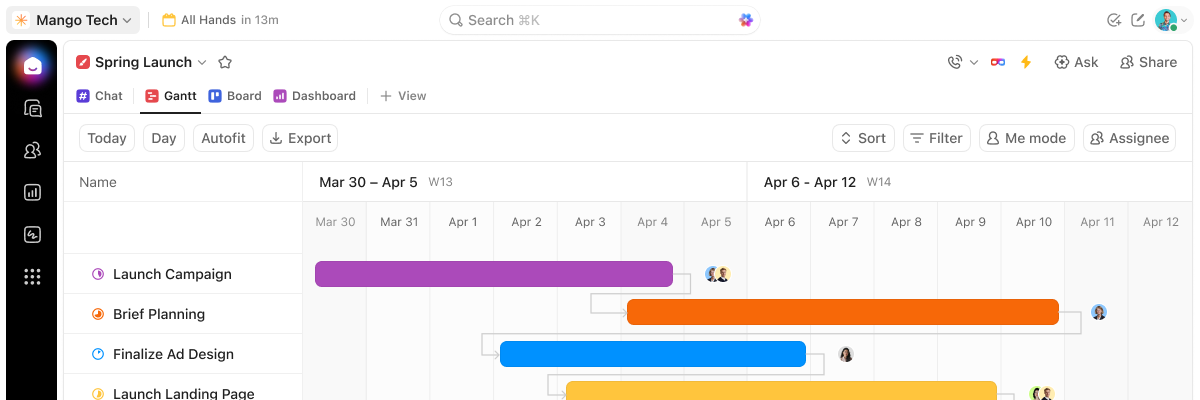
ClickUp Gantt Chart
Gantt charts that keep up when plans don't
Set dependencies, track the critical path, and let AI flag delays before they spread. All inside your workspace.
Free forever.
No credit card.
 25,000+ reviews from
Trusted by the best
Why ClickUp Gantt
Stop rebuilding the timeline every time plans change
ClickUp's Gantt chart lives in the same workspace as your tasks, docs, chat, and AI.
Without ClickUp Gantt
- Moving one task means fixing every downstream date by hand
- No clear view of which tasks control the deadline
- Planned vs actual takes a separate report
- Delays only surface in the status meeting
With ClickUp Gantt
- Move a task and every dependent date adjusts automatically
- Critical Path and Slack Time show what can break your launch date
- Baselines overlay your saved plan on the live Gantt
- Brain answers what's at risk and Super Agents flag stalled dependencies
Gantt view
More than a timeline
Dependencies, critical path, and baselines that keep your plan honest.
Built-in visibility
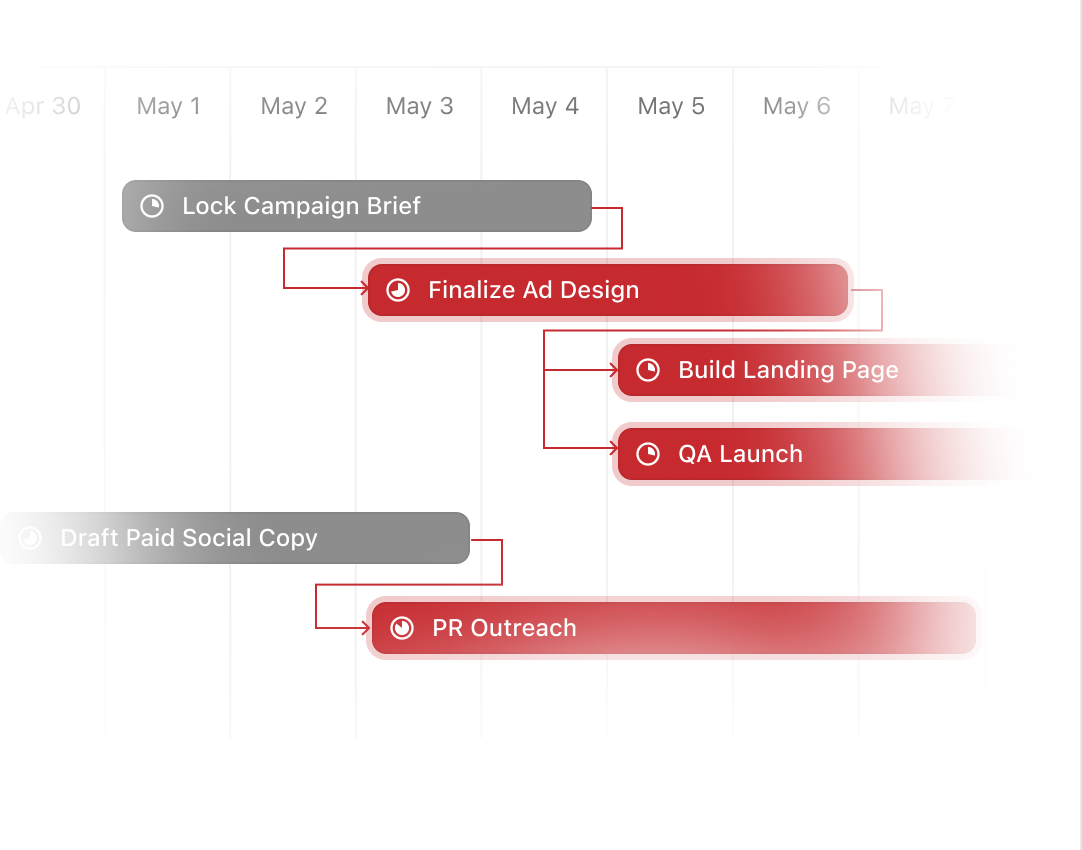
See which tasks control your deadline
Turn on Critical Path and see which tasks can break your launch date. Turn on Slack Time to spot where you still have room before risk turns into delay.
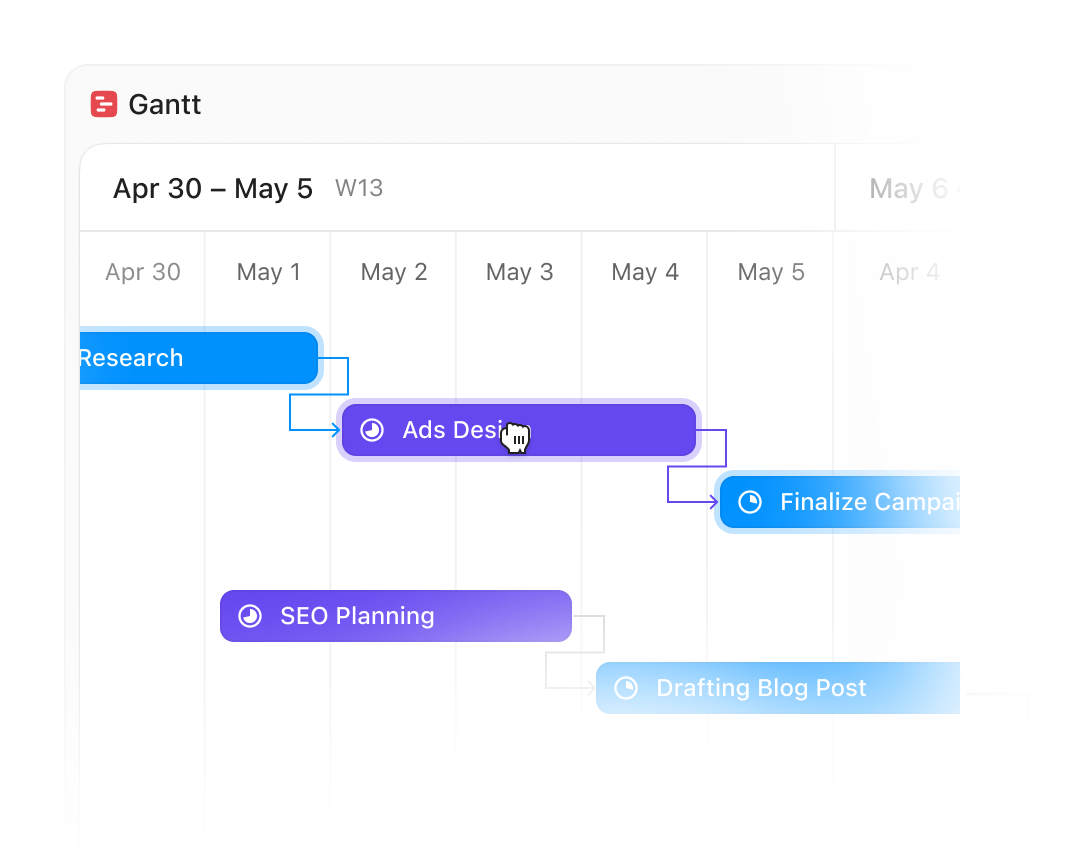
Auto-rescheduling
Every dependent deadline updates in one drag
Move any task and every downstream date adjusts automatically. No manual cascade, no hunting through the timeline to fix what changed.
Baselines
See planned vs actual at a glance
Save a snapshot of your schedule, then overlay it on your live Gantt. See which tasks slipped, which moved up, and how far the timeline drifted without building a separate report.
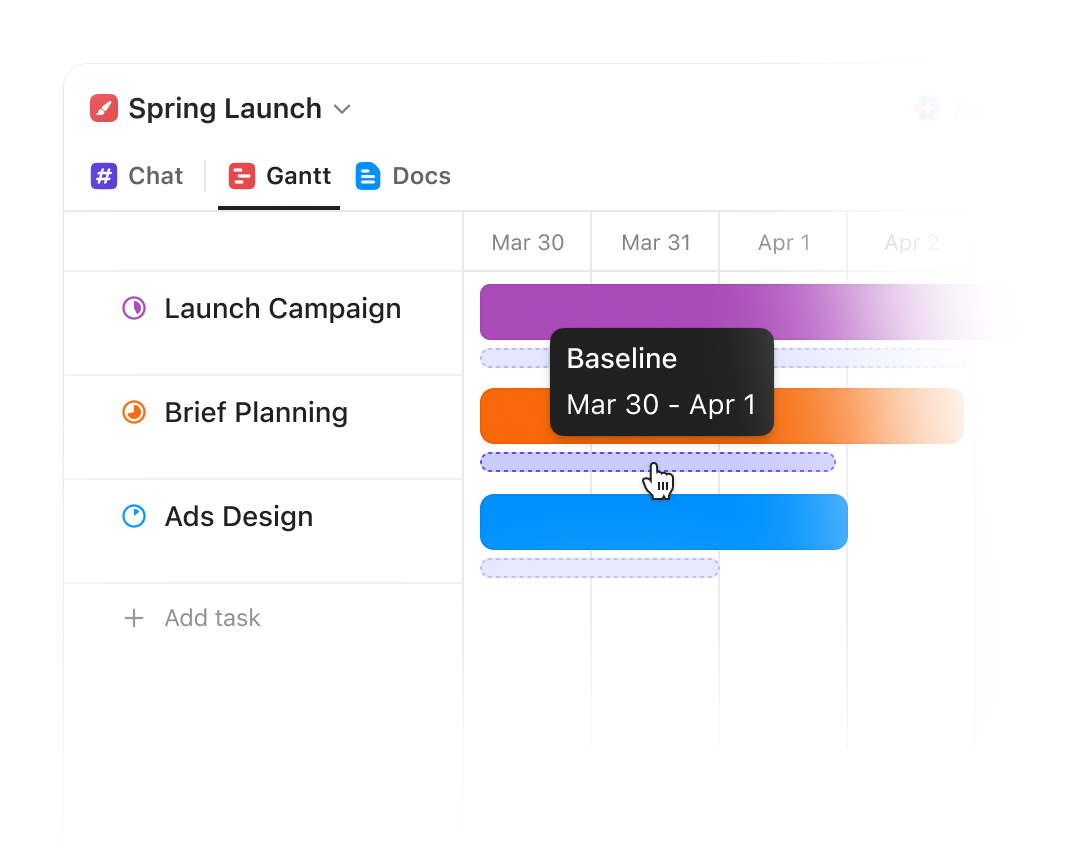
Gantt charts that keep up when plans don't
Keep up with ClickUp.




ClickUp Brain + Super Agents
Let AI do the deadline watching
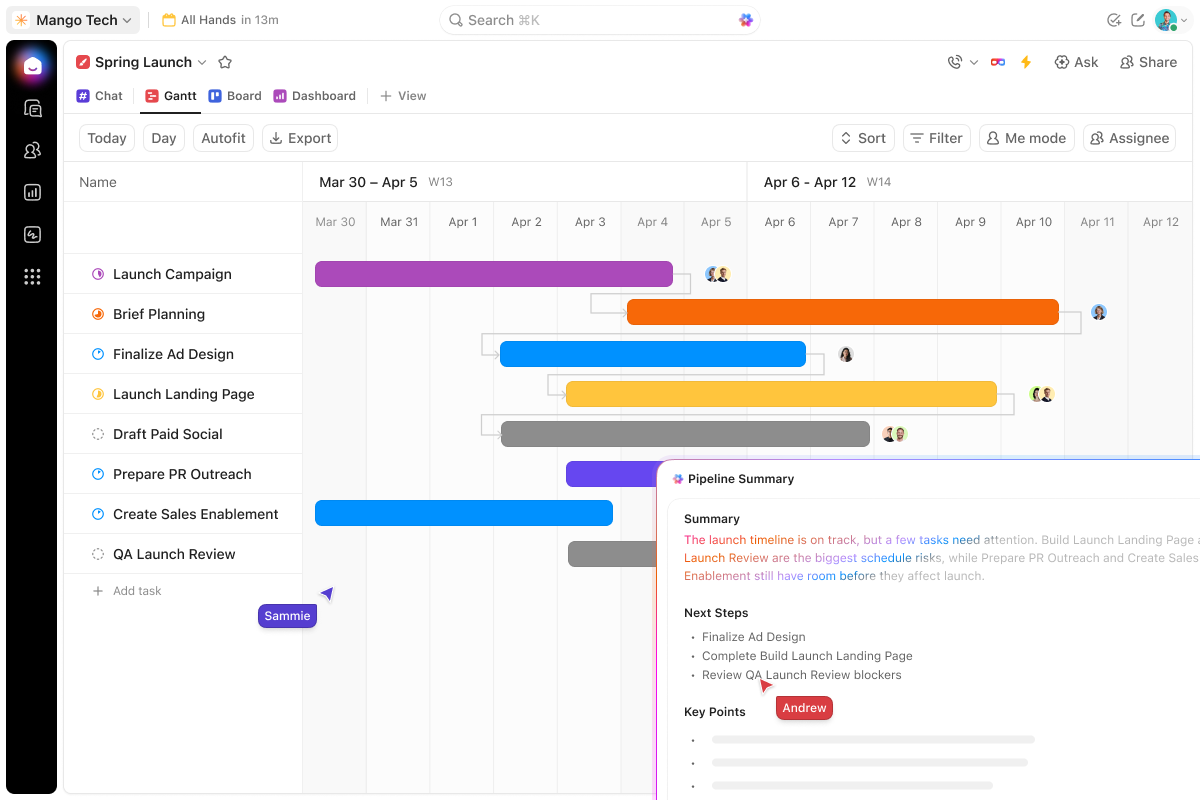
ClickUp Brain answers questions about your timeline. Super Agents flag delays before they spread.
Talk to your Gantt
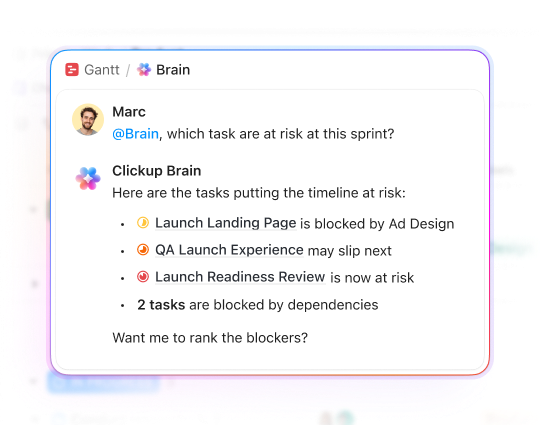
Ask what's going to miss its deadline
"Which tasks are at risk this sprint?" Ask Brain and it reads your Gantt in seconds. Get answers about blocked dependencies, overdue tasks, and who's carrying too much. No status meeting required.
Super Agents
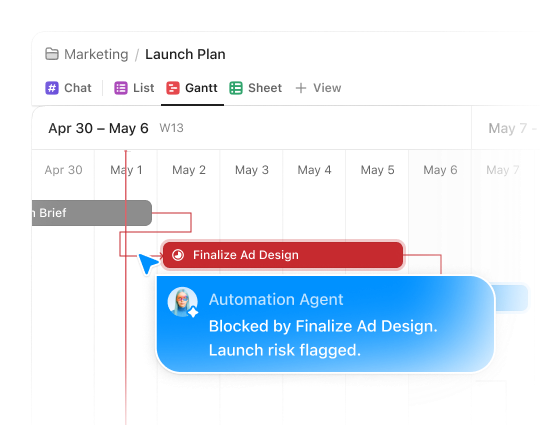
Catch delays before they cascade
Super Agents can monitor your timeline for stalled tasks and overdue dependencies. When something is about to break the critical path, they flag it and alert the right person before the delay spreads to the rest of the plan.
Everything you need to plan, track, and ship
Gantt view is just the beginning
Gantt view is your visual entry point into the ClickUp platform. Tasks, Docs, Chat, Calendar, Dashboards, and more in a single, converged app. Explore everything you unlock when your work lives in one place.
Enterprise Grade Security
Everywhere
SOC 2 TYPE II
ISO 27001
GDPR
HIPAA
24/7 support
SOC 2 TYPE IIISO 27001GDPRHIPAA
FAQs
Frequently asked questions
Gantt chart software is a project planning tool that displays tasks as horizontal bars on a timeline, showing start dates, end dates, dependencies, and ownership. It gives project managers a visual way to track progress, identify bottlenecks, and adjust schedules when plans change.
Yes. ClickUp's Gantt chart view is available on the free plan. You can create timelines, set dependencies, drag tasks to new dates, and turn on Critical Path without upgrading. Advanced features like timeline baselines are available on paid plans.
Open any List or project in ClickUp, click the Views bar, and select Gantt view. Your tasks appear as bars on a timeline organized by date. You can drag tasks to adjust dates, add dependencies, and turn on Critical Path or Slack Time to see which tasks control your deadline.
Dependencies define the relationship between tasks. For example, Task B cannot start until Task A finishes. In ClickUp's Gantt chart, you can set multiple dependency types and drag tasks to reschedule. When one task moves, all dependent tasks shift automatically.
ClickUp's Gantt chart includes critical path analysis, dependency types, and resource workload visibility in a modern, browser-based interface that's free to start. Unlike Microsoft Project, ClickUp connects your timeline to the rest of your work: tasks, docs, dashboards, and chat. No enterprise complexity or licensing cost.
Give your team a timeline that keeps up when plans change
Free forever.
No credit card.
No credit card.