Capacity planning for 100 active projects, without the gut feel
Sorry, there were no results found for “”
Sorry, there were no results found for “”
Sorry, there were no results found for “”
A count of 100 active projects cannot tell you whether the same project manager or engineer appears on several plans, whether business-as-usual (BAU) work consumes much of the team’s time, or which new request should move first. To decide whether new work fits, estimate demand by role for one planning window, subtract BAU and other commitments from gross capacity, then make the tradeoff visible before anyone promises a start date.
This worked example uses a fictional four-week window, 20 full-time equivalents (FTE) across four role groups, and two sample requests. Every staffing and demand number is illustrative. UK Government Project Delivery guidance describes portfolio work through categorizing, prioritizing, balancing, and planning within resource constraints. The guide is written for government project delivery, not a private-sector benchmark (Chapter 12: Managing a portfolio, published July 29, 2024 and last modified July 1, 2026).
Key Takeaways
- Headcount is not free capacity. Estimate hours by skill after BAU, planned leave, internal work, and an explicit reserve.
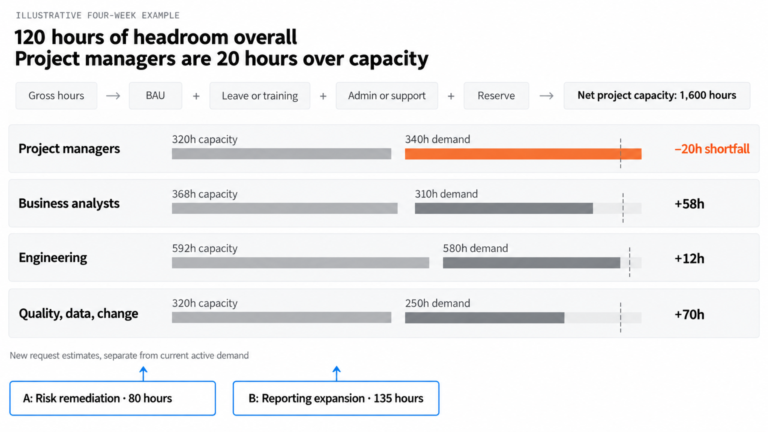
- In this example, 100 active projects create 1,480 hours of near-term demand against 1,600 net project hours, yet project managers are already 20 hours over capacity.
- One deadline-bound request fits only after the PMO moves 40 project-manager hours and 20 engineering hours of lower-priority work to a later window.
- A second request stays deferred because engineering and project-manager capacity are fully used.
In this article: What teams told us · Set a four-week window · Separate BAU and project capacity · Compare backlog requests · Make the tradeoff · First 30 days · Copy the worksheet · Decision
The supplied anonymized PMO notes describe a portfolio of about 100 active projects with new requests continuing to enter the backlog. They also describe allocation as informal and grounded in team knowledge, alongside concerns about adoption, enterprise buy-in, and implementation complexity. These are qualitative inputs from demos, not a representative survey. The portfolio and numbers below are fictional.
A useful first pass does not schedule every task across all 100 projects. It estimates the remaining work by role in the same four-week window, then leaves task-level scheduling with the delivery teams. Chapter 12 advises against an oversized detailed portfolio Gantt chart and emphasizes keeping the level of detail useful for portfolio decisions (Chapter 12, published July 29, 2024 and last modified July 1, 2026).
For this example, the PMO has 20 FTE: four project managers (PMs), four business analysts (BAs), eight engineers, and four people in a combined quality, data, and change group. The planning window is four weeks, and each FTE contributes 160 gross hours in that window. Those are scenario assumptions, not customer or company data.
The first worksheet pass separates work already running, recurring BAU, and proposed work that has not been approved. The scenario starts with 100 active projects and a continuing intake backlog.
Use the same calculation for every role group:
Net project capacity = gross hours - BAU - planned leave or training - admin and support - reserve
BAU includes recurring work that consumes the same people as projects. Record it before comparing project demand with capacity. The Government Project Delivery resource-management guidance covers supply and demand, role and skill needs, actual availability, rolling forecasts, schedule adjustments, and reprioritizing when assumptions change (Chapter 28: Resource management, published July 29, 2024 and last modified July 1, 2026).
A September 2026 Planisware guide recommends accounting for non-project work when comparing demand with available people, skills, and time. It is vendor-authored guidance, so treat it as a method comparison rather than a benchmark (How to Manage Capacity Planning Across Projects, published September 21, 2026).
| Role group | FTE | Gross hours | BAU | Leave or training | Admin or support | Reserve | Net project capacity |
|---|---|---|---|---|---|---|---|
| Project managers | 4 | 640 | 160 | 32 | 64 | 64 | 320 |
| Business analysts | 4 | 640 | 80 | 32 | 96 | 64 | 368 |
| Engineering | 8 | 1,280 | 400 | 64 | 96 | 128 | 592 |
| Quality, data, and change | 4 | 640 | 160 | 32 | 64 | 64 | 320 |
| Total | 20 | 3,200 | 800 | 160 | 320 | 320 | 1,600 |
The reserve is an explicit planning allowance in this example, not a standard percentage. Replace it with the buffer your PMO agrees to protect. The estimate is only useful if each role owner agrees that BAU, leave, support, and the reserve are counted once.
Now compare net capacity with the next four weeks of committed project work:
| Role group | Net capacity | Active-project demand | Headroom or shortfall |
|---|---|---|---|
| Project managers | 320 | 340 | -20 |
| Business analysts | 368 | 310 | +58 |
| Engineering | 592 | 580 | +12 |
| Quality, data, and change | 320 | 250 | +70 |
| Total | 1,600 | 1,480 | +120 |
The portfolio has 120 hours of aggregate headroom, but project managers are 20 hours over capacity. Hours in one role cannot substitute automatically for hours in another. House of PMO’s September 23, 2026 practitioner article argues that resource information should inform timing and sequencing. It draws on an updated practitioner model and webinar, not a controlled outcomes study (Resource Management for PMOs: Using the Portfolio Lens to Prioritise What Matters Most).
For an overview of software categories, see 13 Best Capacity Planning Tools for Resource Management. This article stays with one worked decision instead of comparing vendors.
The backlog becomes comparable when every request uses the same planning window and role categories. These two sample requests are fictional. Their estimates are early role-level assumptions, not task-level plans.
| Request | Scenario rationale | PM hours | BA hours | Engineering hours | Quality, data, and change hours | Total |
|---|---|---|---|---|---|---|
| A: risk remediation | Required in this window under the scenario assumptions | 20 | 18 | 32 | 10 | 80 |
| B: reporting expansion | Useful improvement, with no fixed date in this scenario | 25 | 20 | 80 | 10 | 135 |
Before approval, the PMO checks each request’s outcome, sponsor, timing, dependencies, estimate confidence, and role demand. Then leaders apply their agreed investment criteria. Chapter 12 describes categorizing, prioritizing, balancing, and planning as parts of portfolio management. A ranked request still needs a schedule and resource-fit check. House of PMO’s practitioner article supports using resource information to inform timing and sequencing, rather than treating every initiative as a fixed start-date commitment.
Request A does not fit the current plan as written. Project managers are already 20 hours over, and engineering has only 12 hours free. In this example, the portfolio board moves 40 project-manager hours and 20 engineering hours of lower-priority work to the next window. The work is resequenced, not canceled, and the portfolio still contains 100 active projects. For this scenario, assume the next window can absorb the 60 resequenced hours; confirm its capacity before committing the shift.
| Role group | Net capacity | Active work after resequencing | Request A | Remaining capacity |
|---|---|---|---|---|
| Project managers | 320 | 300 | 20 | 0 |
| Business analysts | 368 | 310 | 18 | 40 |
| Engineering | 592 | 560 | 32 | 0 |
| Quality, data, and change | 320 | 250 | 10 | 60 |
With that tradeoff, Request A fits. It consumes all remaining project-manager and engineering capacity for the window. Request B still does not fit: adding it would put project managers at 345 hours against 320 and engineering at 672 against 592. The PMO can defer it, reduce its near-term scope, find approved capacity, or bring a different portfolio tradeoff to the board. It should not quietly count the same people twice.
This existing guide covers the wider portfolio conversation: Enterprise Project Management: How to Run Every Project as One Portfolio.
A decision note for leaders can be short: “We can fit Request A in this four-week window if we move 40 project-manager hours and 20 engineering hours of lower-priority work to the next window. That leaves no project-manager or engineering headroom. Request B stays deferred until the next review or an approved scope, staffing, or sequencing change.” The board should record who approved the move, which work shifts, the decision date, and when the forecast will be checked again.
This existing guide can help with the broader reporting question: How To Build a Project Portfolio Dashboard To Manage Projects.
Days 1 to 7: Inventory the active projects and requests. For each, capture an owner, outcome, current state, next-window demand by role, dependencies, and estimate confidence. Flag duplicate or unowned requests instead of guessing their status.
Days 8 to 14: Ask role owners to check gross hours and deductions. Separate BAU, known leave, training, support, and the reserve. Keep a range or confidence label when the estimate is still rough.
Days 15 to 21: Review the current portfolio and proposed requests together. Test at least one realistic sequence, such as moving a lower-priority work package to protect a deadline-bound request. Record the effect on every constrained role.
Days 22 to 30: Take the tradeoff to the people with decision authority. Record the accepted sequence, deferred items, assumptions, and the trigger for the next forecast. Reopen the decision if scope, staffing, leave, or priority changes.
If your team already plans dated work in ClickUp, Workload view can visualize team work and capacity over time. Tasks with a start or due date and a matching grouping appear on the canvas, and task workload represents estimated effort. Availability and capacity use workspace working days and hours, with non-working days at zero (Resource management, Add and manage tasks in Workload view, and Measure availability or capacity in Workload view, all checked November 5, 2026). This view reflects entered work; it does not validate the role estimates or approve the portfolio tradeoff.
A PMO can start with a worksheet and the data teams already maintain. Choose a system only after you know which fields, decisions, and update owners the process needs. For a broader overview, see 10 Best PMO Tools of 2026 for Effective Project Management. This article stays focused on the capacity decision, not a vendor ranking.
Use one capacity row for each role and planning window, then one demand row for each current project or proposed request. Replace the fictional values with local estimates.
| Field | Four-week example | What to enter |
|---|---|---|
| Planning window | Next four weeks | Start and end dates for the decision period |
| Portfolio scope | 100 active projects | Count current projects separately from proposed requests |
| Role group | PM, BA, Engineering, Quality/Data/Change | Use roles or skills that cannot be swapped freely |
| FTE by role | 4, 4, 8, 4 | Count people or equivalent capacity assigned to each role group |
| Gross hours | 640, 640, 1,280, 640 | FTE multiplied by the hours in the selected window |
| BAU hours | 160, 80, 400, 160 | Recurring operational work using the same people |
| Leave or training | 32, 32, 64, 32 | Known time away from project delivery |
| Admin or support | 64, 96, 96, 64 | Meetings, administration, on-call, and other internal duties |
| Reserve | 64, 64, 128, 64 | Explicit allowance for unplanned work, set by the PMO |
| Net project capacity | 320, 368, 592, 320 | Gross hours less the deductions above |
| Current project demand | 340, 310, 580, 250 | Remaining work in the same window, grouped by role |
| Current headroom or shortfall | -20, +58, +12, +70 | Net capacity minus current demand; negative means a gap |
| Field | Request A example | Request B example |
|---|---|---|
| Request ID and title | A: risk remediation | B: reporting expansion |
| Sponsor and outcome | Operations sponsor; reduce the stated platform risk | Operations sponsor; improve reporting workflow |
| Status and work type | Proposed; deadline-bound in this scenario | Proposed; discretionary in this scenario |
| Decision owner | Portfolio board | Portfolio board |
| Planning window | Next four weeks | Next four weeks |
| Estimate confidence | Medium, preliminary role-level estimate | Medium, preliminary role-level estimate |
| Project-manager demand | 20 hours | 25 hours |
| Business-analyst demand | 18 hours | 20 hours |
| Engineering demand | 32 hours | 80 hours |
| Quality, data, and change demand | 10 hours | 10 hours |
| Total demand | 80 hours | 135 hours |
| Dependencies | None modeled in this example; validate before approval | None modeled in this example; validate before approval |
| Priority reason | Required deadline in the scenario | No fixed date in the scenario |
| Capacity test | Fits only after moving 40 PM and 20 engineering hours | Exceeds PM and engineering capacity after Request A |
| Decision | Accept after the stated resequencing is approved | Defer or rescope for a later review |
| Next review trigger | Reforecast if scope, staffing, leave, or priority changes | Reopen when capacity or scope changes |
The person preparing the worksheet should preserve the estimate source and confidence beside each request. A low-confidence estimate should trigger a range or a follow-up, not a made-up precise number. The portfolio owner should record the decision and tradeoff, while project leads update the next-window demand when plans change.
Capacity planning for a large portfolio works when the numbers point to a choice someone can make. In this example, the aggregate leaves room, but the project-manager and engineering lanes do not. The next step is to approve the resequencing or move the deadline-bound request. A capacity or workload template can help carry the worksheet fields into the next review, but check its fields against the roles and decisions your PMO needs before adopting it.
Brett Helling
Max 9min read
Brett Helling
Max 8min read
Brett Helling
Max 8min read

© 2026 ClickUp