
Gantt Chart Software for Statistical Modelers
Take Control of Your Statistical Projects with Visual Planning
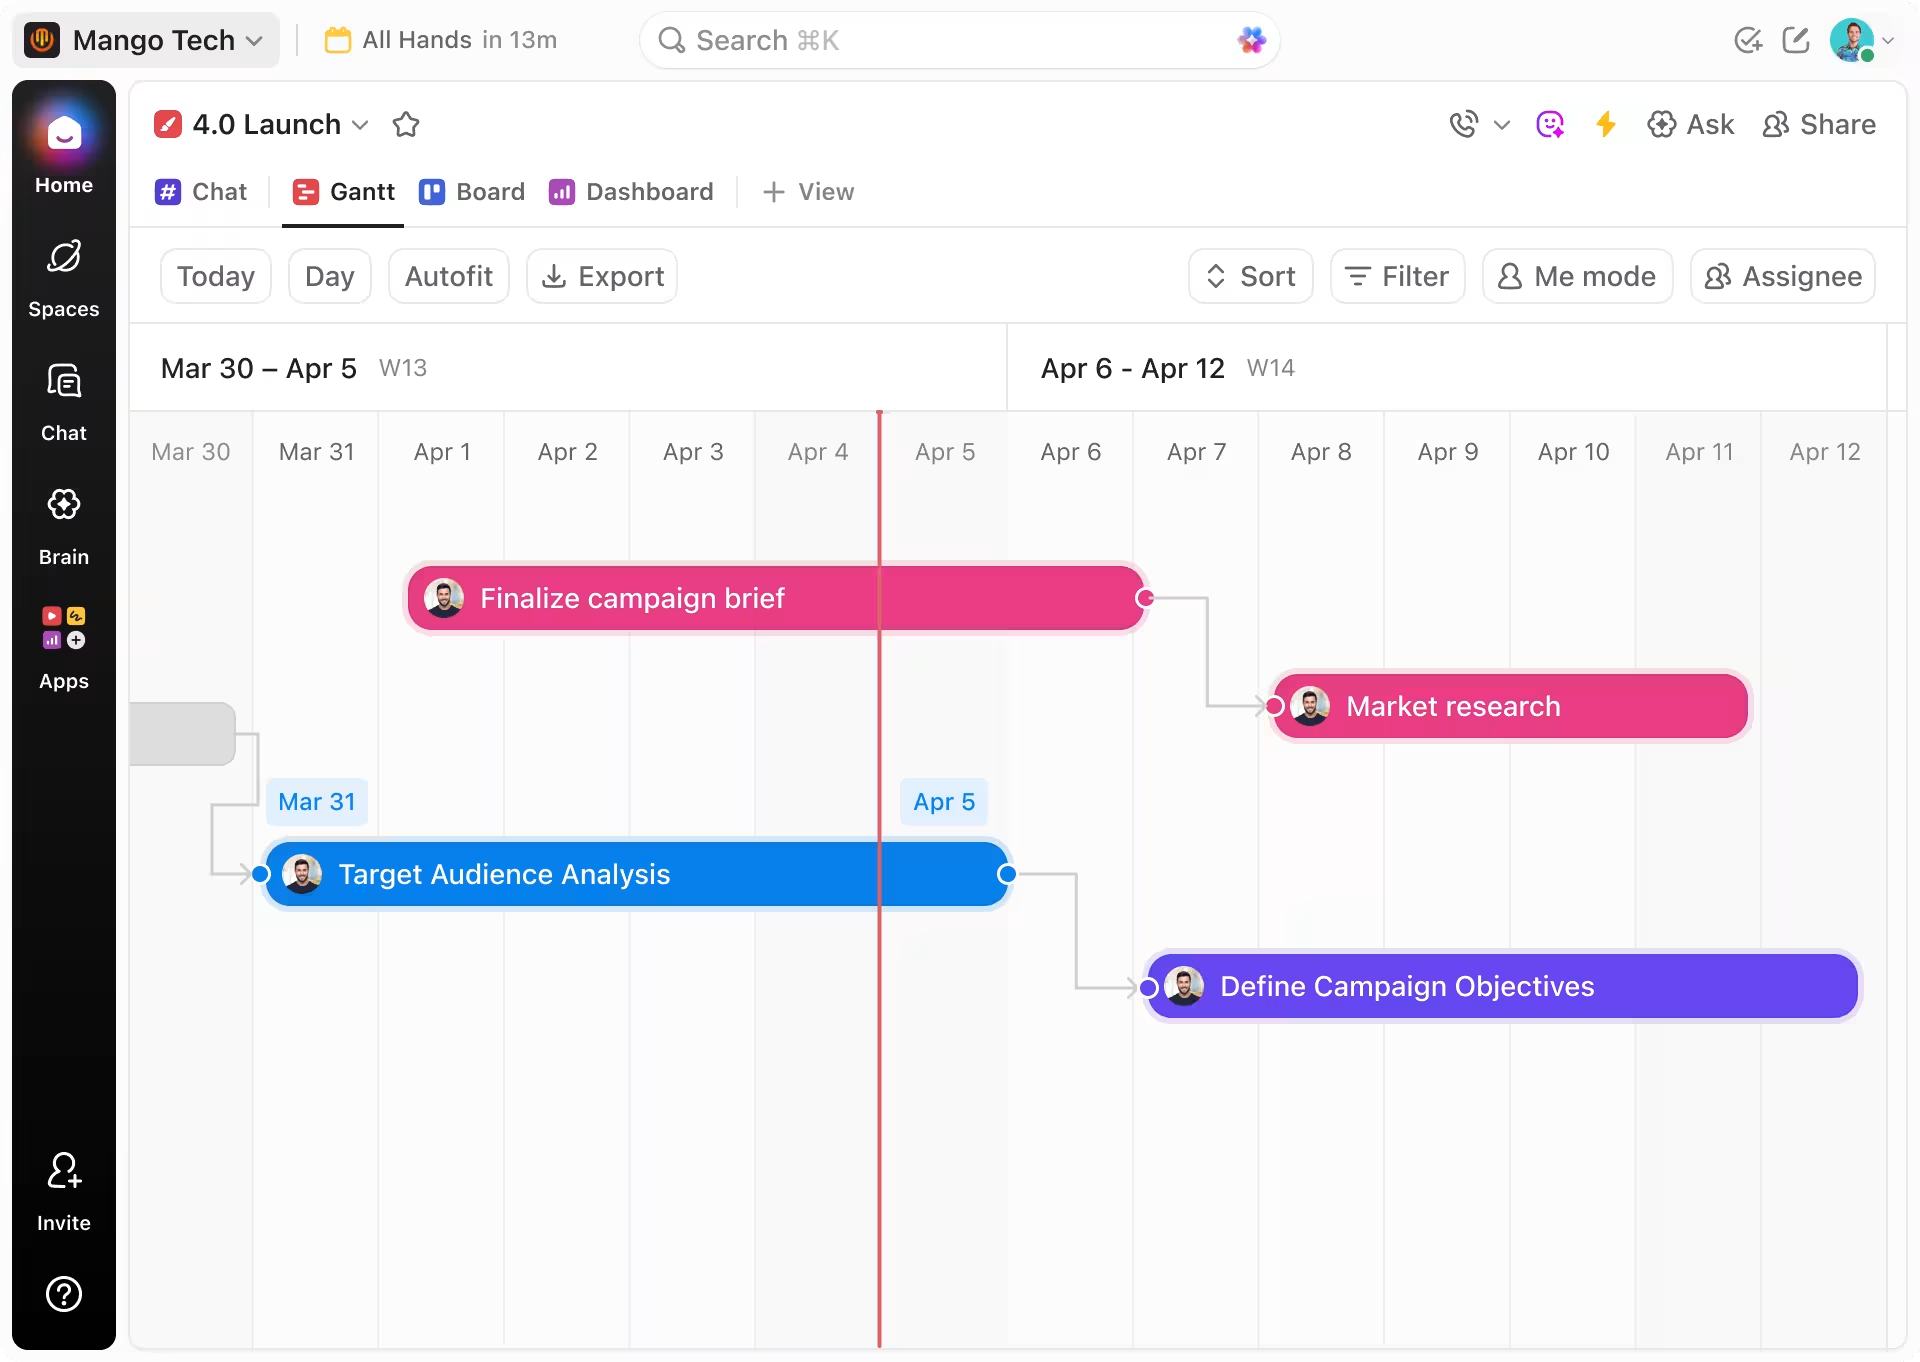
Outline your modeling workflows from data prep to deployment, monitor timelines spanning weeks or months, synchronize your team effortlessly, and visualize your entire process beyond your mental notes.
 25,000+ reviews from
Trusted by the best
Why Use Gantt Charts
The Critical Role of Gantt Charts in Statistical Modeling
Managing statistical modeling projects without a clear timeline is like navigating a maze blindfolded. Priorities become fuzzy, tasks overlap, and deadlines sneak up unexpectedly.
Here’s what typically falls apart without timeline visualization:
- Project phases blend together — it’s tough to distinguish data gathering, model training, and validation stages.
- Data preprocessing tasks get overlooked — tracking what’s done or pending becomes a guessing game.
- Model dependencies cause errors — unclear task order leads to rework and inconsistent results.
- Collaboration stalls — unclear ownership and scattered feedback slow progress.
- Deadlines for deliverables and reviews get missed — creating bottlenecks in deployment.
- Progress tracking feels intangible — long projects seem stagnant without visible milestones.
- Communication scatters across tools — making it hard to keep everyone aligned.
- Resource allocation conflicts arise — computational resources or datasets get double-booked.
Comparing Approaches
Why Traditional Project Tracking Falls Short for Statistical Modelers
Discover how ClickUp Gantt Charts bring clarity and control that spreadsheets and sticky notes can’t match.
Conventional Methods
- Tasks scattered across spreadsheets and emails
- No unified timeline → duplicated or missed steps
- Manual tracking of model training sequences → prone to errors
- Fragmented communication among data scientists
- Deadlines and reviews often overlooked
- Data and code versions stored separately
ClickUp Gantt Charts
- Unified tasks and timelines in one interactive view
- Visualize data prep, modeling, and validation with clear deadlines
- Track dependencies and milestones effortlessly
- Assign ownership with transparent accountability
- Automate deadline reminders and impact notifications
- Attach datasets, scripts, and documentation directly to tasks
Use Cases
Unlocking Value: How Gantt Charts Empower Statistical Modelers
Explore how visual timelines eliminate confusion and keep your modeling projects on track.
#UseCase1
Visualizing Long-Term Modeling Pipelines
ClickUp’s Gantt charts externalize complex pipelines, making bottlenecks visible and progress measurable.
#UseCase2
Building Transparent, Reproducible Workflows
Map every modeling phase—from data cleaning to hyperparameter tuning—into a clear timeline that stakeholders can follow.
#UseCase3
Tracking Peer Review and Feedback Cycles
Update timelines dynamically to reflect review comments, ensuring feedback is integrated on schedule.
#UseCase4
Preventing Model Drift with Ordered Task Sequences
Define dependencies so preprocessing, training, and validation occur in the correct order, maintaining model integrity.
#UseCase5
Managing Data Access and Compute Resources
Visualize resource bookings and data availability to avoid conflicts and maximize efficiency.
#UseCase6
Coordinating Multi-Stage Data Analysis
Gantt views clarify how each analysis step impacts the next, ensuring smooth transitions and accurate results.
#UseCase7
Meeting Project Milestones and Release Deadlines
Visual timelines help plan deliverables like reports and model deployments, so deadlines are always met.
#UseCase8
Organizing Collaborative Coding and Validation Tasks
Assign tasks and track progress on shared codebases without overlap or confusion.
#UseCase9
Turning Meetings Into Task-Driven Timelines
Convert discussions into actionable tasks with deadlines to keep the project moving forward.
Key Beneficiaries
Who Benefits Most from Gantt Chart Software in Statistical Modeling
Ideal for professionals juggling complex models, datasets, and collaborative timelines.
If you coordinate cross-functional data science teams
ClickUp visualizes workflows across departments and time zones, keeping everyone synchronized.

If you’re a data engineer or pipeline architect
ClickUp sequences ETL tasks, manages resource scheduling, and prevents pipeline bottlenecks.

If you’re a graduate student or research analyst
ClickUp helps plan experiments, model development, and thesis milestones with clarity and precision.

How ClickUp Supports Modelers
How ClickUp Gantt Charts Accelerate Statistical Modeling Projects
Craft a cohesive, visual workflow tailored to your modeling needs.
Centralize All Project Materials
Link datasets, scripts, model artifacts, and documentation directly to timeline tasks.
Visualize Project Phases Clearly
Plan data collection, feature engineering, modeling, and validation with transparent timelines.
Standardize Modeling Processes
Use templates and dependencies to ensure reproducibility and reduce errors.
Enhance Team Collaboration
Assign tasks with deadlines, monitor progress, and coordinate parallel workflows smoothly.
Convert Meetings into Actionable Plans
Transform discussions into sequenced tasks on your Gantt chart—so nothing falls through the cracks.
Stay Ahead of Deadlines
Track reviews, releases, and approvals with automated notifications and timeline oversight.

Frequently Asked Questions About Gantt Chart Software for Statistical Modelers


SOC 2
CERTIFIED

ISO 27001
CERTIFIED

GDPR
COMPLIANT

HIPAA
COMPLIANT