كيف تشجع فريقك على التفكير في الأهداف المؤسسية وتحقيقها؟ الخطوة الأولى هي إجراء جرد عميق لمؤشرات الأداء الرئيسية (KPIs).
الأمر هو أن مؤشرات الأداء الرئيسية تحفيز الفريق في الأشهر القليلة الأولى، ثم يضيع في خيوط البريد الإلكتروني الطويلة، ويعاد النظر فيه قبل يوم واحد من اجتماع مهم مع القيادة العليا.
مؤشرات الأداء الرئيسية المصممة بشكل جيد ستمكّن الفرق من حل أوجه القصور، والتخلص من الطلبات التي تمتص الوقت، ومواءمة المهام والمشاريع مع الأهداف على مستوى الشركة . هذا هو ما نريده لك ولفريقك، لذلك قمنا بتجميع قائمة بأمثلة ونماذج لمؤشرات الأداء الرئيسية للإجابة عن أسئلتك:
في أي حالة يصبح المقياس مؤشر أداء رئيسي؟ من هو جزء من عملية تطوير مؤشرات الأداء الرئيسية؟ أين يمكنني تتبع التقدم المحرز في مؤشرات الأداء الرئيسية؟ كيف يمكنني دفع العمل وتحفيز فريقي نحو تحقيق النتائج؟
سنقوم بتغطية كل ما سبق - وأكثر من ذلك - لأن مؤشرات الأداء الرئيسية هي الخلطة السرية لاستراتيجية الأعمال الحديثة. و كل شخص مؤهل لهذه المهمة.

ما هو مؤشر الأداء الرئيسي أو مؤشر الأداء الرئيسي؟
مؤشر الأداء الرئيسي أو مؤشر الأداء الرئيسي هو مقياس قابل للقياس الكمي يُستخدم لمراقبة التقدم المحرز في تحقيق أهداف العمل. وبشكل أكثر تحديدًا، يعطي مؤشر الأداء الرئيسي نظرة ثاقبة للأداء حول أهم أصول المؤسسة: الأشخاص.
حيث تستثمر الشركات الوقت والجهد والمال لتوظيف محللي المشاكل، أي الأشخاص الذين يتمتعون بمهارات تحليل البيانات وتفسيرها لاتخاذ القرارات. ولا يقتصر هذا الاستثمار على توظيف أقسام تكنولوجيا المعلومات والمالية. فقد قيل إن القوى العاملةمع مهارات محو أمية البيانات يساعد في تحسين صحة الشركة وأدائها بشكل عام.
وهذا يعني أن الجميع - موظفو الخطوط الأمامية والمدراء والقيادة العليا - لهم تأثير على الأهداف التنظيمية. لذا بصفتك قائد فريق، تقع على عاتقك مسؤولية إعطاء الأشخاص أفكارًا مدروسة ومحددة و مؤشرات أداء رئيسية قابلة للقياس .
إذا كنت من محبي التعلم المرئي، اطلع على مدونة الفيديو هذه حول إعداد مؤشرات الأداء الرئيسية!
كيفية تحديد مؤشرات الأداء الرئيسية
إذا استخلصت شيئًا واحدًا من هذا الدليل، فليكن هذا: مؤشرات الأداء الرئيسية الفعالة تسمح للناس باتخاذ قرارات دقيقة وسريعة.
إن أول خطأ ترتكبه الشركات عندما تقوم بوضع مؤشرات الأداء الرئيسية هو إرسال بريد إلكتروني إلى جميع قادة الأقسام مع سطر الموضوع: ما الذي ستفعله حيال كل هذه المقاييس السيئة حقًا؟
بدلاً من ذلك، يجب أن تستهدف الشركات المقاييس التي لها التأثير الأكبر على استدامتها. عندما تركّز على المشاريع والأدوات والأنظمة التي تحرّك الإبرة، فإنك بذلك تبني خارطة طريق للأعمال لزيادة سرعتك نحو نمو الإيرادات إلى أقصى حد.
لذا إليك قائمة مراجعة خطوة بخطوة لمساعدتك على بدء مؤشرات الأداء الرئيسية الخاصة بك بالطريقة الصحيحة:
1. تحديد مقاييس الأعمال المرتبطة مباشرةً بأهداف العمل
لنبدأ بالأساسيات التي مؤشرات الأداء الرئيسية للمبيعات تبدو مختلفة عن مؤشرات الأداء الرئيسية للمنتج والتي تختلف عن مؤشرات الأداء الرئيسية المالية . اطرح أسئلة حول مؤشرات الأداء المباشرة في منطقتك لفهم ما الذي يريدون تحقيقه ومعاييرهم للنجاح. ستستخدم هذه المجموعة هذه مقاييس الأعمال كدليل للشهر أو الربع أو السنة القادمة. إذا كان مؤشر الأداء الرئيسي لا يساهم في هدف العمل ، يجب أن تذهب!
- ما هي المشكلة التي تريد حلها في عمليتك/فريقك/منظمتك؟
- ما هي النتيجة التي تريد تحقيقها؟
- كيف ستقيس النجاح؟
- كيف ستعرف ما إذا كنت قد حققت النتيجة المرجوة؟
المكافأة:_
_/مرجع/ https://clickup.com/blog/product-requirements-document-templates// قوالب مستندات متطلبات المنتج* %/%href/_
2. كتابة مؤشرات أداء رئيسية واضحة ومحددة
بمجرد حصولك على رؤيتها، قم بتنظيم المقاييس في فئتين: المؤشرات الرائدة والمتأخرة.
- ستتيح لهم المؤشرات الرائدة معرفة ما إذا كانوا بحاجة إلى تعديل استراتيجيتهم للعودة إلى المسار الصحيح نحو تحقيق النتيجة المرجوة
- أما المؤشرات المتأخرة فهي عكس ذلك. وتحدد مؤشرات الأداء الرئيسية هذه مدى جودة أداء العمليات والتحديثات على مدى فترة زمنية أطول
نصيحة احترافية: قد يكون من المغري استخدام الكلمات المختصرة أو الكلمات الرقيقة الخاصة بالشركة، ولكن تذكر أن مؤشرات الأداء الرئيسية هذه يتم مشاركتها على مستوى الشركة، لذلك يجب أن تكون واضحة للجميع.
3. قم بإدخال مؤشرات الأداء الرئيسية في أداة تعمل عن بُعد لتسجيل التقدم المحرز ومراقبته
سنقولها تقارير مؤشرات الأداء الرئيسية ليست الأكثر إثارة في البناء.
إنها مهمة يومية (تقريبًا) تتطلب وقتًا لتحويل البيانات الأولية إلى رؤى قابلة للتنفيذ. لدرجة أن تقارير مؤشرات الأداء الرئيسية عادةً ما يكون عمرها الافتراضي قصير بعد وصولها إلى صندوق الوارد لعدة أسباب:
- تصبح التقارير قديمة بحلول نهاية اليوم لأن البيانات تتغير كل ساعة
- التقارير بصيغة PDF أو Excel تبدو مختلفة على شاشات مختلفة
- التقارير المرسلة عبر البريد الإلكتروني ليست آمنة
الحصول على المعلومات الصحيحة في الوقت المناسب ضرورة للشركات التي تعتمد على البيانات. يريد الأشخاص الوصول إلى مؤشرات الأداء الرئيسية على هواتفهم الذكية وأجهزة الكمبيوتر المكتبية وحتى على الشاشة الكبيرة في المكتب. إذا كنت تبحث عن أداة مجانية للوحة المعلومات لتلبية هذه الاحتياجات، جرّب ClickUp! ابدأ باستخدام ClickUp
51 أمثلة ونماذج لمؤشرات الأداء الرئيسية لقياس التقدم المحرز
هنا في ClickUp، نحن هنا في ClickUp، نحن معجبون جدًا بمؤشرات الأداء الرئيسية و أنت، لذلك قام فريقنا بالعمل وجمع قائمة بمؤشرات الأداء الرئيسية و قوالب مجانية مرتبة حسب القسم أو الصناعة.
أمثلة على مؤشرات الأداء الرئيسية للمبيعات
1. تكلفة اكتساب العملاء: التكلفة الإجمالية لـ اكتساب عميل (يشمل التكاليف التي يتم إنفاقها على عملية البيع ومن خلال جهود التسويق) 2. أنشطة المبيعات لكل مندوب: إجمالي عدد المهام المنجزة في فترة زمنية معينة 3. معدل تحويل العميل المحتمل إلى عميل: النسبة المئوية للعملاء المحتملين الذين تم تحويلهم في عملية المبيعات 4. إجمالي إيرادات المبيعات: إجمالي الإيرادات المحققة من منتجاتك خلال فترة محددة 5. مدة دورة المبيعات: متوسط الوقت المستغرق بين الاتصال الأولي حتى الإغلاق
المحاولة قالب تتبع عمولة ClickUp 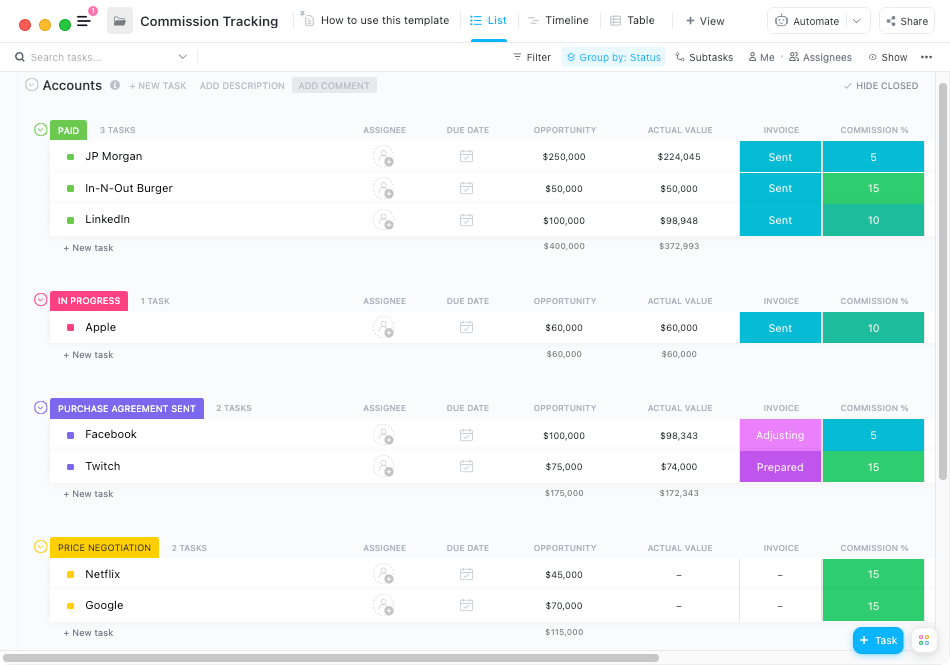
تعمل حقول الحساب المحددة مسبقًا في قالب تتبع العمولة على إزالة العمل اليدوي تنزيل هذا القالب
أمثلة مؤشرات الأداء الرئيسية للعمليات
6. ساعات العمل الإضافي: عدد ساعات العمل التي يعملها الموظف بعد ساعات العمل المعتادة المقررة له 7. العمليات المطورة: عدد التحسينات التي تم إدخالها على العمليات الحالية 8. تكاليف المخزون: المبلغ الإجمالي لجميع النفقات المتعلقة بتخزين البضائع غير المباعة 9. استخدام الحيز المكتبي: النسبة المئوية للمساحة المكتبية التي يستخدمها الموظفون 10. استخدام امتيازات الشركة: النسبة المئوية للامتيازات التي يستخدمها الموظفون
قالب طلب مشروع ClickUp والموافقة عليه 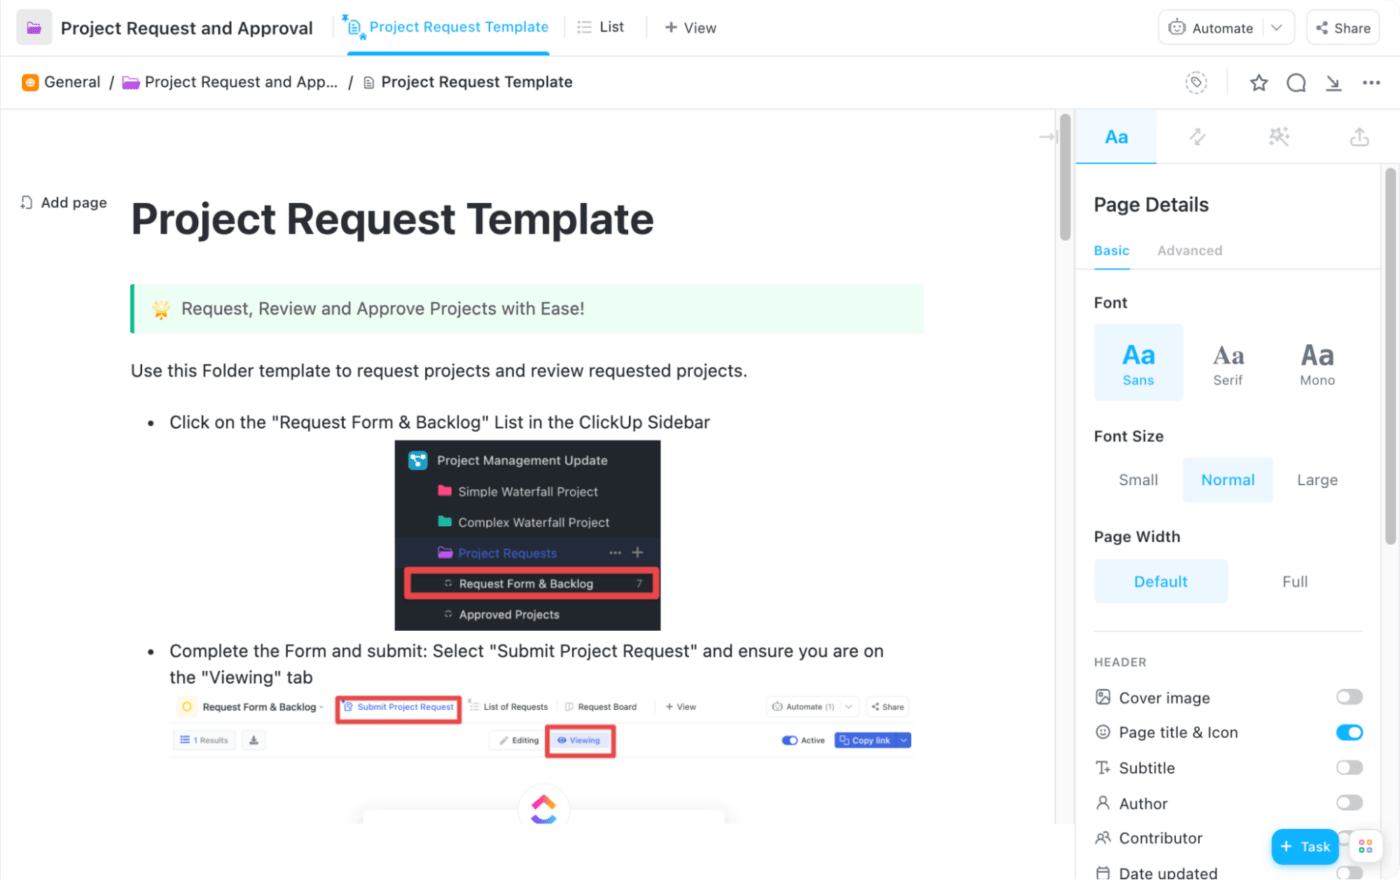
تخطيط العمل الوارد وتصوره باستخدام قالب طلب المشروع تنزيل هذا القالب
أمثلة على مؤشرات الأداء الرئيسية المالية
11. العائد على حقوق الملكية: مقياس الأداء المالي القائم على صافي الدخل مقسومًا على حقوق المساهمين 12. هامش الربح الصافي: المبلغ المالي الذي تمتلكه شركتك بعد خصم جميع النفقات (الفائدة، والضرائب، ونفقات التشغيل، وما إلى ذلك) من إجمالي الإيرادات 13. تكلفة البضائع المباعة: التكلفة الإجمالية لتصنيع المنتجات التي تبيعها الشركة (باستثناء مصاريف المبيعات والإدارة والتسويق) 14. نسبة الدين إلى حقوق الملكية: نسبة إجمالي التزامات الشركة إلى حقوق المساهمين 15. التدفق النقدي الحر: مقدار الأموال المتبقية بعد النفقات الرأسمالية
قوالب تمويل ClickUp 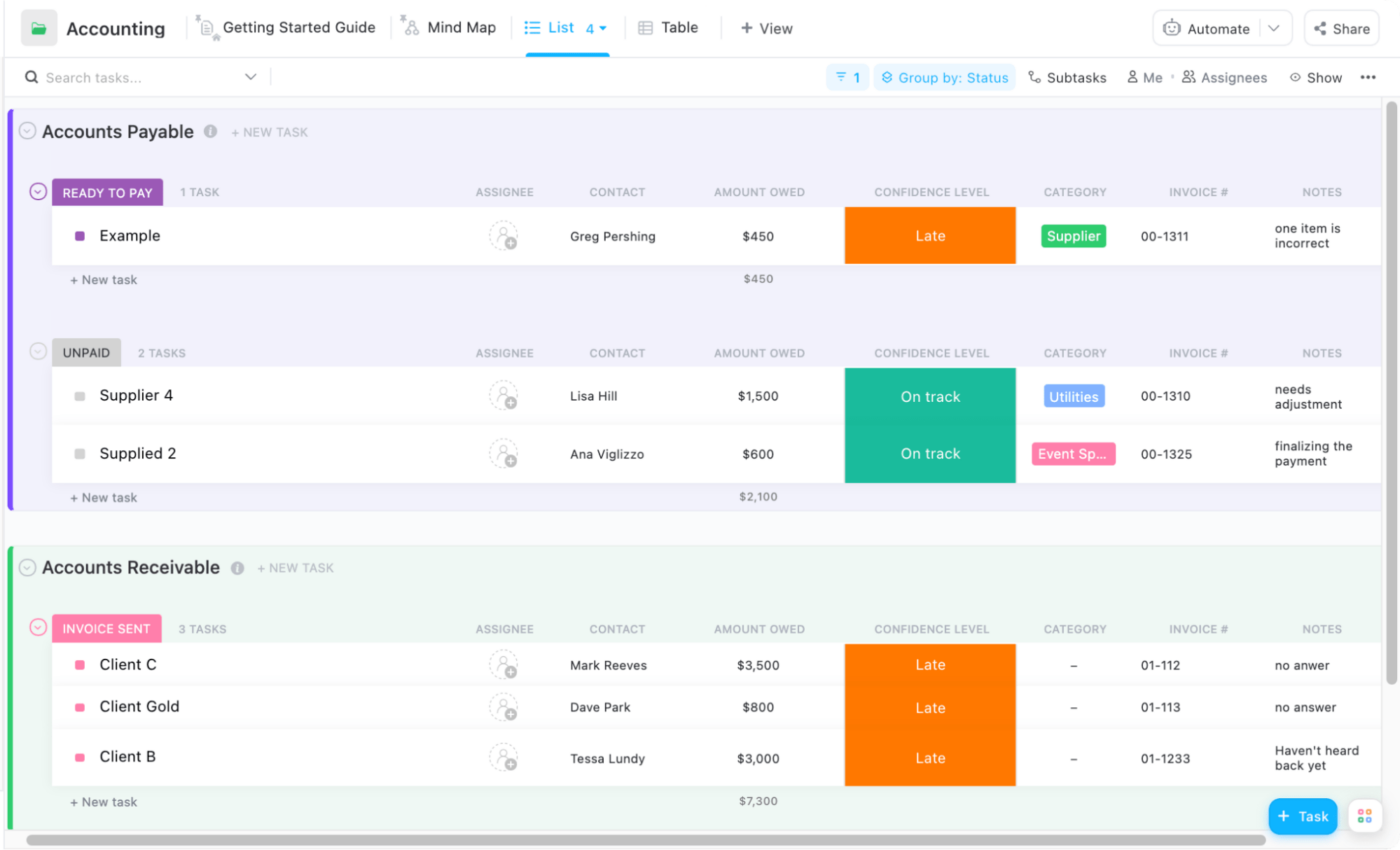
قم بإدارة سجلات المبيعات والدخل والإيرادات المتوقعة وغير ذلك باستخدام قوالب المحاسبة تنزيل هذا القالب
أمثلة على مؤشرات الأداء الرئيسية للتسويق
16. العائد على الاستثمار التسويقي: العائد من الاستثمار التسويقي مقسومًا على تكاليف الاستثمار التسويقي 17. معدل الارتداد: النسبة المئوية لرسائل البريد الإلكتروني المرتدة. يحدث هذا عندما لا يعود عنوان البريد الإلكتروني نشطًا 18. نسبة النقر إلى الظهور: عدد الأشخاص الذين نقروا على رابط في بريدك الإلكتروني مقابل إجمالي عدد الأشخاص الذين تلقوا بريدك الإلكتروني 19. الانطباعات العضوية: عدد المرات التي يظهر فيها جزء من المحتوى على صفحة الأخبار الخاصة بشخص ما 20. عدد المشتركين: عدد الأشخاص الذين اشتركوا في حملاتك التسويقية عبر البريد الإلكتروني
عدد المشتركين: عدد المرات التي يظهر فيها المحتوى مؤشرات الأداء الرئيسية للتسويق **_وتتعرف على أفضل نهج لتحديد أهدافك!
قالب تتبع الحملات والتحليلات الخاص ب ClickUp 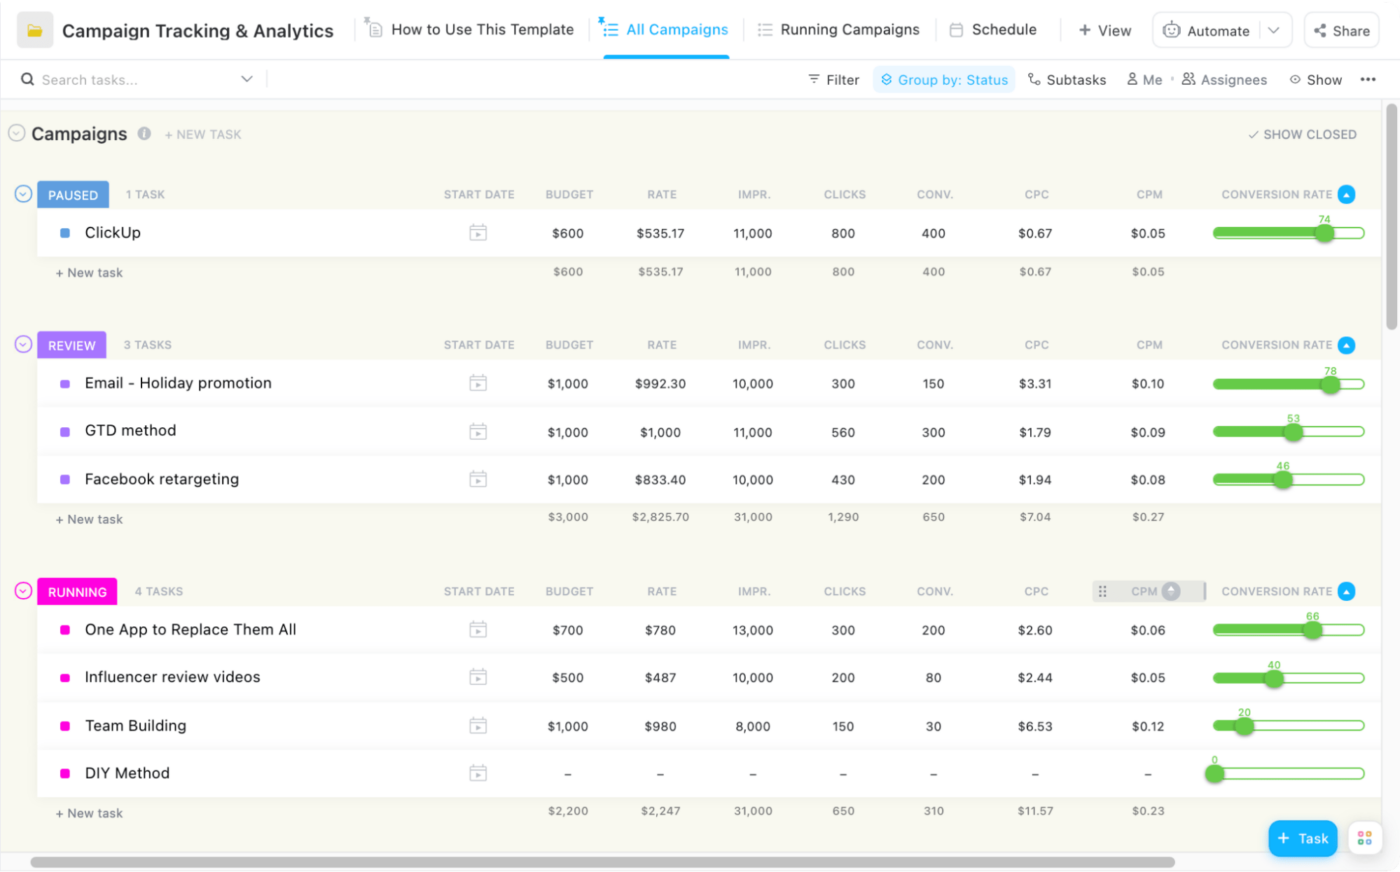
نظّم تخطيط الحملة وأصولها وسير العمل باستخدام قالب تتبع الحملة والتحليلات تنزيل هذا القالب
أمثلة على مؤشرات الأداء الرئيسية للموقع الإلكتروني
21. نسبة عدد الزيارات إلى عدد العملاء المحتملين المؤهلين للتسويق (MQL) : نسبة إجمالي عدد الزيارات التي تم إنشاؤها على الموقع الإلكتروني مقابل عدد العملاء المحتملين المؤهلين للتسويق القادمين من تلك الزيارات 22. أخطاء الزحف: عدد عناوين URL التي يتعذر على Googlebot الوصول إليها عندما يقوم بمسح صفحاتك 23. معدل الارتداد: عدد الأشخاص الذين خرجوا من موقعك في غضون ثوانٍ قليلة من وصولهم إلى موقعك 24. سهولة الاستخدام على الجوّال: سرعة وأداء صفحتك المقصودة على الهواتف وعلامات التبويب 25. عدد زيارات الإحالة: عدد الأشخاص الذين يزورون موقعك الإلكتروني من وسائل التواصل الاجتماعي الخاصة بك
قالب تطوير موقع ClickUp الخاص بـ ClickUp 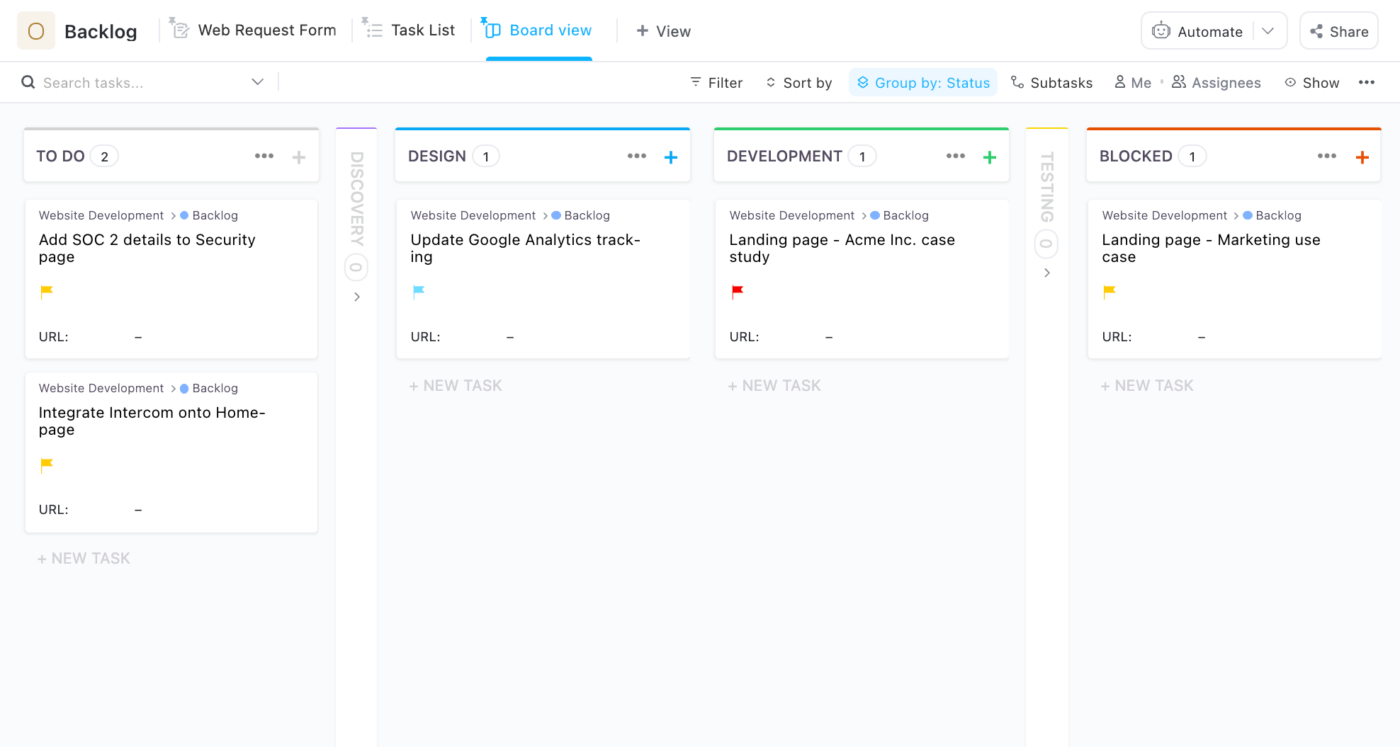
تخطيط الصفحات وتنظيمها وإنشاء صفحات باستخدام قالب تطوير الموقع الإلكتروني تنزيل هذا القالب
تصميم أمثلة مؤشرات الأداء الرئيسية
26. معدل رضا العملاء: تتيح لك الردود معرفة العملاء غير الراضين، والذين يحتاجون إلى مزيد من الاهتمام من فرق إدارة المنتجات
27. الامتثال القياسي: متوسط عدد المشكلات المتعلقة بعدم اتباع إرشادات العلامة التجارية أو العمليات أو الإجراءات 28. وقت الاستجابة: متوسط الوقت الذي يستغرقه مراجعو المشروع والمساهمون في المشروع للرد على الأسئلة والتعليقات والطلبات 29. زمن دورة الإنتاج: متوسط الوقت المستغرق لإكمال المشروع من البداية إلى النهاية 30. وقت المراجعة: متوسط عدد الجولات أو الوقت المستغرق للوصول إلى التصميم النهائي
قالب التصميم الجرافيكي الخاص ب ClickUp 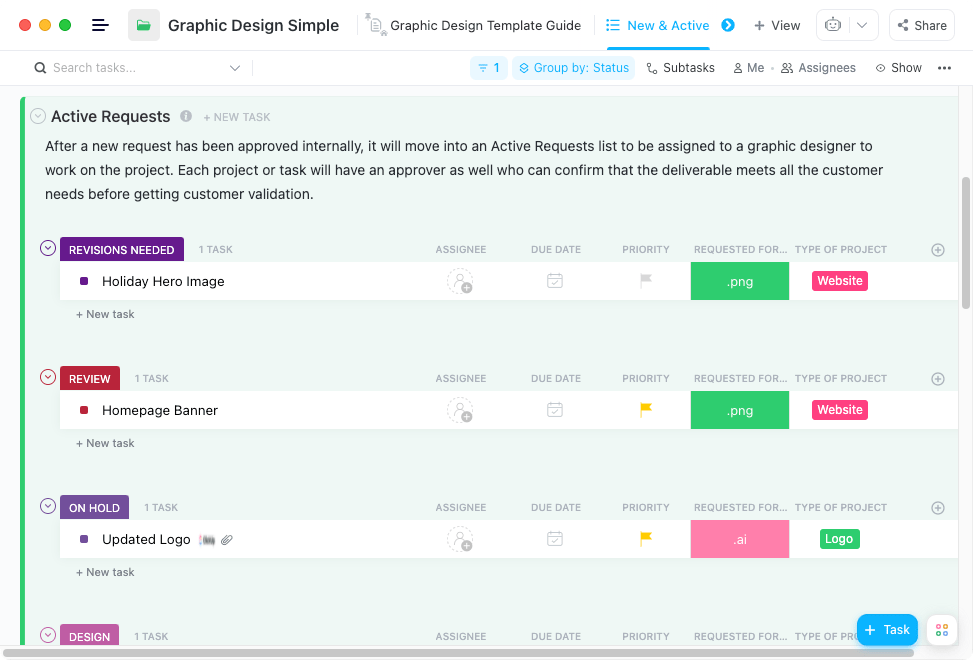
أنشئ سير عمل التصميم المثالي باستخدام قالب التصميم الجرافيكي قم بتنزيل هذا النموذج
أمثلة مؤشرات الأداء الرئيسية لبدء التشغيل
31. القيمة الدائمة للعميل: الإيرادات التي يمكن أن تتوقعها شركتك من حسابات العملاء الفردية 32. معدل التفعيل: النسبة المئوية للمستخدمين الذين يكملون أي حدث رئيسي في عملية التأهيل 33. معدل التشغيل: عدد الأشهر التي يمكن أن تعمل فيها الشركة قبل نفاد أموالها 34. متوسط طول دورة المبيعات: عدد الأيام المستغرقة لإتمام صفقة ما في المتوسط 35. الإنفاق الشهري: المبلغ النقدي الذي يتم إنفاقه شهرياً
قالب إدارة المهام في ClickUp 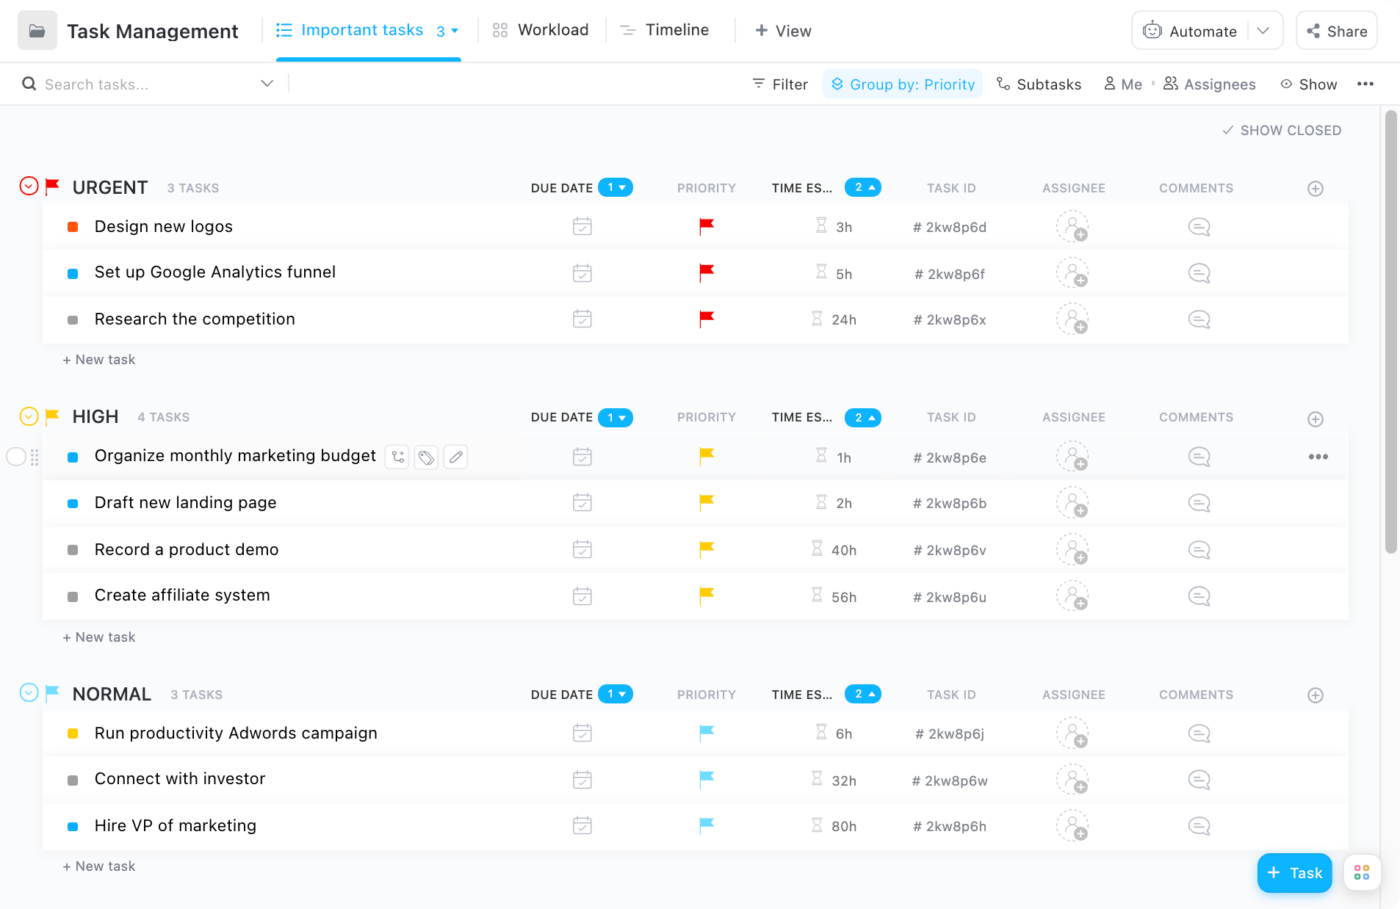
تتبع سير العمل وتحسينه بناءً على عرض النطاق الترددي للفريق باستخدام قالب إدارة المهام تنزيل هذا القالب
أمثلة مؤشرات الأداء الرئيسية للمنتج
36. صافي نقاط المروجين (NPS): الرقم الذي يشير إلى ما إذا كان المستخدمون لديك على استعداد للتوصية بمنتجك لأصدقائهم وزملائهم وما إلى ذلك.
37. تصعيد تذاكر الدعم: عدد التذاكر التي تم تحويلها إلى مدير دعم عملاء أعلى مستوى لحلها
38. معدل رضا العملاء (CSAT): معدل مقياس تجربة العميل الإجمالية مع منتج الشركة أو خدمتها أو موظفيها
39. السرعة: العدد الإجمالي للاختبارات اليدوية والآلية التي تم إجراؤها
40. اليومي نشط المستخدم: عدد المستخدمين النشطين يومياً
قالب تتبع الأخطاء والمشكلات في ClickUp 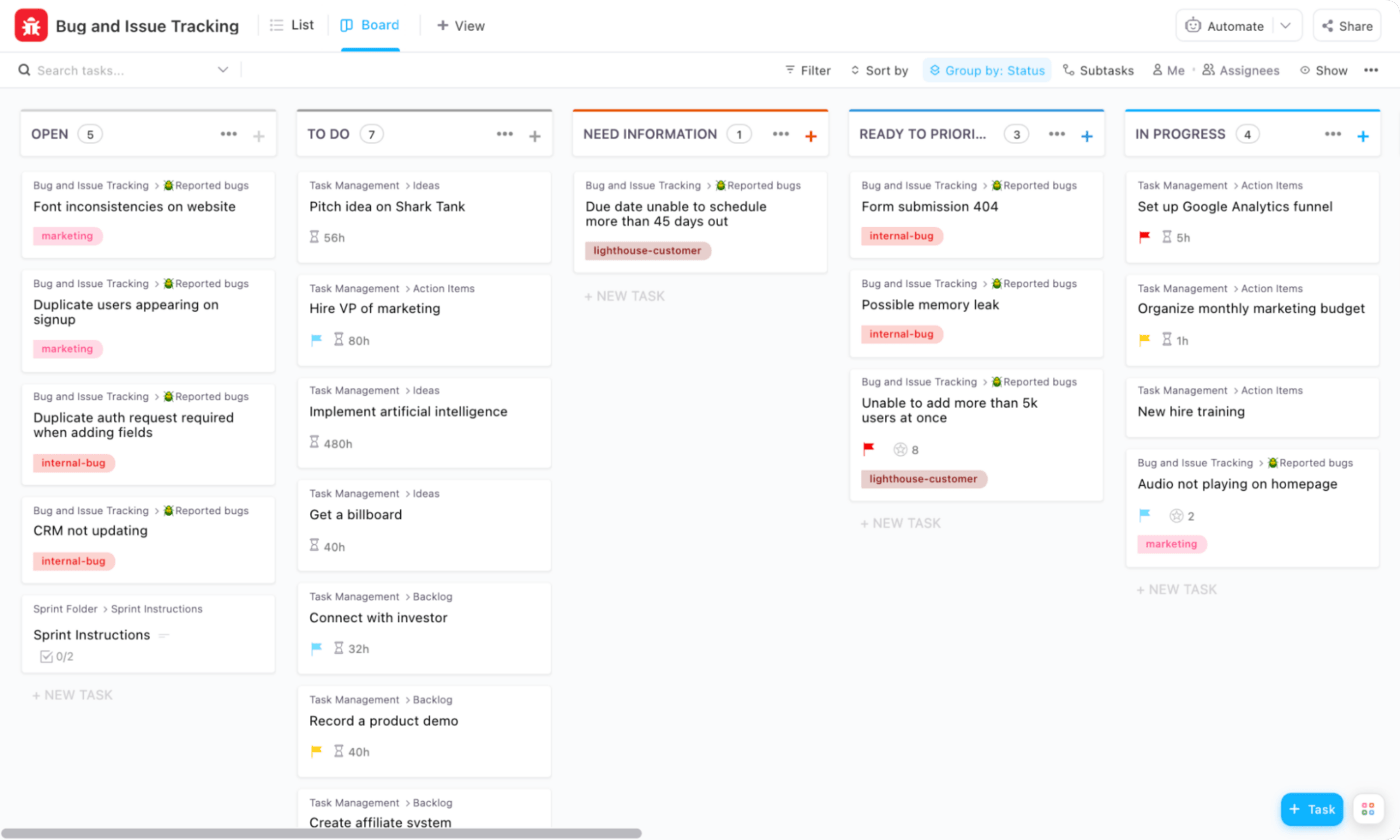
تنظيم وتخزين جميع التقارير باستخدام Bug و قالب تتبع المشكلاتتنزيل هذا القالب
أمثلة على مؤشرات الأداء الرئيسية SaaS
41. صافي نقاط المروجين (NPS): الرقم الذي يشير إلى ما إذا كان المستخدمون لديك على استعداد للتوصية بمنتجك لأصدقائهم وزملائهم وما إلى ذلك.
42. معدل نمو الإيرادات الشهرية المتكررة (MRR) على أساس شهري: النسبة المئوية للزيادة أو النقصان شهرياً في صافي الإيرادات الشهرية المتكررة
43. الإيرادات السنوية المتكررة (ARR): المبلغ المتوقع للإيرادات السنوية المكتسبة من العملاء
44. معدل الدوران: النسبة المئوية لمعدل ترك العملاء للشركة خلال فترة زمنية معينة
45. العمليات المطورة: عدد التحسينات التي تم إدخالها على العمليات التشغيلية الحالية
46. معدل سرعة الإنجاز: إجمالي عدد الاختبارات اليدوية والآلية التي تم إجراؤها
نموذج دعم العملاء الخاص ب ClickUp 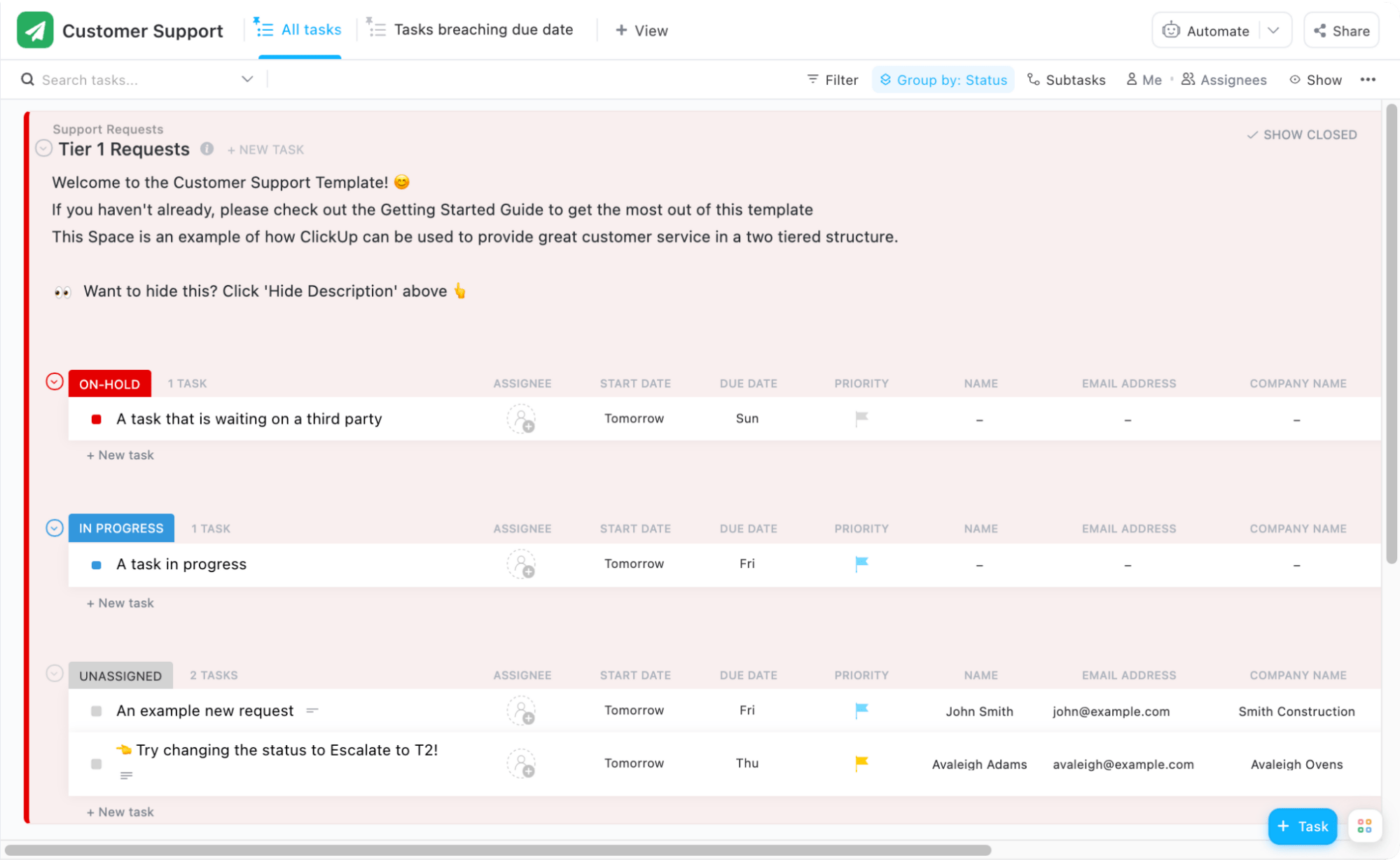
استخدم سير عمل قالب دعم العملاء ذي المستويين في قالب دعم العملاء مع فريق دعم الخط الأمامي وفريق ثانٍ للتصعيد تنزيل هذا القالب
أمثلة على مؤشرات الأداء الرئيسية للموارد البشرية
47. معدل تحويل التوظيف: النسبة المئوية لمقدمي الطلبات الذين تم توظيفهم مقابل إجمالي عدد المتقدمين الذين قمت بتجهيزهم ( تتبع مع ATS !) 48. التكلفة لكل موظف: التكلفة الإجمالية لتوظيف كل موظف (بما في ذلك تكاليف التوظيف أو التدريب أو التأهيل وغيرها من التكاليف الأخرى مؤشرات الأداء الرئيسية للموارد البشرية ) 49. متوسط تكاليف التدريب: المبلغ الذي تم إنفاقه على تدريب الموظفين وتطويرهم
50. معدل التغيب عن العمل: النسبة المئوية للموظفين المتغيبين خلال فترة زمنية معينة 51. معدل دوران الموظفين: النسبة المئوية للموظفين الذين تركوا الشركة
قالب توظيف المرشحين في ClickUp 
تنظيم رحلة كل متقدم للوظيفة والتواصل معه باستخدام قالب توظيف المرشحين تنزيل هذا القالب بمجرد الانتهاء من جمع بياناتك وقياسها، ستحتاج إلى تقديمها بتنسيق سهل الفهم. وهنا يأتي دور حل الكل في واحد مثل ClickUp لتوفير أفضل أدوات التصور!
كيفية قياس مؤشرات الأداء الرئيسية في ClickUp
بعد أن تكون مؤشرات الأداء الرئيسية والقوالب جاهزة للتتبع، فإن الخطوة التالية هي تجميعها في حل رقمي مثل ClickUp!
ClickUp عبارة عن منصة إنتاجية شاملة حيث تجتمع الفرق معًا لتخطيط العمل وتنظيمه والتعاون في العمل باستخدام المهام والمستندات والدردشة والأهداف واللوحات البيضاء وغيرها. يتيح ClickUp، الذي يسهل تخصيصه ببضع نقرات فقط، للفرق من جميع الأنواع والأحجام إنجاز العمل بفعالية أكبر، مما يرفع الإنتاجية إلى آفاق جديدة!
إليك نظرة عن كثب على السبب تحب الفرق استخدام ClickUp كمركز لتتبع الأهداف ولوحة مؤشرات الأداء الرئيسية:
قم بمواءمة المهام والأنشطة المتعلقة بمؤشرات الأداء الرئيسية مع الأهداف في ClickUp
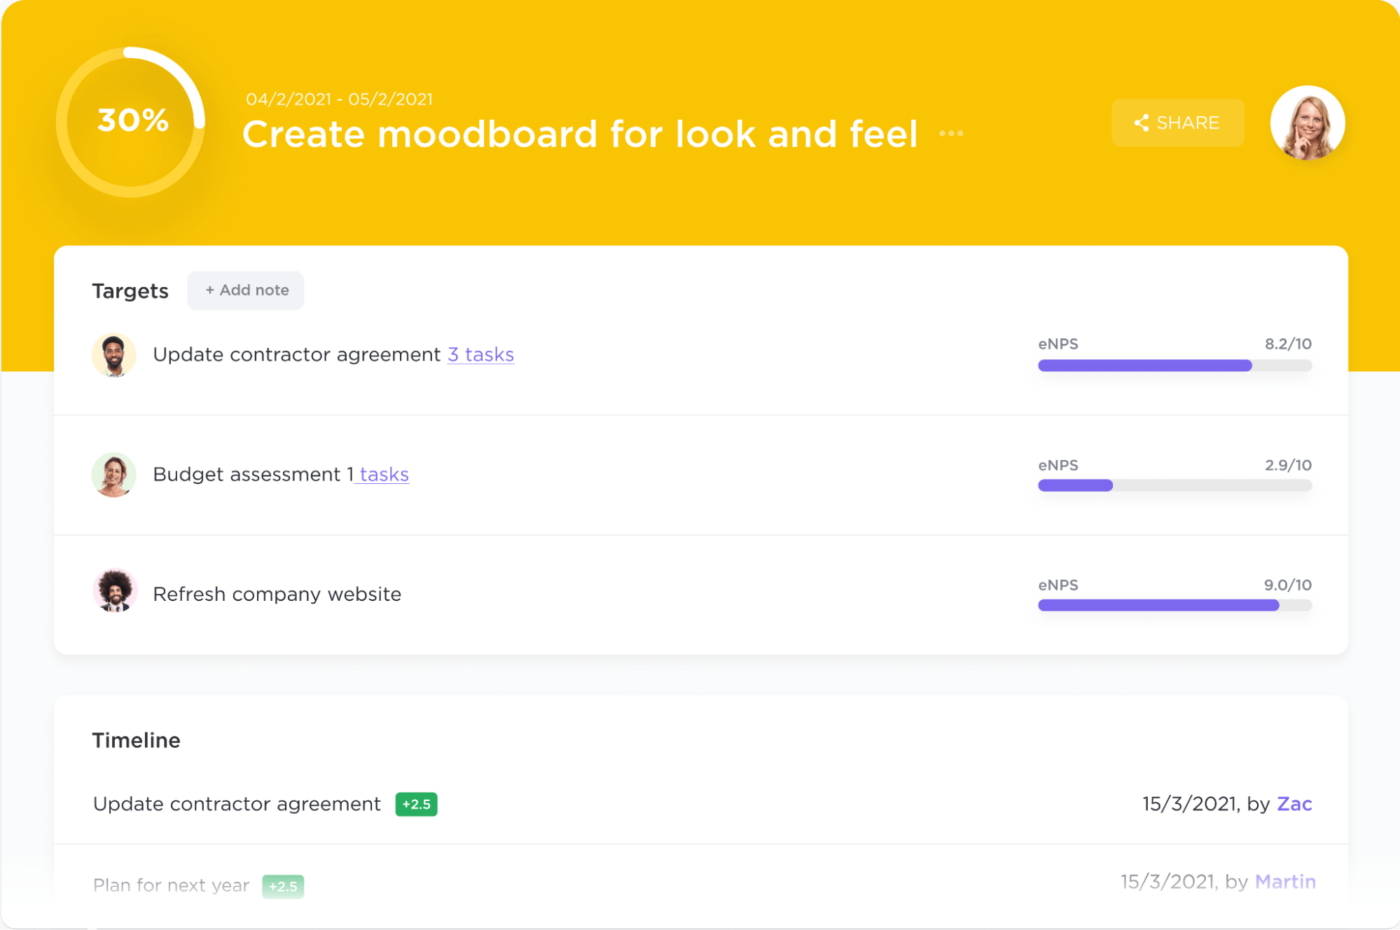
تصور النسب المئوية للتقدم المحرز لكل هدف ضمن عرض واحد الأهداف في ClickUp عبارة عن حاويات عالية المستوى مقسمة إلى أهداف أصغر. بمجرد اتخاذ إجراء على الهدف، انقر فوق اسم الهدف لتحديث تقدمك. بناءً على النوع الذي تستخدمه، سيكون للهدف خيارات تتبع مختلفة:
- رقم: إنشاء نطاق من الأرقام وتتبع الزيادة أو النقصان بينها
- صحيح/خطأ: استخدم خانة اختيار تم/لم يتم لوضع علامة على اكتمال الهدف الخاص بك
- عملة: ضع هدفًا نقديًا: حدد هدفًا نقديًا وتتبع أي زيادة أو نقصان بينهما
- مهمة: تتبع إكمال مهمة واحدة، أو قائمة كاملة. (Aتظهر الشارة في تفاصيل المهمة مع اسم الهدف المرفق))
الاستفادة من إعداد تقارير مؤشرات الأداء الرئيسية باستخدام لوحات معلومات ClickUp
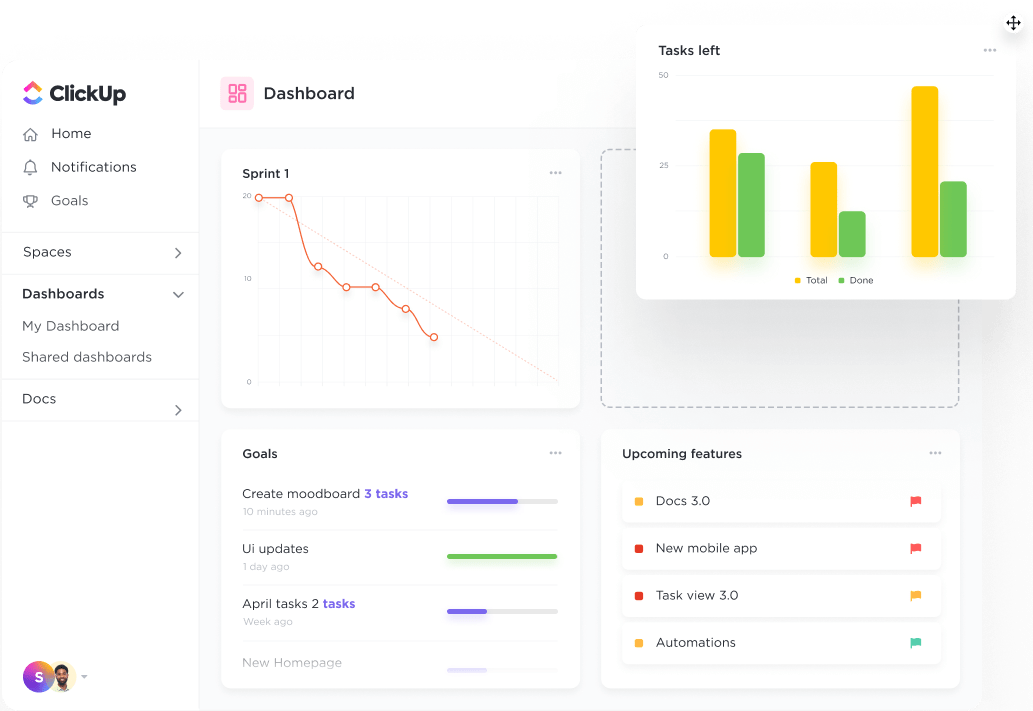
مشاركة لوحات معلومات ClickUp مع أفراد وفرق عمل وضيوف محددين باستخدام رابط عام أو خاص لوحات المعلومات في ClickUp ستحل محل التقارير الأسبوعية المتراكمة في صندوق البريد الوارد لمديرك. قم بإنشاء وعرضها والتفاعل معها من مصدر واحد للحقيقة مع جميع مؤشرات الأداء الرئيسية في المقدمة والوسط.
ولست بحاجة إلى أن تكون عالم بيانات أو مصمم جرافيك لإنشاء لوحات المعلومات في ClickUp! باستخدام إجراء السحب والإفلات، يمكنك تنظيم لوحات المعلومات الخاصة بك لتصور كيفية حدوث العمل في مساحة العمل الخاصة بك بأي طريقة تريدها.
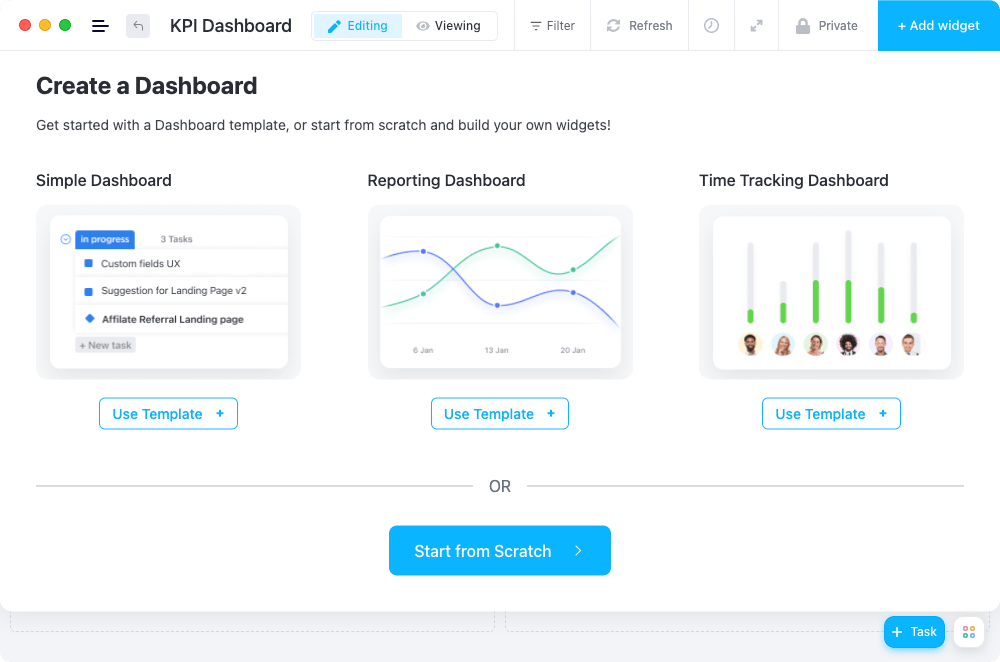
بدء تشغيل لوحة معلومات من البداية أو استخدام قالب ClickUp
الأسئلة الشائعة حول مؤشرات الأداء الرئيسية
ما هي فوائد تتبع مؤشرات الأداء الرئيسية كفريق؟
تساعد مؤشرات الأداء الرئيسية على تحديد معايير واضحة وقابلة للقياس للنجاح، مما يسمح للفرق بالعمل على تحقيق أهداف محددة مع قياس التقدم المحرز باستمرار. يوفر هذا للفرق إحساسًا بالتوجيه والتركيز والهدف، مما قد يؤدي إلى زيادة المشاركة والتحفيز.
كيف تختار مؤشرات الأداء الرئيسية للفريق؟
يعتمد اختيار مؤشرات الأداء الرئيسية المناسبة على غرض الفريق وأهدافه وغاياته. في حين أنه لا يوجد نهج واحد يناسب الجميع، يمكن للفريق تحديد مؤشرات الأداء الرئيسية من خلال النظر في أهدافه وغاياته، وتحليل أدائه السابق، والنظر في العوامل الخارجية التي قد تؤثر على أدائه.
ماذا أفعل إذا لم يحقق فريقي أهداف مؤشرات الأداء الرئيسية؟
إذا كان فريقك لا يحقق أهداف مؤشرات الأداء الرئيسية، يجب عليك أولاً محاولة تحديد السبب الجذري للمشكلة . قد يتضمن ذلك توفير تدريب وموارد ودعم إضافي لأعضاء الفريق. بالإضافة إلى ذلك، يجب مراجعة مؤشرات الأداء الرئيسية ومراجعتها للتأكد من أنها قابلة للتحقيق وذات صلة وواقعية.
تتبّع أرقامك بثقة في ClickUp
أين يحقق الفريق تقدماً في مؤشرات الأداء الرئيسية أو يتجاوزها أو لا يحرز تقدماً في مؤشرات الأداء الرئيسية؟ مع برنامج مؤشرات الأداء الرئيسية ، توجد الجداول الزمنية لمؤشرات الأداء الرئيسية وإعداد التقارير في موقع مركزي، بحيث يمكن لأي شخص استرداد البيانات بسرعة وفهم أين هم وأين يجب أن يكونوا.
من السهل أن تضيع في البيانات لساعات لإنشاء تقرير مؤشر أداء رئيسي من صفحة واحدة. هذه هي الطريقة القديمة للإنتاجية.
أما الطريقة الصحيحة برنامج KPI سيبسط عملية إعداد التقارير ويمنحك المزيد من الوقت للتركيز على المناقشات والأنشطة الاستراتيجية.
استمر في ركوب موجة النمو، وإذا كنت بحاجة إلى أداة تصفح مضادة للفشل، فإن ClickUp يدعمك! ابدأ بتتبع مؤشرات الأداء الرئيسية في ClickUp

