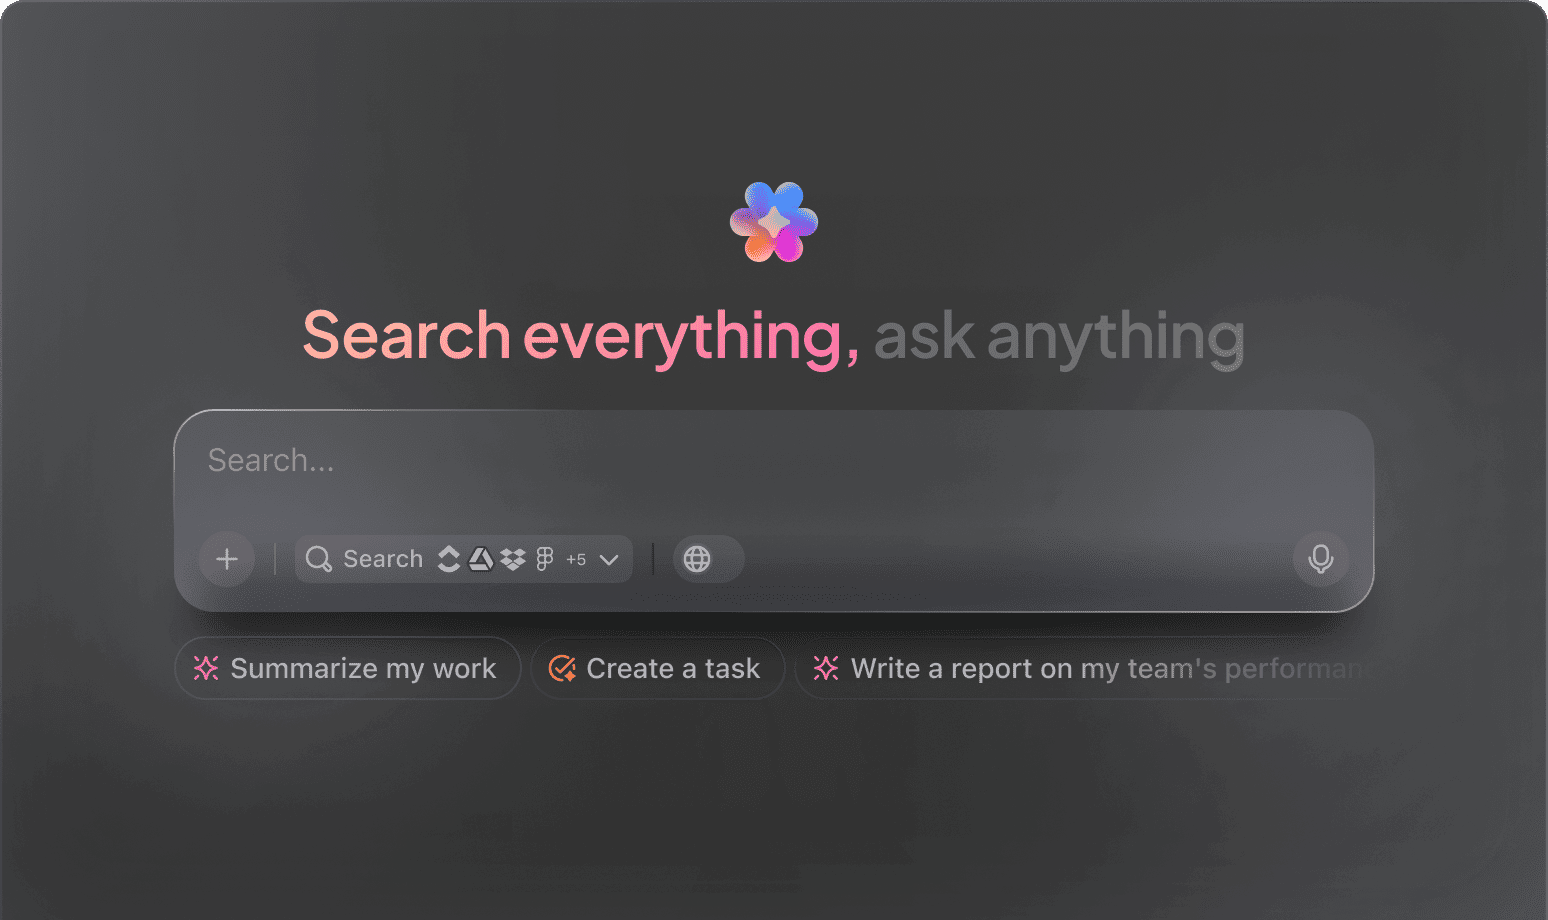
AI-Powered Infographic Creation
Top AI Prompts for Crafting Infographics with ClickUp Brain
Design compelling visuals, organize your data effortlessly, and elevate your infographic projects using ClickUp Brain's intelligent assistance.
Trusted by the world’s leading businesses
AI Empowering Infographic Design
Revolutionizing Infographic Creation with AI Prompts in ClickUp Brain
Crafting compelling infographics goes beyond visuals—it's about organizing complex data into clear stories.
From gathering data points to designing layouts, selecting color schemes, and finalizing content, infographic creation demands juggling multiple elements and tight schedules. AI prompts are now a vital part of this process.
Teams leverage AI to:
- Quickly identify key data insights and relevant visual styles
- Generate initial draft layouts and content summaries with minimal effort
- Break down complex statistics into digestible narratives
- Transform scattered notes into structured plans, checklists, or project tasks
Integrated into familiar tools like documents, whiteboards, and task managers, AI in platforms such as ClickUp Brain acts as a silent partner—turning creative ideas into well-organized, actionable projects.
ClickUp Brain Compared to Conventional AI
Discover Why ClickUp Brain Stands Apart
Integrated, context-savvy, and instantly accessible—ClickUp Brain lets you focus on creating, not explaining.
Conventional AI Solutions
- Constantly toggling between apps to collect info
- Repeating your infographic goals with every query
- Receiving generic, irrelevant suggestions
- Hunting through multiple platforms for a single asset
- Interacting with AI that lacks understanding
- Manually switching between different AI engines
- Merely an add-on in your browser
ClickUp Brain
- Deeply connected to your projects, notes, and team progress
- Tracks your infographic objectives and past inputs
- Delivers insightful, tailored guidance
- Searches seamlessly across all your resources
- Supports voice commands with Talk to Text
- Automatically selects the optimal AI model: GPT, Claude, Gemini
- Dedicated Mac & Windows app designed for efficiency
Infographic Creation Prompts
15 Powerful AI Prompts for Crafting Infographics with ClickUp Brain
Elevate your infographic workflow—conceptualize, design, and refine with ease.

Identify 5 innovative visual themes for an infographic on renewable energy adoption, drawing from the ‘GreenTech 2025’ report.
Use Case: Accelerates creative brainstorming by leveraging existing research.
ClickUp Brain Behaviour: Analyzes linked documents to extract key themes and suggests fresh infographic concepts.

What are the latest layout trends for data visualization in environmental reports under 10 pages?
Use Case: Guides designers toward impactful and current infographic styles.
ClickUp Brain Behaviour: Combines insights from internal style guides and external trend data to inform design choices.

Draft a concise infographic brief focused on minimalist design principles, referencing ‘Design Guidelines #7’ and previous project notes.
Use Case: Ensures alignment between creative and content teams on design objectives.
ClickUp Brain Behaviour: Extracts relevant notes and compiles a structured brief for the design team.

Summarize infographic effectiveness metrics comparing two recent campaigns using our ‘Campaign Analytics Q2’ doc.
Use Case: Supports data-driven decisions without manual report analysis.
ClickUp Brain Behaviour: Pulls key performance indicators and summarizes comparative insights.

List top color palettes and icon sets used in high-impact infographics, referencing design asset libraries and style guides.
Use Case: Helps designers select proven visual elements for consistency.
ClickUp Brain Behaviour: Scans internal resources to identify frequently used assets and their application notes.

From the ‘Infographic QA’ doc, generate a detailed checklist for reviewing infographic accuracy and clarity.
Use Case: Streamlines quality assurance with standardized review steps.
ClickUp Brain Behaviour: Extracts criteria and formats them into a task-ready checklist.

Summarize 3 emerging interaction trends in digital infographics from recent UX research.
Use Case: Keeps designs innovative and user-focused.
ClickUp Brain Behaviour: Identifies recurring patterns and insights from linked UX studies.

From the ‘Millennial Engagement Survey’ doc, summarize key preferences for infographic styles and content.
Use Case: Aligns design strategies with target audience expectations.
ClickUp Brain Behaviour: Analyzes survey data to highlight common themes and preferences.

Write engaging and clear captions for infographic sections using the tone guidelines in ‘BrandVoice.pdf’.
Use Case: Accelerates content creation while maintaining brand voice.
ClickUp Brain Behaviour: References tone documents to generate varied caption options.

Summarize recent data privacy regulations affecting infographic data sourcing and presentation.
Use Case: Ensures compliance with evolving legal standards.
ClickUp Brain Behaviour: Reviews linked compliance documents and highlights key changes impacting design.

Generate layout and labeling standards for infographics targeting the European market, referencing regional compliance docs.
Use Case: Guarantees adherence to local design and legal requirements.
ClickUp Brain Behaviour: Extracts relevant rules and compiles them into a practical checklist.

Create an accessibility checklist for infographics based on WCAG 2.1 standards and internal guidelines.
Use Case: Helps teams design inclusive and compliant visuals.
ClickUp Brain Behaviour: Identifies key accessibility criteria and organizes them into actionable review points.

Compare infographic styles and engagement metrics across top competitors using internal analysis reports.
Use Case: Informs design improvements through benchmarking.
ClickUp Brain Behaviour: Summarizes competitive data into clear, actionable insights.

What infographic design trends are emerging in the sustainability sector since 2023?
Use Case: Guides R&D teams in adopting forward-thinking visual strategies.
ClickUp Brain Behaviour: Synthesizes trends from research notes, reports, and concept briefs.

Summarize key usability issues reported in recent infographic user testing sessions.
Use Case: Drives targeted improvements based on real user input.
ClickUp Brain Behaviour: Extracts and prioritizes feedback from surveys, notes, and tagged tickets.
Create Visuals Effortlessly with ClickUp Brain
Cut down revisions, unify your team, and produce compelling infographics using AI-powered processes.


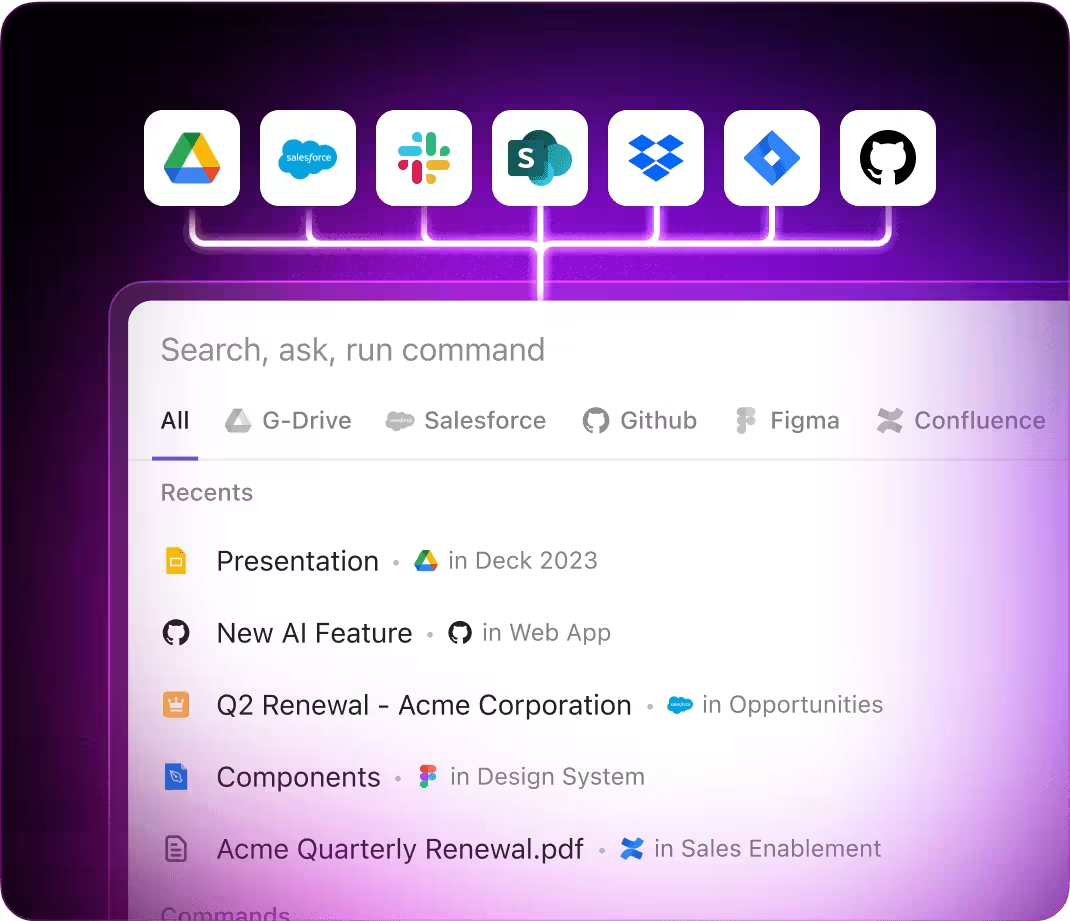
AI Applications
Leading 3 Ways AI Prompts Enhance Infographic Creation with ClickUp Brain
Boost your infographic production speed, enhance precision, and discover innovative ideas using AI
From Ideas to Visual Masterpieces
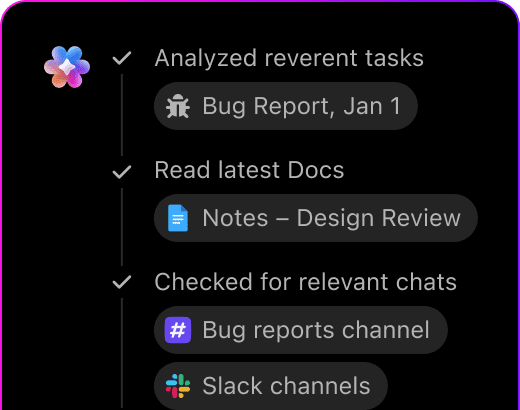
Initial infographic concepts usually start as fragmented thoughts and disorganized scribbles. ClickUp Brain organizes these into clear, collaborative design outlines—right inside ClickUp Docs.
Leverage ClickUp Brain to:
- Convert scattered draft notes into polished infographic templates
- Produce fresh concepts informed by previous project details (using context-sensitive AI writing)
- With Brain Max, instantly explore past infographic projects, critiques, and asset libraries to inspire your next creation.
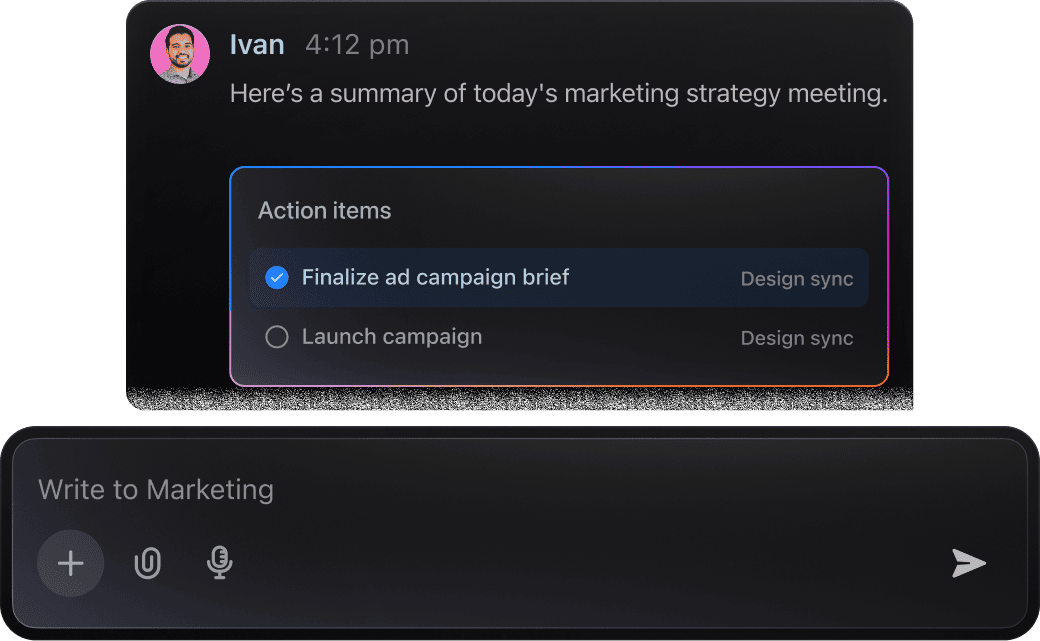
From Concepts to Code
Technical teams often juggle complex documentation and detailed feedback. ClickUp Brain simplifies this by pinpointing key tasks, highlighting risks, and crafting next steps directly from your notes.
Leverage ClickUp Brain to:
- Condense lengthy design conversations captured in tasks or Docs
- Convert detailed sketches and annotations into actionable engineering assignments
- Automatically create defect logs or project handoff briefs
- With Brain Max, instantly retrieve past design choices, component analyses, or development dialogues across your workspace—eliminating tedious searches through technical files.
Infographic Creation with ClickUp Brain
Crafting compelling infographics involves managing data sources, design elements, and storytelling flow. ClickUp Brain simplifies this process by extracting key points and drafting engaging visual narratives that align with your brand.
Leverage ClickUp Brain to:
- Analyze raw data and highlight essential statistics
- Produce concise, impactful captions tailored for each infographic section
- Convert collaborative feedback into clear design revisions or task assignments
- Brain Max enhances this by effortlessly referencing past infographic projects or related content, supporting consistent quality throughout extended campaigns.
Advantages of AI
How AI Prompts Revolutionize Infographic Creation Processes
Harnessing AI-driven prompts enhances every phase of your infographic projects:
- Kick off creativity: Transition swiftly from rough concepts to polished visuals and detailed outlines
- Minimize revisions: Detect design mismatches early by reviewing previous drafts and input
- Align your team: AI-crafted summaries and documents ensure everyone stays informed
- Make informed choices: Generate insights on market trends and compliance with targeted prompts
- Innovate boldly: Unlock fresh perspectives that push beyond standard infographic templates.
All these capabilities integrate directly within ClickUp, turning your AI-generated content into actionable docs, tasks, and dashboards that drive your projects forward.
Prompt Guidance
Crafting Effective Prompts for Infographic Creation
Clear prompts unlock compelling visuals.

Clarify the infographic's focus
Vague prompts yield unclear visuals. Specify the infographic type (e.g., "process flowchart" or "data comparison"), the key message (e.g., "market trends in 2024" or "steps in product launch"), and the intended audience (e.g., "marketing team" or "executive board").
Example: "Design a timeline infographic illustrating the product development cycle for tech startups."

Use comparative prompts to highlight contrasts
AI excels at drawing distinctions. Frame prompts like "compare A vs B" to showcase differences in data sets, design styles, or performance metrics.
Example: "Compare customer satisfaction rates between Q1 and Q2 in a bar chart format."

Approach prompts as targeted tasks
Think about the exact infographic goal. Instead of "Create an infographic," specify the desired outcome:
Example: "Generate a step-by-step infographic outlining the onboarding process for new hires, emphasizing clarity and engagement."

Request structured infographic elements
Need a list, flow diagram, or segmented chart? Clearly state the format to guide AI's response.
Example: "Provide 6 key statistics for a pie chart with brief explanations for each segment."
Accelerate Your Infographic Creation with ClickUp Brain
ClickUp Brain goes beyond organizing tasks—it’s your creative partner throughout the entire infographic design process.


