Dependencies
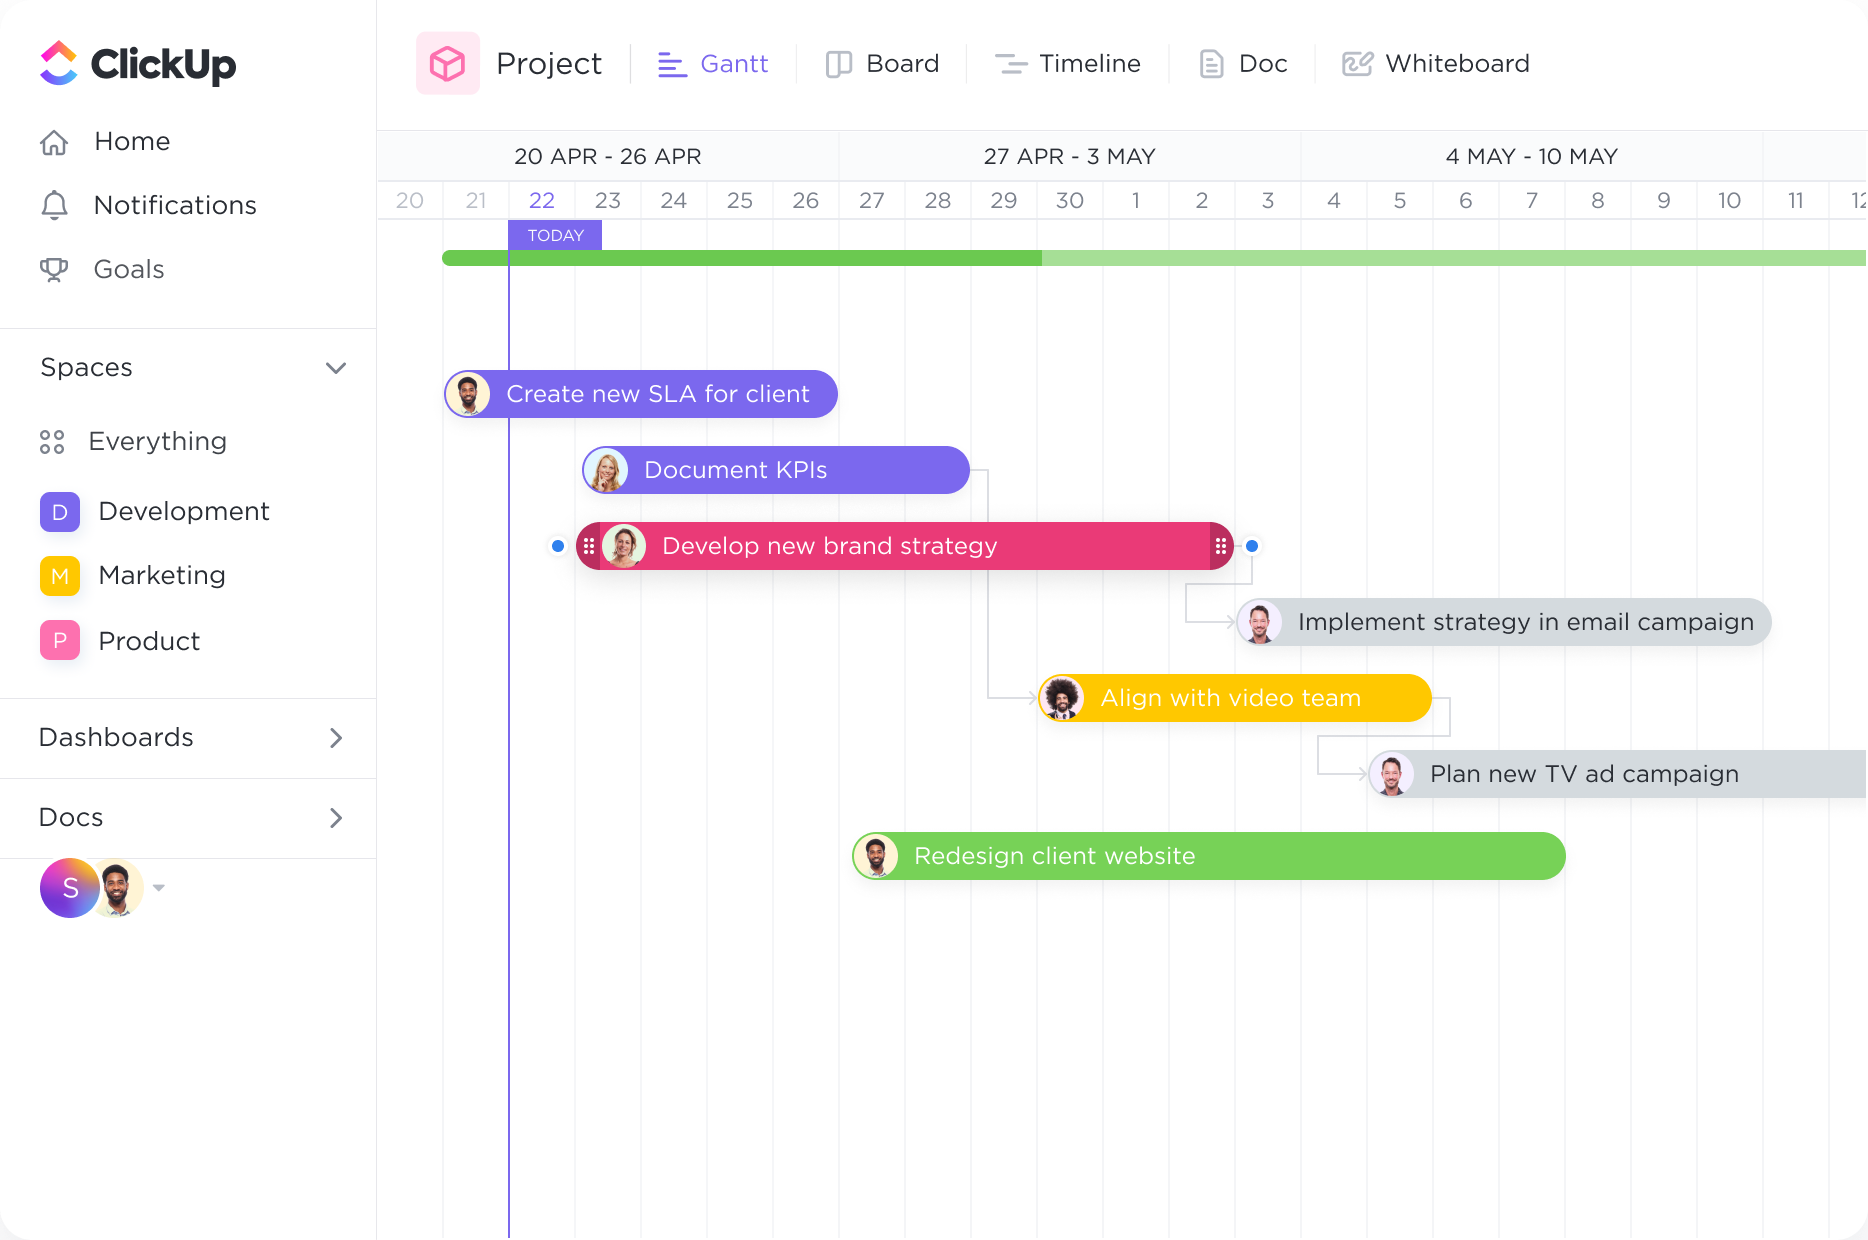
Set task dependencies.
Create tasks and link them with dependencies. Dragging a task with dependencies will automatically reschedule tasks in the chain
Gantt Charts
Supercharge your wildlife research projects with ClickUp's powerful Gantt Chart software. Plan, track, and manage your fieldwork with ease as you utilize dynamic Gantt Charts designed specifically for wildlife researchers. Seamlessly visualize tasks, dependencies, and timelines, ensuring smooth collaboration and efficient project execution. Take control of your research process and achieve remarkable results with ClickUp's Gantt Chart software.
Free forever. No credit card.

Dependencies
Create tasks and link them with dependencies. Dragging a task with dependencies will automatically reschedule tasks in the chain
Tracking
Intelligent dependency-path tracking shows you where potential bottlenecks might exist to prevent inefficiencies.
Planning and scheduling are critical components of wildlife research. A Gantt chart offers a visual outline of the project divided into manageable phases such as fieldwork, data collection, analysis, and reporting. This setup aids in setting realistic timelines, highlighting key milestones, and promoting punctual progress throughout the research journey.
Wildlife research often involves collaboration among multiple researchers and field assistants. By leveraging a Gantt chart, tasks can be specifically assigned to team members, delineating clear roles and responsibilities. This facilitates efficient workload distribution, fosters accountability, and supports synchronous progress, ultimately contributing to a streamlined collaborative effort.
Effective management of resources and equipment is crucial in wildlife research projects. Gantt charts aid in the careful scheduling of such assets, helping to prevent overlaps in usage and ensuring accessibility when needed. By doing so, they help avoid potential delays and contribute to the meticulous execution of the research plan.
Wildlife research projects often operate under tight deadlines and require adherence to various milestones. Incorporating these milestones and deadlines within a Gantt chart ensures that all team members are cognizant of these critical dates. This approach encourages timely decision-making and task prioritization, aligning project objectives with scheduled timelines.
Wildlife research projects are often influenced by unpredictable field conditions, such as weather patterns or animal behavior. Updating the Gantt chart to reflect real-time progress and field observations allows for the agile adaptation of timelines and tasks. This flexibility enhances the project's resilience to unexpected challenges, ensuring a cohesive approach to achieving research goals.
A Gantt chart can help wildlife researchers keep track of multiple research projects and their respective timelines, ensuring that tasks and deadlines are properly coordinated.
By visualizing the tasks and milestones of each research project in a Gantt chart, wildlife researchers can see where resources and personnel are needed and make informed decisions about allocation.
A Gantt chart can help wildlife researchers plan and track fieldwork activities, ensuring that data collection is done in a timely manner and that researchers are able to meet their research goals.
A Gantt chart can highlight dependencies between tasks and identify potential bottlenecks in the research process, allowing researchers to prioritize and allocate resources accordingly.
A Gantt chart can serve as a central platform for collaboration, allowing research team members to track their individual tasks, coordinate efforts, and ensure alignment with overall project timelines.
A Gantt chart can be shared with stakeholders, such as funding agencies or conservation organizations, to provide a clear visual representation of project progress, milestones, and potential delays.
Gantt chart software can help wildlife researchers effectively manage their projects by providing a visual representation of project timelines, tasks, and dependencies. It allows for efficient scheduling, resource allocation, and tracking of project progress. This enables researchers to prioritize tasks, identify potential bottlenecks, and ensure timely completion of project milestones. Additionally, it facilitates collaboration and communication among team members, enhancing overall project coordination and efficiency.
There is no specific Gantt chart software that is widely used and recommended specifically by wildlife researchers. However, there are several popular and user-friendly Gantt chart software options available that can be customized to meet the specific needs of wildlife researchers, such as Microsoft Project, Smartsheet, and Asana.
Yes, Gantt chart software can be used to track and monitor the progress of multiple wildlife research projects simultaneously. It provides a visual representation of project timelines, tasks, and dependencies, allowing for easy monitoring of project progress and identifying any potential scheduling conflicts. This enables efficient resource allocation, facilitates communication among team members, and enhances decision-making to ensure the successful completion of multiple wildlife research projects.