Overview
Manage all of your projects in one place.
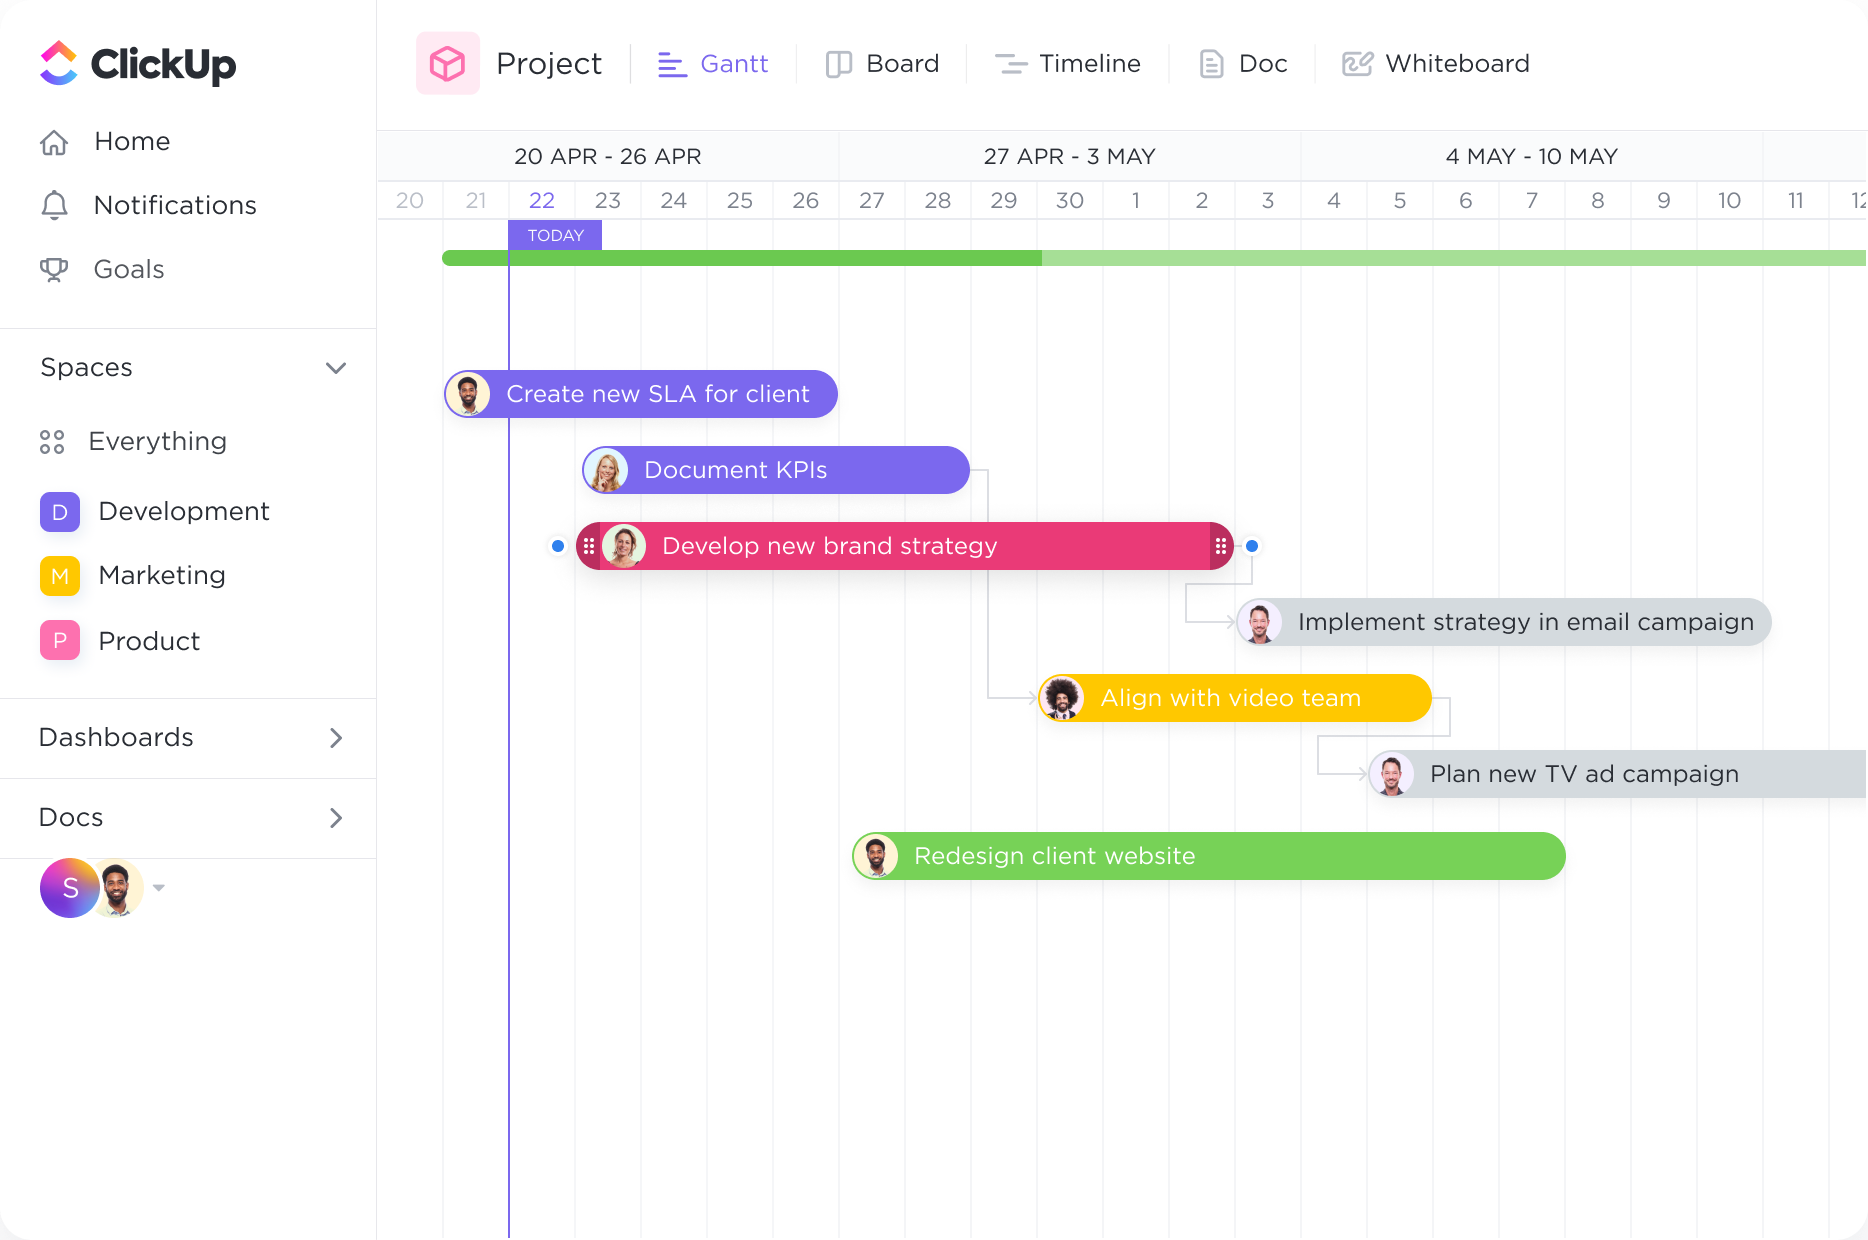
Get a bird's-eye view of all Spaces, Projects, Lists, and tasks in one Gantt chart. With clear coloring options, you can easily see what work is happening and where.

Gantt Charts
Streamline your web design projects with ClickUp's powerful Gantt Chart software. Create and customize Gantt Charts specifically designed for web designers, allowing you to stay organized and on track with ease. Visualize your project timeline, assign tasks, track progress, and collaborate seamlessly with your team all in one intuitive platform. Take control of your web design projects and maximize productivity with ClickUp's Gantt Chart software.
Free forever. No credit card.

Overview
Get a bird's-eye view of all Spaces, Projects, Lists, and tasks in one Gantt chart. With clear coloring options, you can easily see what work is happening and where.

Activity
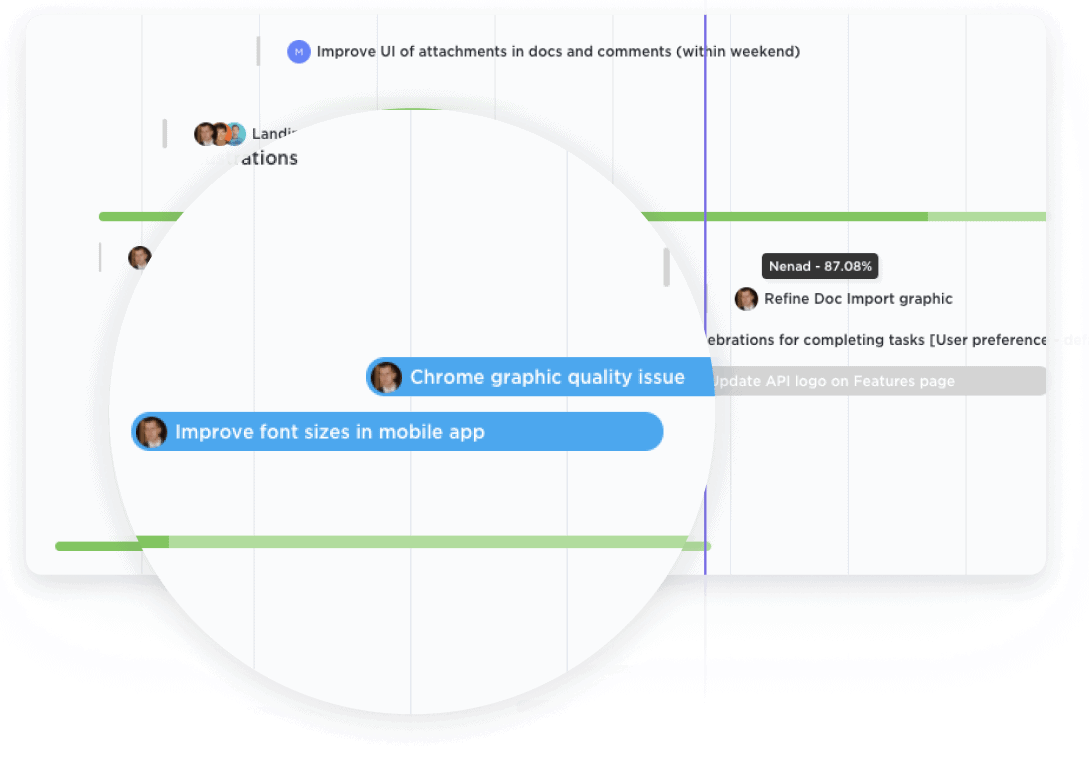
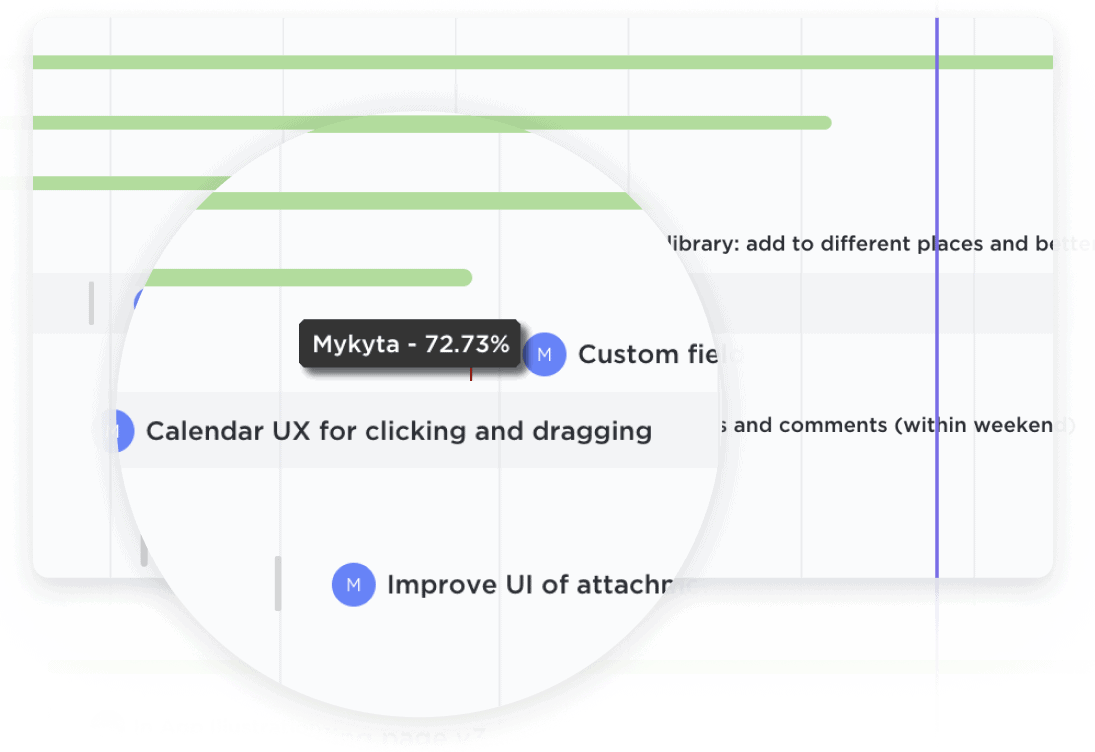
Easily update projects with a simple drag-and-drop action to collaborate amongst your team in real-time. Dynamic progress percentages provide a detailed snapshot.

Web designers can use Gantt charts to effectively manage website development projects. By visualizing project timelines, deadlines, and milestones, designers can plan and track the progress of various tasks involved in creating a website. This includes wireframing, designing, coding, content creation, testing, and deployment. Gantt charts help ensure that all aspects of the project are completed on time and in a coordinated manner.
Web design projects often require collaboration among designers, developers, content creators, and other team members. Gantt charts allow designers to allocate tasks among team members and track progress collectively. By clearly defining responsibilities and deadlines, Gantt charts promote efficient workload distribution, enhance accountability, and facilitate seamless collaboration.
In web design projects, efficient resource allocation is crucial to ensure that designers have the necessary tools, software, and support to complete their tasks. Gantt charts help designers manage and optimize the use of resources such as personnel, equipment, and software licenses. By visualizing resource availability and scheduling, designers can avoid bottlenecks, prevent resource conflicts, and ensure that the project progresses smoothly.
Gantt charts are valuable tools for planning and managing the launch of a website. Designers can use Gantt charts to outline the schedule for website preparation, execution, and post-launch activities. This includes tasks such as domain registration, hosting setup, content migration, SEO optimization, and quality assurance testing. Gantt charts help designers stay organized, track progress, and ensure a successful website launch. Additionally, Gantt charts can be used for ongoing website maintenance, allowing designers to schedule regular updates, backups, and security checks.
A Gantt chart can help web designers keep track of multiple projects by displaying their timelines, tasks, and deadlines in a visual format, allowing for efficient resource allocation and project prioritization.
A Gantt chart can serve as a collaborative tool for web design teams, enabling team members to see the progress of individual tasks and identify dependencies, ensuring smooth coordination and timely completion of projects.
A Gantt chart can clearly display project milestones and deadlines, helping web designers stay on track and ensure that important deliverables and client expectations are met.
By visualizing the schedule and workload of each team member in a Gantt chart, web designers can easily identify potential bottlenecks or resource constraints, enabling them to allocate resources more effectively and avoid delays.
A Gantt chart can be shared with clients to provide a visual representation of the project timeline, allowing web designers to communicate progress, identify potential delays, and manage client expectations effectively.
By analyzing the dependencies and durations of tasks in a Gantt chart, web designers can identify opportunities to optimize project timelines and allocate resources more efficiently, leading to improved productivity and project outcomes.
Gantt chart software can help web designers in effectively managing their projects by visually mapping out the project timeline, tasks, and dependencies. It enables better resource allocation, identifies potential bottlenecks, and facilitates communication among team members. This allows for efficient project coordination, improved time management, and enhanced decision-making for web designers.
Gantt chart software can assist web designers in managing their projects and meeting deadlines by providing a visual representation of the project timeline, tasks, and dependencies. This allows designers to track progress, identify potential bottlenecks, and make necessary adjustments to ensure timely completion of tasks. It also facilitates collaboration and communication among team members, ensuring efficient resource allocation and coordination.
Yes, Gantt chart software for web designers can integrate with other project management tools and platforms, allowing for seamless collaboration and data synchronization across different software systems.