Dependencies
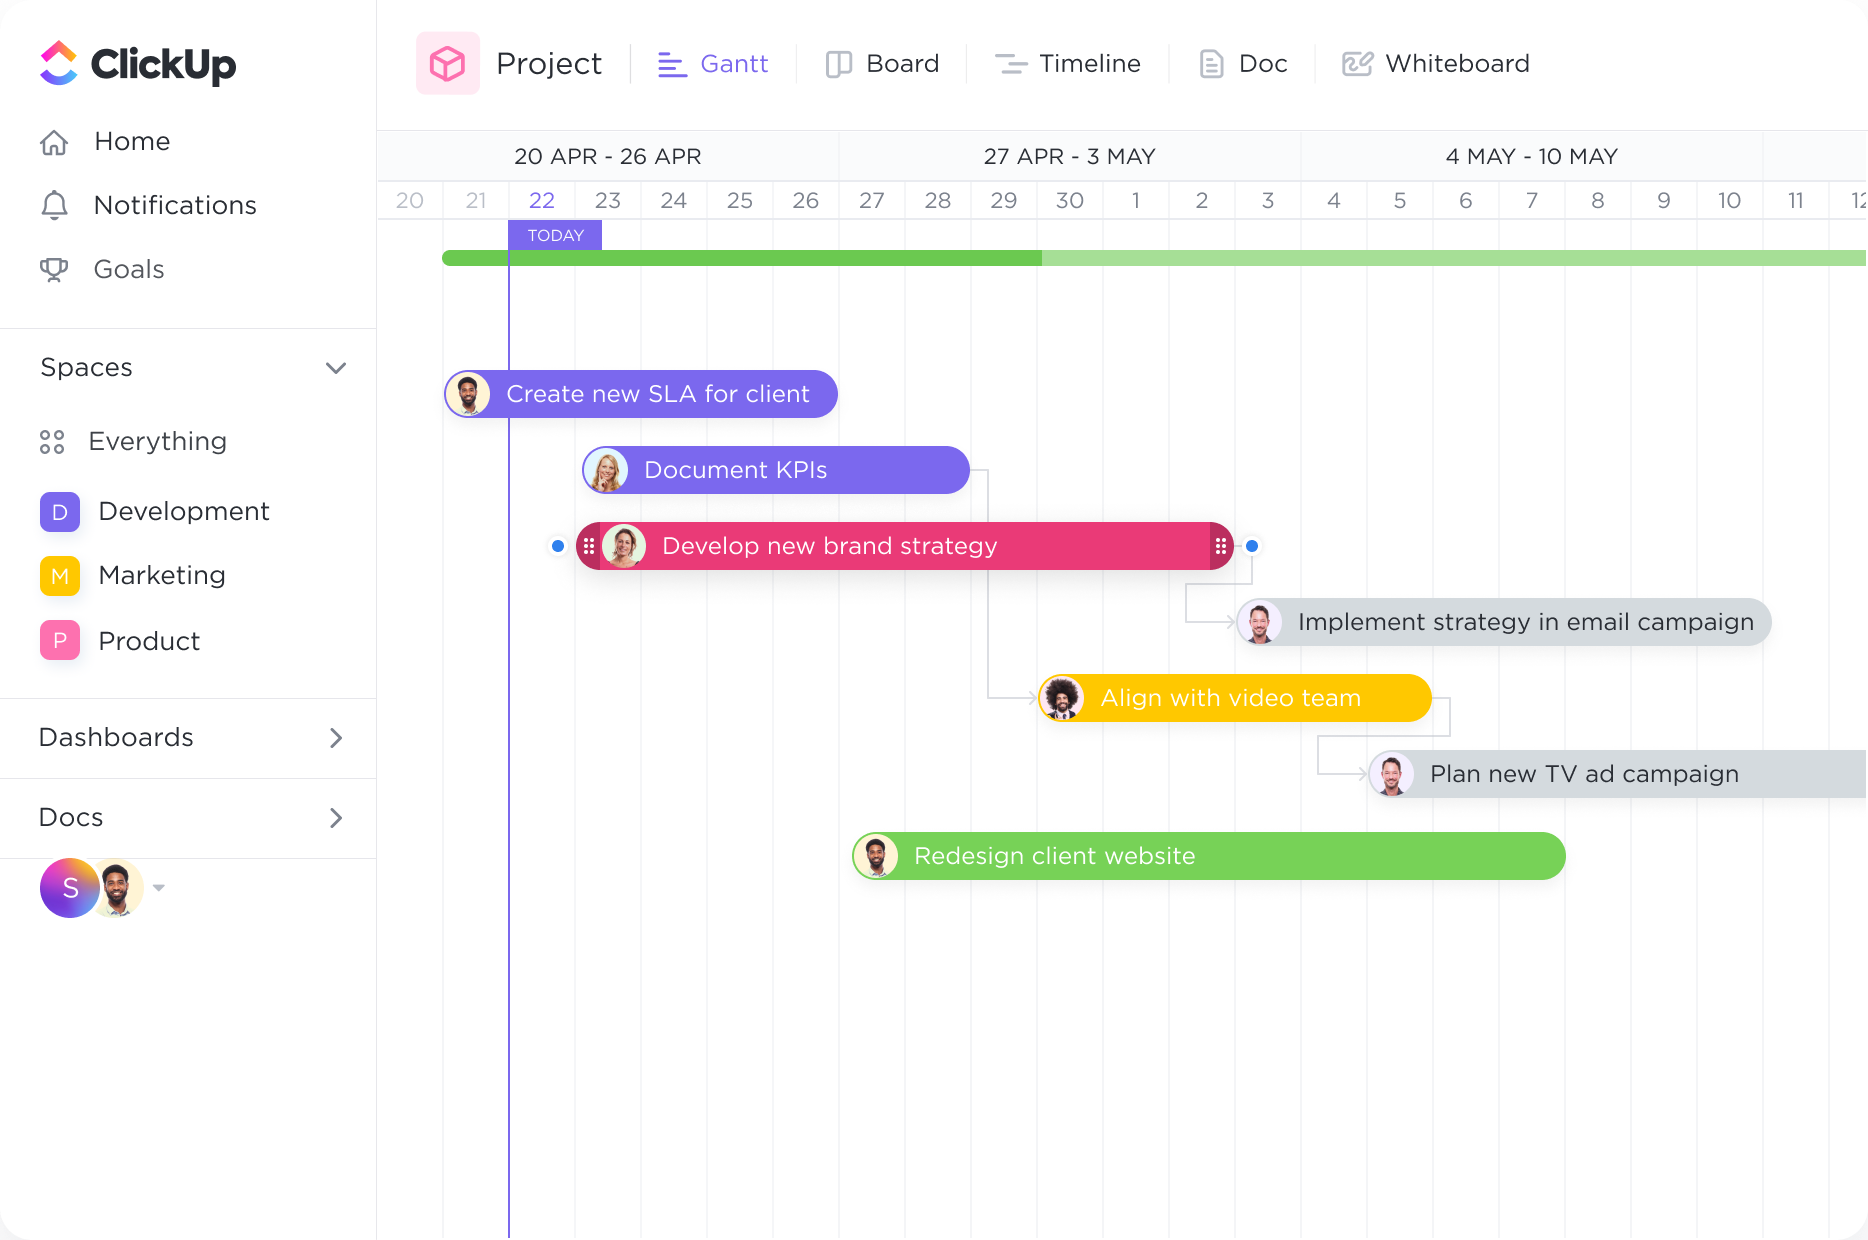
Set task dependencies.
Create tasks and link them with dependencies. Dragging a task with dependencies will automatically reschedule tasks in the chain
Gantt Charts
Elevate your trade analysis game with ClickUp's powerful Gantt Chart software. Streamline your workflow and effortlessly track project progress with dynamic visual representations. Plan, organize, and execute your trade strategies like a pro, all within ClickUp's intuitive interface. Stay on top of deadlines, manage resources efficiently, and make informed decisions with ease. Take your trade analysis to new heights with ClickUp's tailored Gantt Chart software.
Free forever. No credit card.

Dependencies
Create tasks and link them with dependencies. Dragging a task with dependencies will automatically reschedule tasks in the chain
Overview
Get a bird's-eye view of all Spaces, Projects, Lists, and tasks in one Gantt chart. With clear coloring options, you can easily see what work is happening and where.

Gantt charts are invaluable tools for trade analysts to manage and visualize the timelines, deadlines, and milestones of their analysis projects. By breaking down the project into phases such as data collection, data analysis, and report generation, analysts can effectively plan and track their progress, ensuring that each step is completed in a timely manner.
Trade analysis often requires collaboration among a team of analysts. Gantt charts provide a clear overview of tasks and responsibilities, making it easy to allocate work among team members. This promotes efficient collaboration, ensures accountability, and allows for the seamless coordination of efforts, ultimately leading to more accurate and comprehensive trade analysis.
Effective resource allocation is crucial in trade analysis, where resources such as data sources, software tools, and human capital are involved. Gantt charts help trade analysts manage and optimize the use of these resources by visualizing their availability and scheduling their utilization. This ensures that resources are allocated efficiently, avoiding bottlenecks and maximizing productivity.
Trade analysis projects often have specific milestones and deadlines that need to be met. Gantt charts enable trade analysts to track these milestones and deadlines, ensuring that the project stays on schedule. By visualizing these key dates, analysts can prioritize their tasks, make informed decisions, and ensure that the analysis is completed within the designated timeframe.
Trade analysis involves inherent risks and uncertainties that can impact project timelines and outcomes. Gantt charts allow trade analysts to identify potential risks and plan for contingencies. By visualizing the critical path and dependencies between tasks, analysts can assess the impact of potential risks, develop mitigation strategies, and adjust the project plan accordingly, ensuring a more robust and resilient trade analysis process.
Gantt charts serve as powerful communication tools for trade analysts when reporting progress and updates to stakeholders. These visual representations of the project timeline and tasks provide a clear and concise overview of the analysis process. By sharing Gantt charts with stakeholders, trade analysts can effectively communicate project status, demonstrate progress, and manage expectations, fostering transparency and trust.
A Gantt chart can help trade analysts keep track of multiple trade projects with different timelines, allowing them to allocate resources and prioritize tasks efficiently.
Trade projects often have tasks that depend on the completion of other tasks. A Gantt chart can clearly display these dependencies, helping analysts understand the critical path and ensure that tasks are completed in the right order.
By visualizing the timeline of trade tasks and milestones, a Gantt chart can help analysts identify any delays or bottlenecks in the project, enabling them to take corrective actions and keep the project on track.
A Gantt chart can serve as a central platform for collaboration, allowing trade analysts to assign tasks, set deadlines, and track the progress of their team members' work, ensuring effective coordination and efficient workflow.
Trade analysts often need to adhere to strict regulatory deadlines. A Gantt chart can help them plan and manage their tasks in a way that ensures compliance with these deadlines, reducing the risk of penalties or non-compliance.
A Gantt chart can be shared with stakeholders to provide a visual representation of the trade project's timeline, progress, and milestones. This helps analysts effectively communicate project status, manage expectations, and address any concerns or questions from stakeholders.
Gantt chart software can help trade analysts in planning and tracking trade activities, visualizing timelines and dependencies, identifying potential bottlenecks, and ensuring efficient resource allocation. It also facilitates collaboration and communication among team members, enhances decision-making, and enables real-time monitoring of trade progress and performance.
Yes, Gantt chart software can be integrated with other project management tools commonly used by trade analysts, such as task management systems, collaboration platforms, and resource management software. This integration allows for seamless data synchronization and enhances communication and collaboration among team members, improving overall project efficiency and effectiveness.
Gantt chart software can help trade analysts by providing a visual representation of project timelines, dependencies, and stakeholders. This allows for better coordination and communication among team members, ensuring that everyone is aware of project progress and responsibilities. The software also enables the identification of potential bottlenecks and delays, facilitating proactive adjustments and resource allocation. Overall, it enhances trade project management by streamlining workflows and ensuring efficient collaboration among multiple stakeholders.