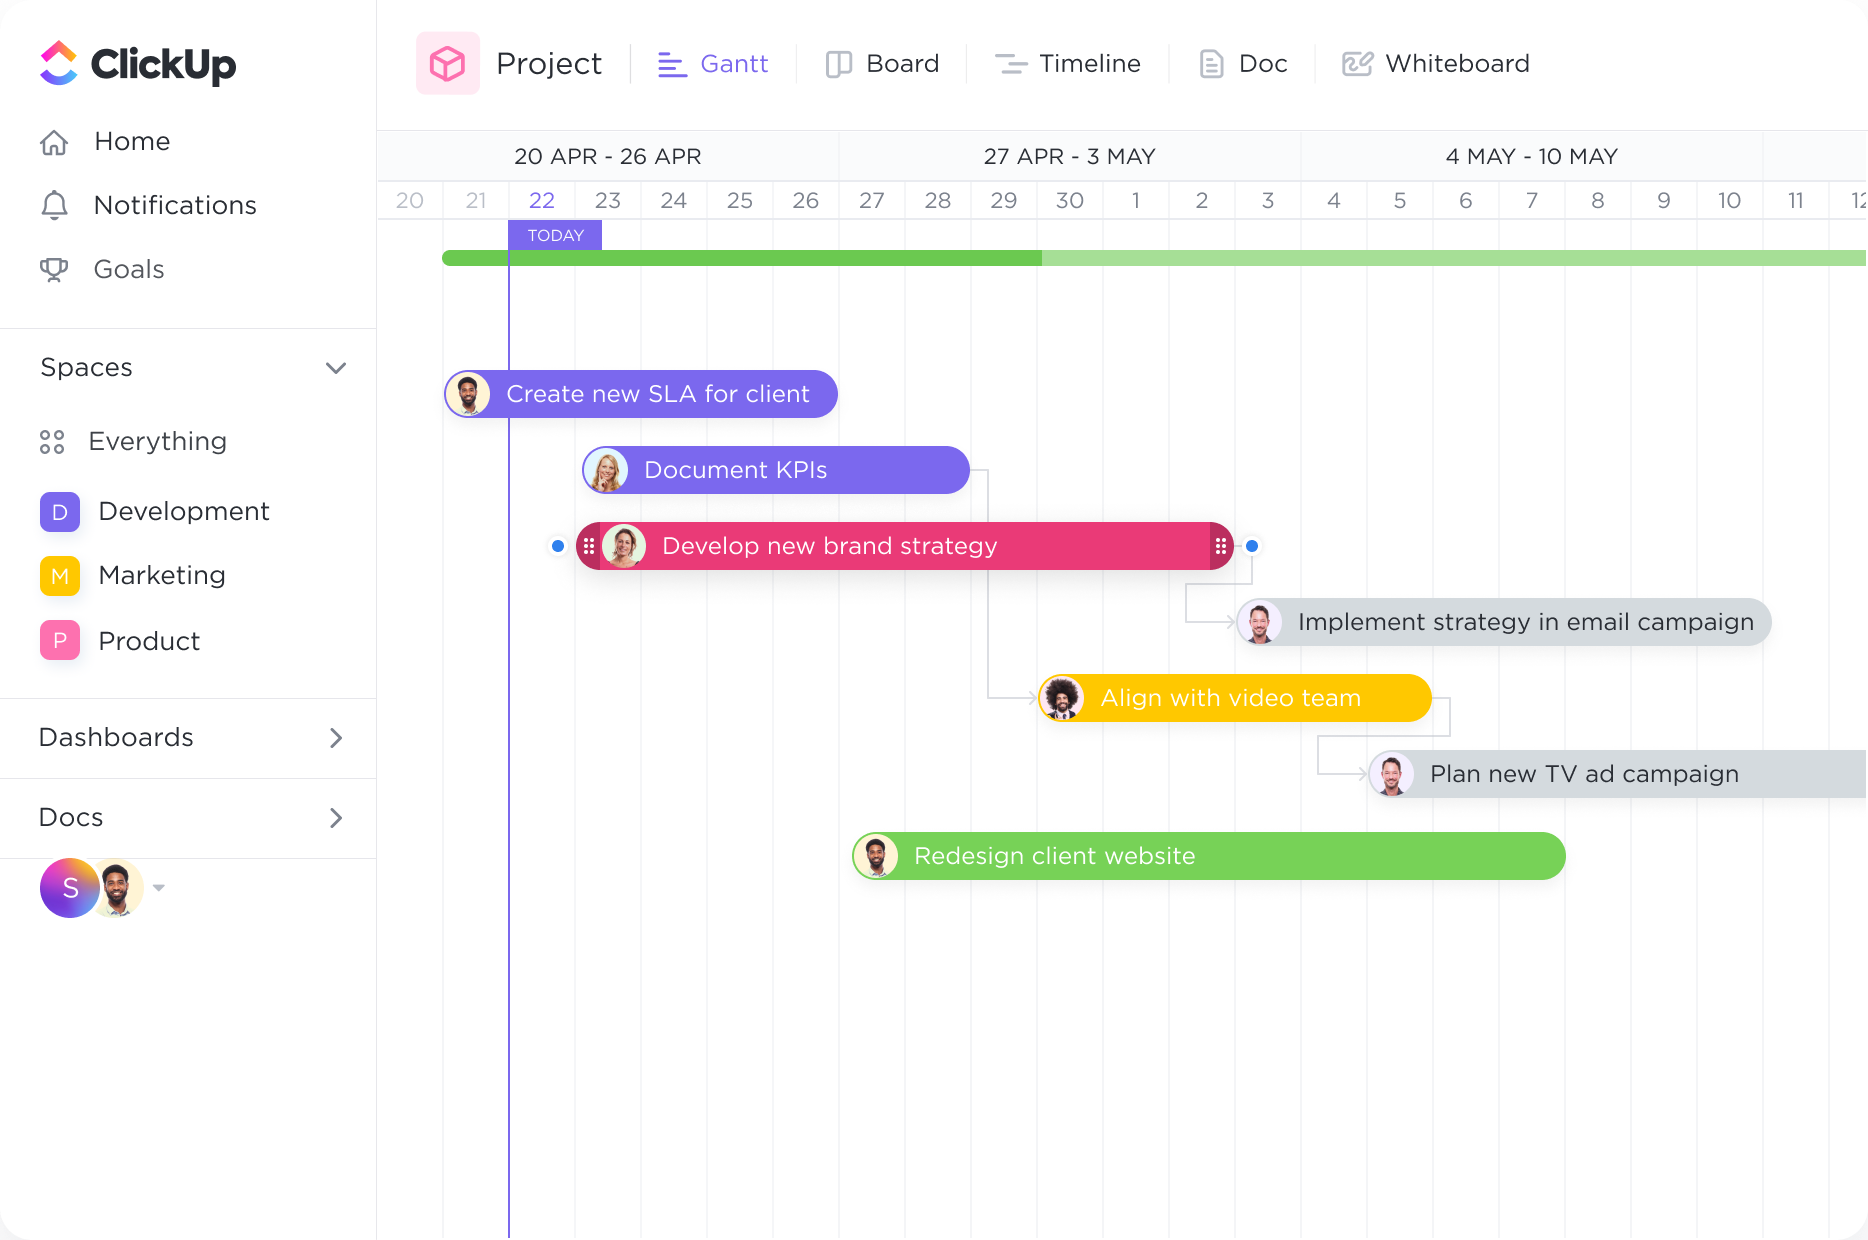
Timelines
Stay ahead of every deadline.
With the Gantt chart's dynamic timeline, you can easily schedule tasks, keep up with project progress, manage deadlines, and handle bottlenecks.
Gantt Charts
Create customized Gantt Charts specifically designed for survey experts with ClickUp. Streamline your project planning process and stay on top of all your survey milestones with our intuitive software. Easily visualize project timelines, allocate resources, and track progress to ensure efficient and successful survey execution. Try ClickUp today and take your survey management to the next level.
Free forever. No credit card.

Timelines
With the Gantt chart's dynamic timeline, you can easily schedule tasks, keep up with project progress, manage deadlines, and handle bottlenecks.
Tracking
Intelligent dependency-path tracking shows you where potential bottlenecks might exist to prevent inefficiencies.
Survey experts often need to plan and schedule their projects to ensure efficient data collection. A Gantt chart can be used to outline the various stages of the survey process, including questionnaire development, participant recruitment, data collection, and analysis. This visual representation helps survey experts set realistic timelines, allocate resources effectively, and track progress throughout the project.
Survey projects often involve collaboration among a team of survey experts. A Gantt chart can be used to assign specific tasks to team members, ensuring clear roles and responsibilities. This promotes efficient workload distribution, facilitates collaboration, and allows for seamless progress tracking. With a Gantt chart, survey experts can easily identify any bottlenecks or delays, enabling them to take timely action and keep the project on track.
Managing resources and budgets is crucial for survey experts to ensure the successful execution of their projects. Gantt charts can help survey experts allocate resources, such as personnel, equipment, and funds, effectively. By visualizing the resource allocation and budgetary constraints, survey experts can make informed decisions, prevent resource conflicts, and optimize the use of available resources. This contributes to the overall efficiency and cost-effectiveness of the survey project.
Survey projects often have specific milestones and deadlines that need to be met. A Gantt chart allows survey experts to incorporate these milestones and deadlines, providing a clear overview of the project timeline. By visualizing the critical dates, survey experts can prioritize tasks, identify potential bottlenecks, and ensure that the project progresses according to the planned schedule. This helps survey experts stay on track and deliver results within the expected timeframe.
A Gantt chart can help survey experts effectively schedule and track the progress of multiple survey projects, ensuring that resources are allocated appropriately and deadlines are met.
A Gantt chart provides a visual representation of the survey timeline, allowing survey experts to easily identify key milestones and track the progress of each phase of the survey process.
A Gantt chart can serve as a central platform for collaboration, enabling survey experts to assign tasks to team members, track their progress, and ensure that everyone is aligned with the overall survey timeline.
By visualizing the individual tasks and dependencies in a Gantt chart, survey experts can quickly identify any potential bottlenecks or delays that may occur during the survey process, allowing them to take proactive measures to address these issues.
A Gantt chart can be shared with clients to provide a clear visual representation of the survey timeline, allowing survey experts to communicate progress, milestones, and any potential delays in a transparent and easily understandable manner.
A Gantt chart can help survey experts monitor the availability and allocation of resources, such as surveyors, equipment, or technology, ensuring that they are utilized efficiently and effectively throughout the survey projects.
A Gantt chart is a visual tool that displays project tasks, timelines, and dependencies. In survey projects, it can be used to plan and schedule survey activities, allocate resources, and track progress. It helps survey managers to identify potential bottlenecks, adjust timelines, and ensure efficient coordination among team members, resulting in improved survey planning and execution.
Yes, you can import survey data into Gantt chart software to track progress and timelines. This allows you to incorporate survey results into your project plan and visualize the impact on timelines and milestones.
Yes, Gantt chart software allows for seamless collaboration with team members and stakeholders on survey projects. It provides a centralized platform where everyone can access and contribute to the project timeline, tasks, and progress. This facilitates communication, coordination, and feedback exchange, ensuring effective collaboration and alignment between all project participants.