Dependencies
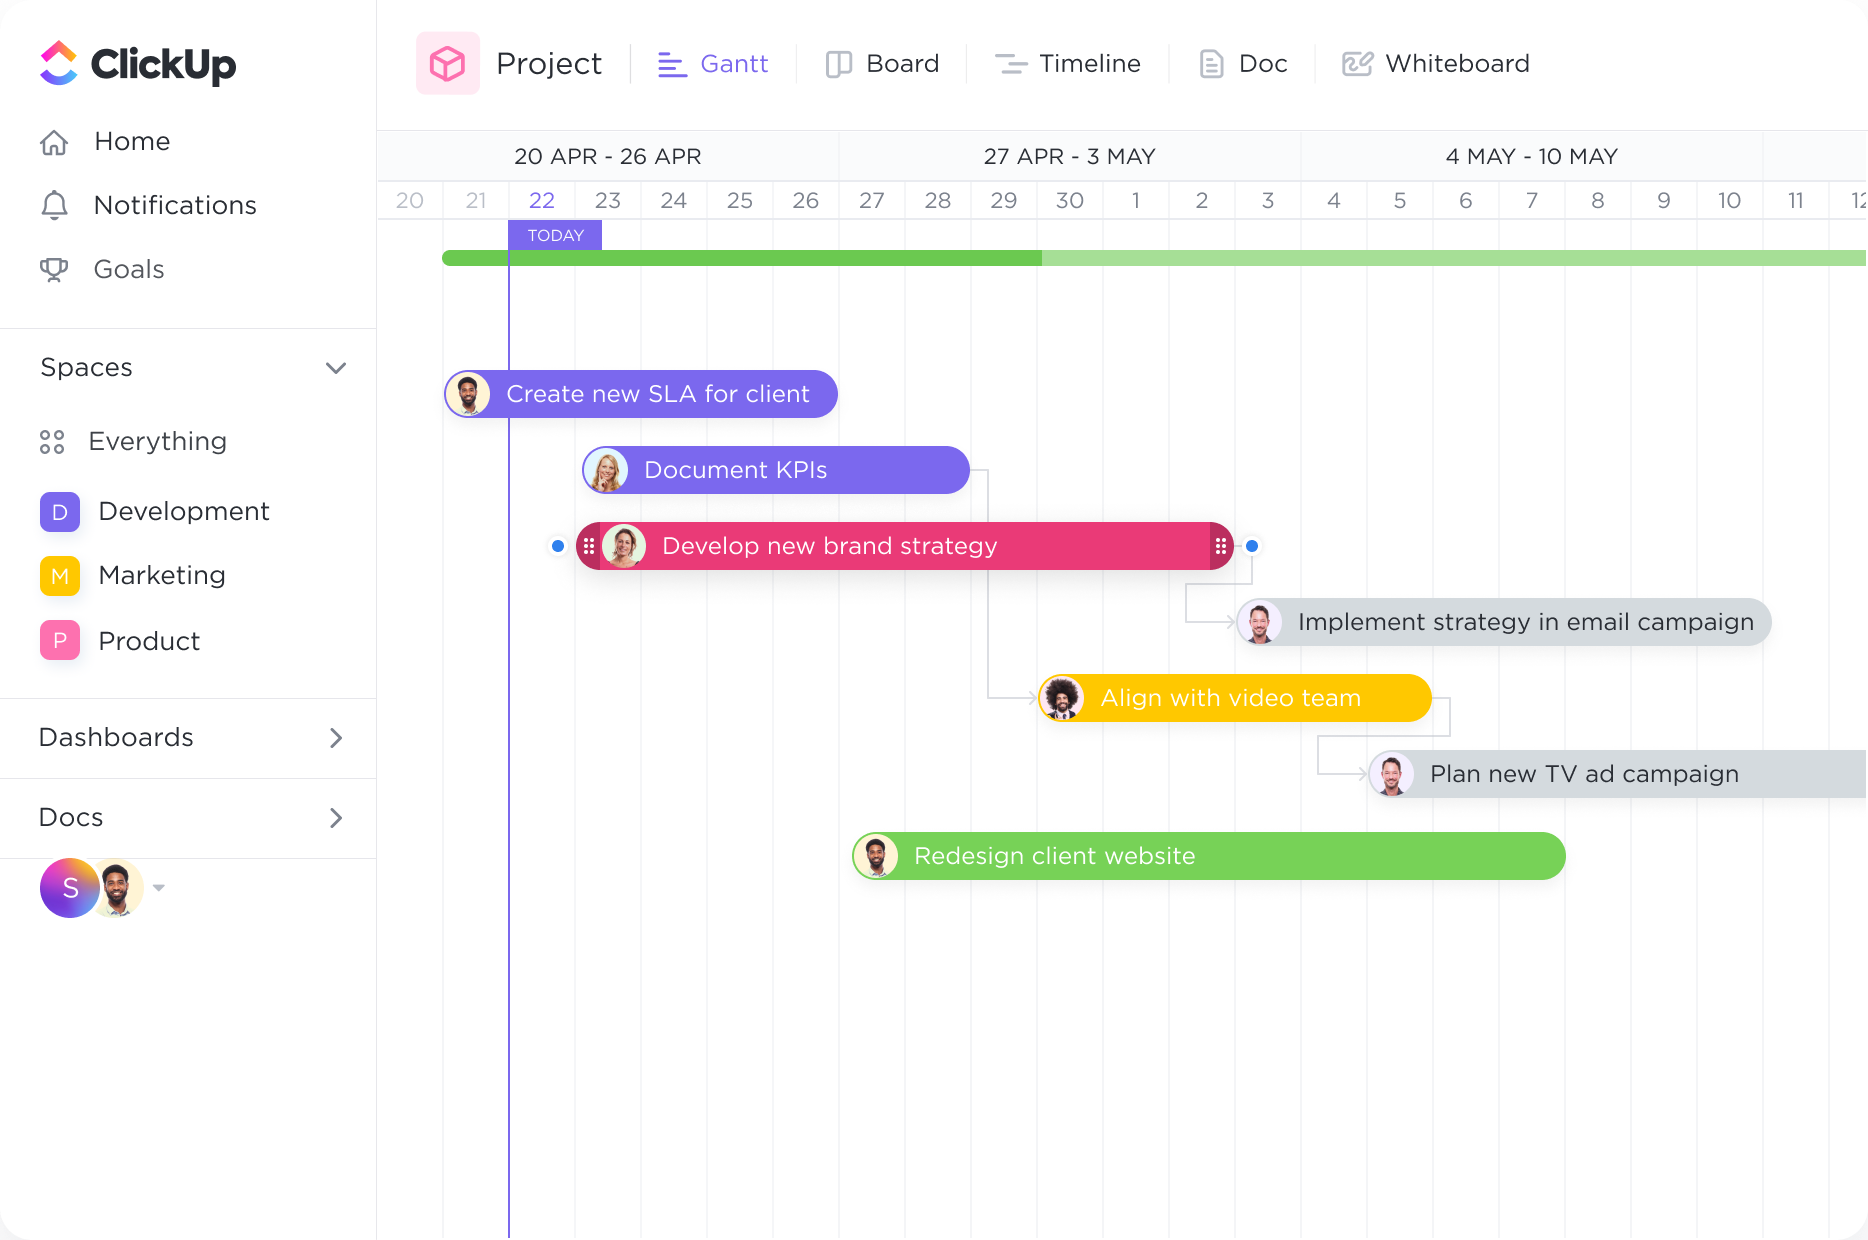
Set task dependencies.
Create tasks and link them with dependencies. Dragging a task with dependencies will automatically reschedule tasks in the chain
Gantt Charts
Streamline your project management process with ClickUp's Gantt Chart Software designed specifically for reporters. Plan, track, and visualize your tasks with ease, ensuring efficient collaboration and timely delivery of your news stories. With ClickUp, you can easily create and customize Gantt Charts to fit your unique workflow, empowering you to stay organized, meet deadlines, and produce high-quality reports. Say goodbye to the hassle of manual scheduling and embrace the power of ClickUp's Gantt Chart Software for reporters.
Free forever. No credit card.

Dependencies
Create tasks and link them with dependencies. Dragging a task with dependencies will automatically reschedule tasks in the chain
Overview
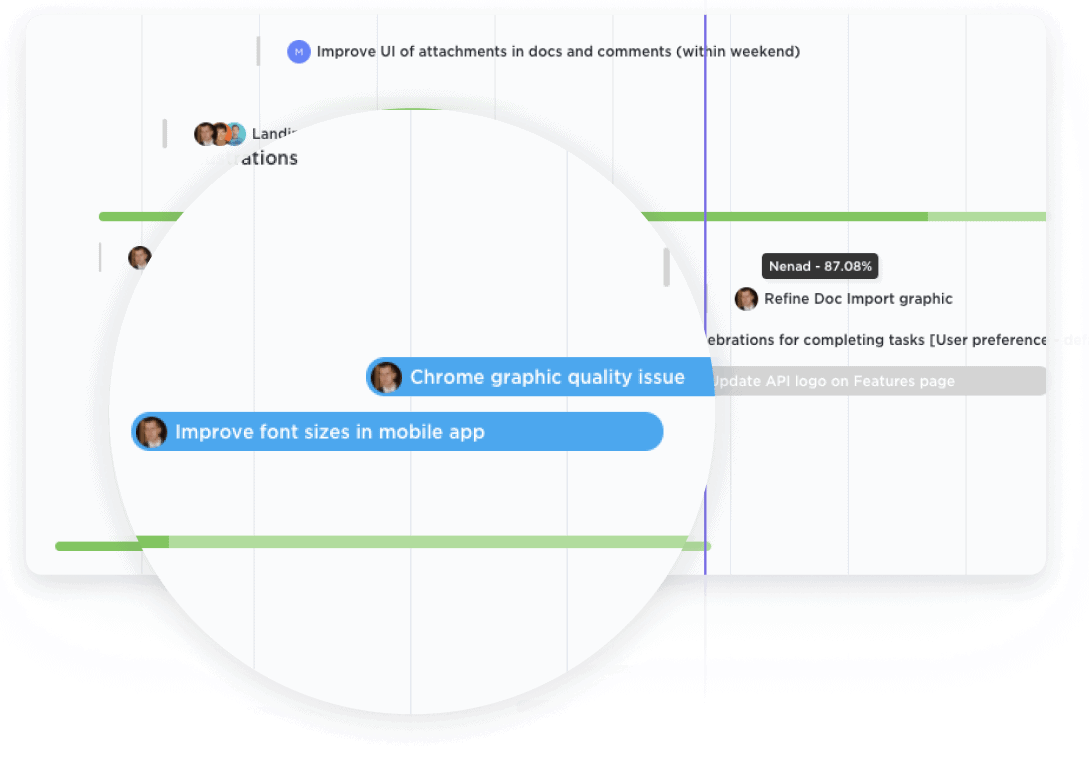
Get a bird's-eye view of all Spaces, Projects, Lists, and tasks in one Gantt chart. With clear coloring options, you can easily see what work is happening and where.

Reporters can use Gantt charts to plan and track the progress of their news stories. By breaking down the reporting process into phases such as research, interviews, writing, editing, and publishing, journalists can create a visual timeline that helps them stay organized and meet deadlines. Gantt charts allow reporters to allocate time for each task, prioritize their work, and ensure that they have enough time to gather all the necessary information before their deadline.
In a newsroom setting, collaboration is essential for reporters. Gantt charts provide a centralized platform for reporters, editors, and other team members to allocate tasks, assign responsibilities, and track progress collectively. By visualizing the workflow and dependencies between different tasks, Gantt charts facilitate effective communication and coordination among team members, ensuring that everyone is on the same page and working towards the common goal of delivering high-quality news stories.
Reporters often juggle multiple assignments and deadlines simultaneously. Gantt charts enable reporters to visualize their workload and prioritize tasks accordingly. By mapping out the deadlines for each assignment and allocating time for research, interviews, writing, and editing, reporters can ensure that they are meeting their obligations and avoiding any conflicts or missed deadlines. Gantt charts provide a clear overview of all assignments, allowing reporters to manage their time effectively and deliver their stories on time.
Investigative reporters rely heavily on data collection and analysis. Gantt charts can be used to plan and track the different stages of data gathering, analysis, and reporting. By breaking down the investigative process into smaller tasks, such as data collection, data cleaning, data analysis, and report writing, reporters can ensure that they are following a systematic approach and not missing any crucial steps. Gantt charts also help reporters allocate time for reviewing and verifying the data, ensuring the accuracy and credibility of their investigative reports.
When covering events or press conferences, reporters need to coordinate their activities and ensure that they are capturing all the necessary information. Gantt charts can help reporters plan and schedule their coverage, including tasks such as attending the event, conducting interviews, taking photographs or videos, and writing the news article. By visualizing the timeline and dependencies of these tasks, reporters can coordinate with other journalists, photographers, and videographers to ensure comprehensive coverage of the event and timely delivery of the news story.
A Gantt chart can help reporters keep track of their various assignments and deadlines, allowing them to prioritize their work effectively and ensure they are meeting their deadlines.
Reporters often work in collaboration with editors and other team members. A Gantt chart can serve as a shared platform to assign tasks, track progress, and ensure everyone is on the same page.
Investigative reporting often involves lengthy research and analysis. A Gantt chart can help reporters break down their investigation into smaller tasks, set milestones, and visualize the overall timeline for completing the project.
Reporters frequently conduct interviews and collect data for their stories. A Gantt chart can help them track the progress of these tasks, ensuring that all necessary information is gathered in a timely manner.
Reporters often have multiple stories with different deadlines. A Gantt chart can help them manage these overlapping deadlines and prioritize their work accordingly.
A Gantt chart can be shared with editors and stakeholders to provide a visual representation of the progress on different stories, allowing for effective communication and collaboration.
Gantt chart software can help you manage your reporting projects by visually mapping out the project timeline, tasks, and dependencies. It allows you to set deadlines and track progress, ensuring that reporting tasks are completed on time. Additionally, it enables you to allocate resources effectively and identify potential bottlenecks or delays, improving project coordination and efficiency.
Yes, Gantt chart software allows you to set deadlines and milestones for your reporting tasks, providing a visual representation of their progress and due dates. This helps you track their status, identify potential bottlenecks, and ensure timely completion of your reporting tasks.
Yes, Gantt chart software allows for collaboration and communication among team members by providing a centralized platform where everyone can access and update project timelines, tasks, and dependencies in real-time. This enhances coordination, improves communication, and ensures that everyone is on the same page regarding project progress, deadlines, and responsibilities.