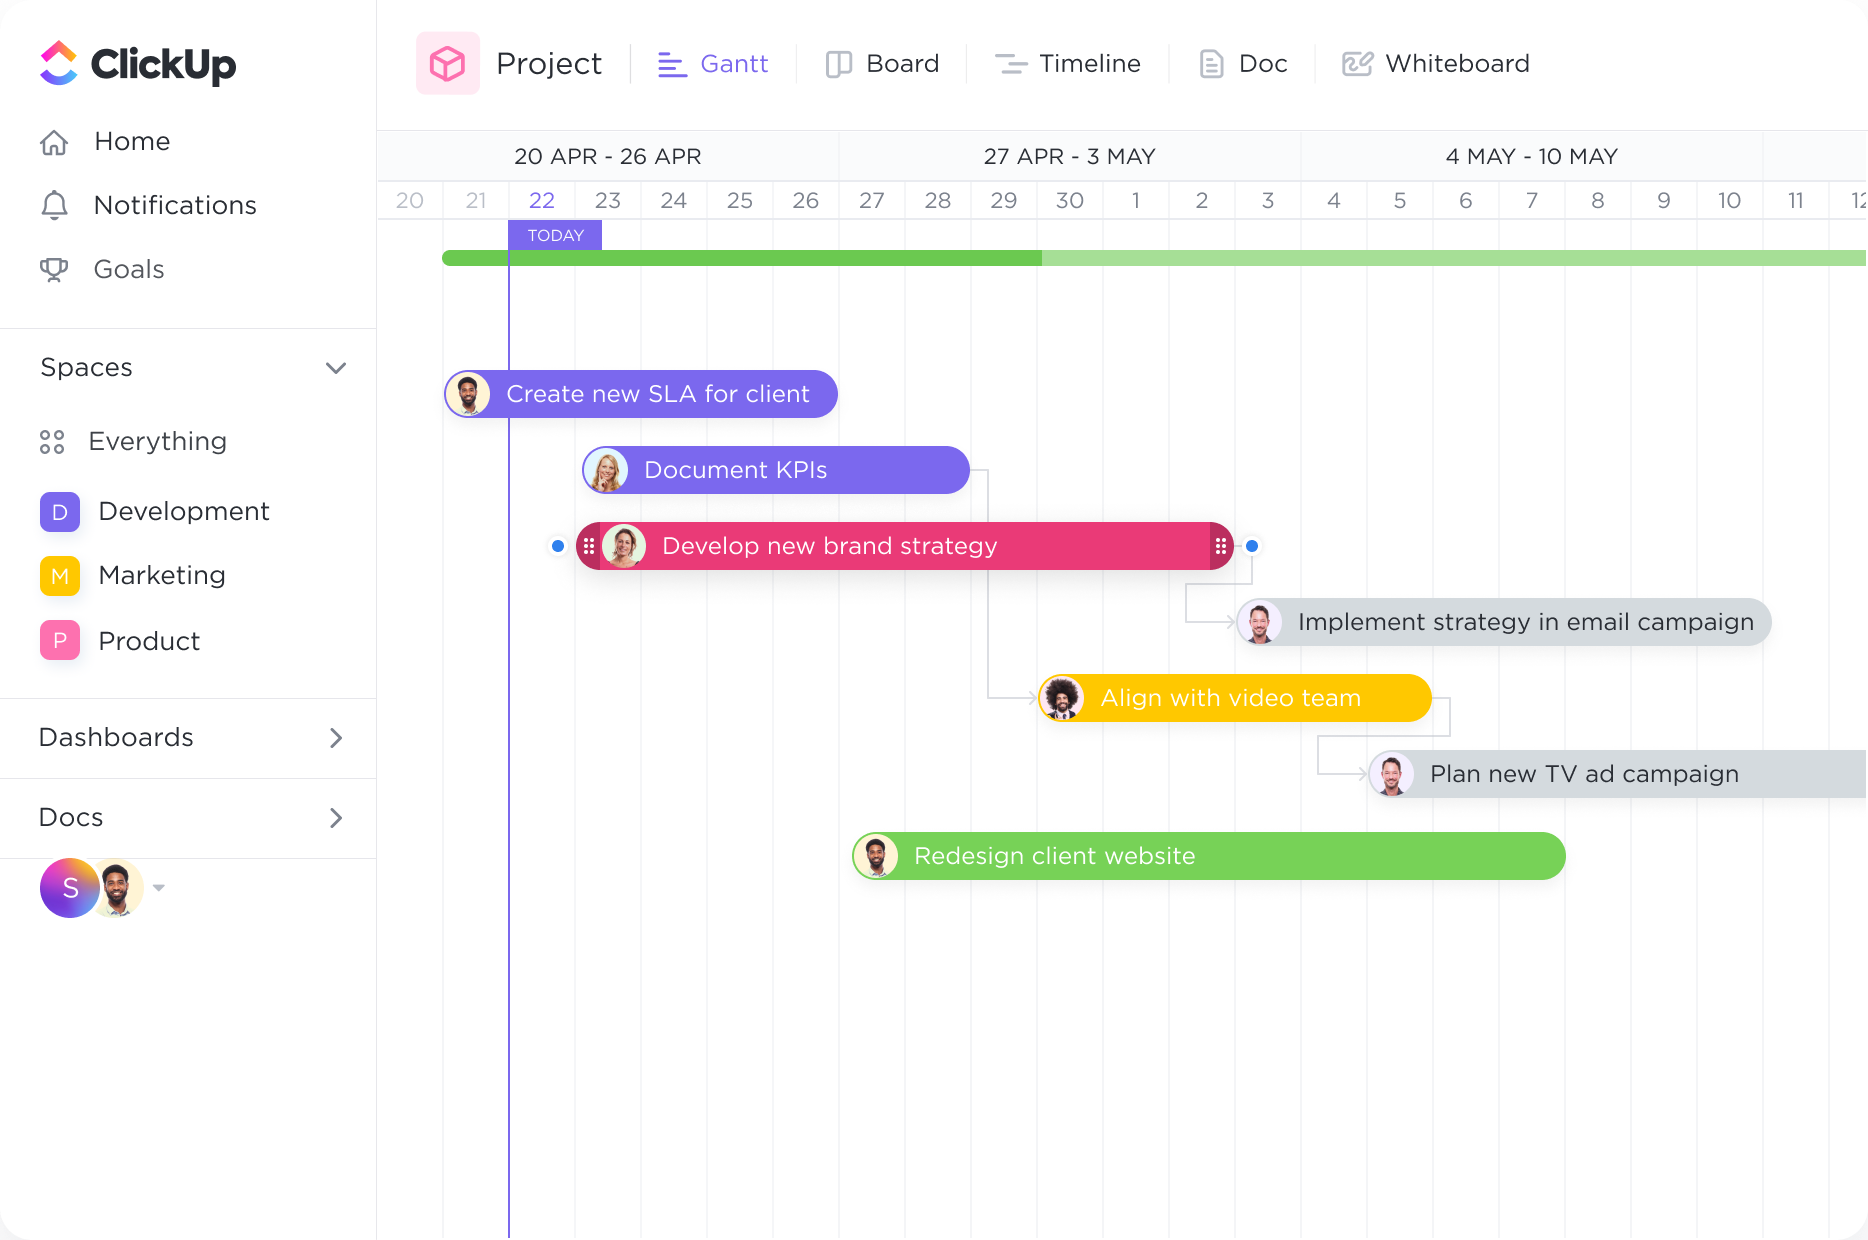
Tracking
Eliminate bottlenecks before they happen.
Intelligent dependency-path tracking shows you where potential bottlenecks might exist to prevent inefficiencies.
Gantt Charts
Streamline your project management process with ClickUp's powerful Gantt Chart software. Designed specifically for Renewable Energy Technicians, our intuitive platform allows you to effortlessly create and customize Gantt Charts that align with your unique project requirements. Visualize project timelines, track progress, and collaborate seamlessly with your team, all in one place. Take control of your projects and maximize productivity with ClickUp's Gantt Chart software.
Free forever. No credit card.

Tracking
Intelligent dependency-path tracking shows you where potential bottlenecks might exist to prevent inefficiencies.
Timelines
With the Gantt chart's dynamic timeline, you can easily schedule tasks, keep up with project progress, manage deadlines, and handle bottlenecks.
Gantt charts are invaluable tools for renewable energy technicians managing installation projects. By visualizing project timelines, deadlines, and milestones, technicians can effectively plan and track the progress of each phase. This allows for better coordination of tasks, ensuring that installations are completed on time and within budget.
Renewable energy projects often require careful management of resources, such as personnel and equipment. Gantt charts provide a clear overview of resource availability and utilization, enabling technicians to allocate resources efficiently. This helps prevent bottlenecks, optimize productivity, and ensure that resources are utilized effectively throughout the project.
Regular maintenance and inspections are crucial for the efficient operation of renewable energy systems. Gantt charts can be used to schedule and track maintenance tasks, ensuring that technicians stay on top of routine checks and repairs. This proactive approach helps prevent system downtime, maximizes energy production, and extends the lifespan of renewable energy installations.
Gantt charts can also be utilized to monitor and analyze performance data of renewable energy systems. By integrating data collection and analysis tasks into the chart, technicians can track key performance indicators and identify trends or anomalies. This allows for timely interventions and optimization strategies, ultimately improving the overall performance and efficiency of renewable energy systems.
A Gantt chart can help technicians keep track of different projects, their timelines, and the specific tasks and milestones associated with each project.
A Gantt chart can serve as a central platform for collaboration, allowing technicians from different teams or departments to visually track their tasks and ensure proper coordination of resources.
By mapping out the sequence of tasks and their dependencies in a Gantt chart, technicians can identify the critical path of a project and ensure that tasks are completed in the correct order to avoid delays or bottlenecks.
A Gantt chart provides a visual representation of project timelines, allowing technicians to monitor progress, identify potential delays, and manage deadlines effectively.
With a Gantt chart, technicians can easily see the workload of each team member and allocate resources accordingly, ensuring that tasks are distributed evenly and efficiently.
A Gantt chart can be shared with stakeholders to provide a clear visual representation of project progress, milestones achieved, and any potential delays or challenges, facilitating effective communication and transparency.
You can utilize Gantt chart software to visually plan and track the progress of your renewable energy projects. It enables you to schedule and allocate resources efficiently, identify critical project milestones, and track the completion of tasks. Additionally, it helps you identify potential bottlenecks or delays, allowing for proactive adjustments and ensuring timely project delivery.
There are several Gantt chart software options available that can be used by renewable energy technicians. Some popular choices include Microsoft Project, Smartsheet, and TeamGantt. It is recommended to choose a software that offers features such as task dependencies, resource allocation, and easy collaboration to effectively manage and track renewable energy projects.
Yes, Gantt chart software can help you track the progress of multiple renewable energy projects simultaneously by providing a visual representation of project timelines, tasks, and dependencies. It allows you to monitor project milestones, identify potential scheduling conflicts, and track the completion of tasks. This enables you to effectively manage and prioritize your projects, ensuring timely delivery and efficient resource allocation.