Activity
Track your progress at every step.
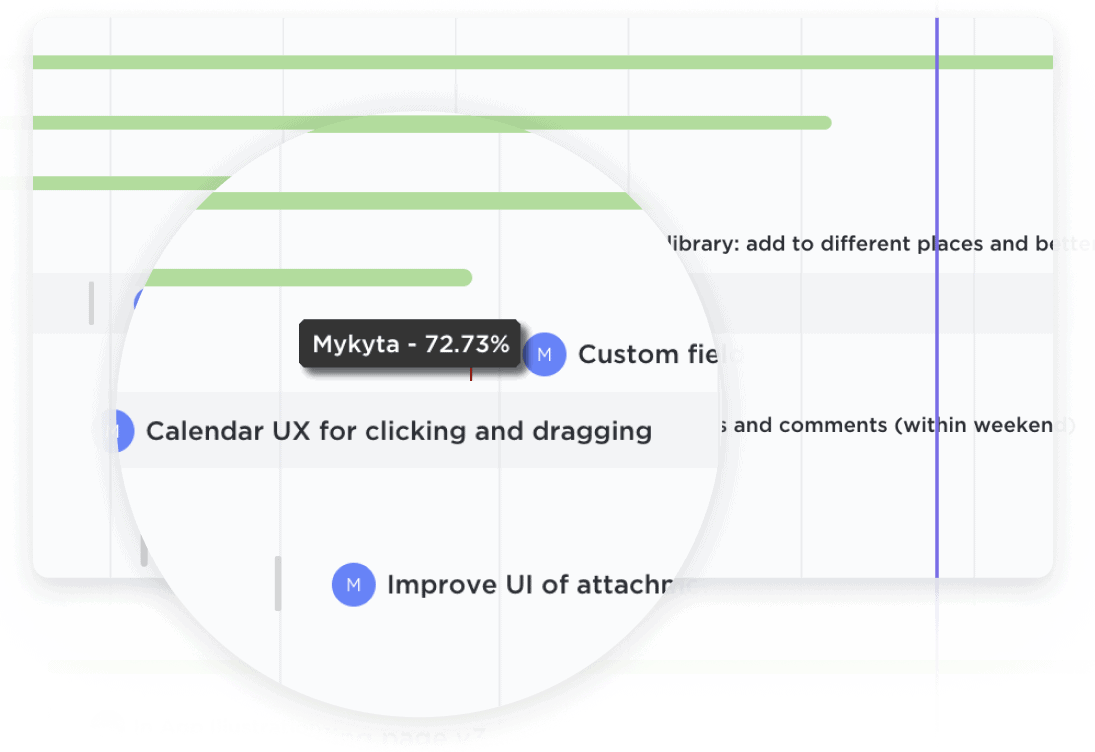
Easily update projects with a simple drag-and-drop action to collaborate amongst your team in real-time. Dynamic progress percentages provide a detailed snapshot.

Gantt Charts
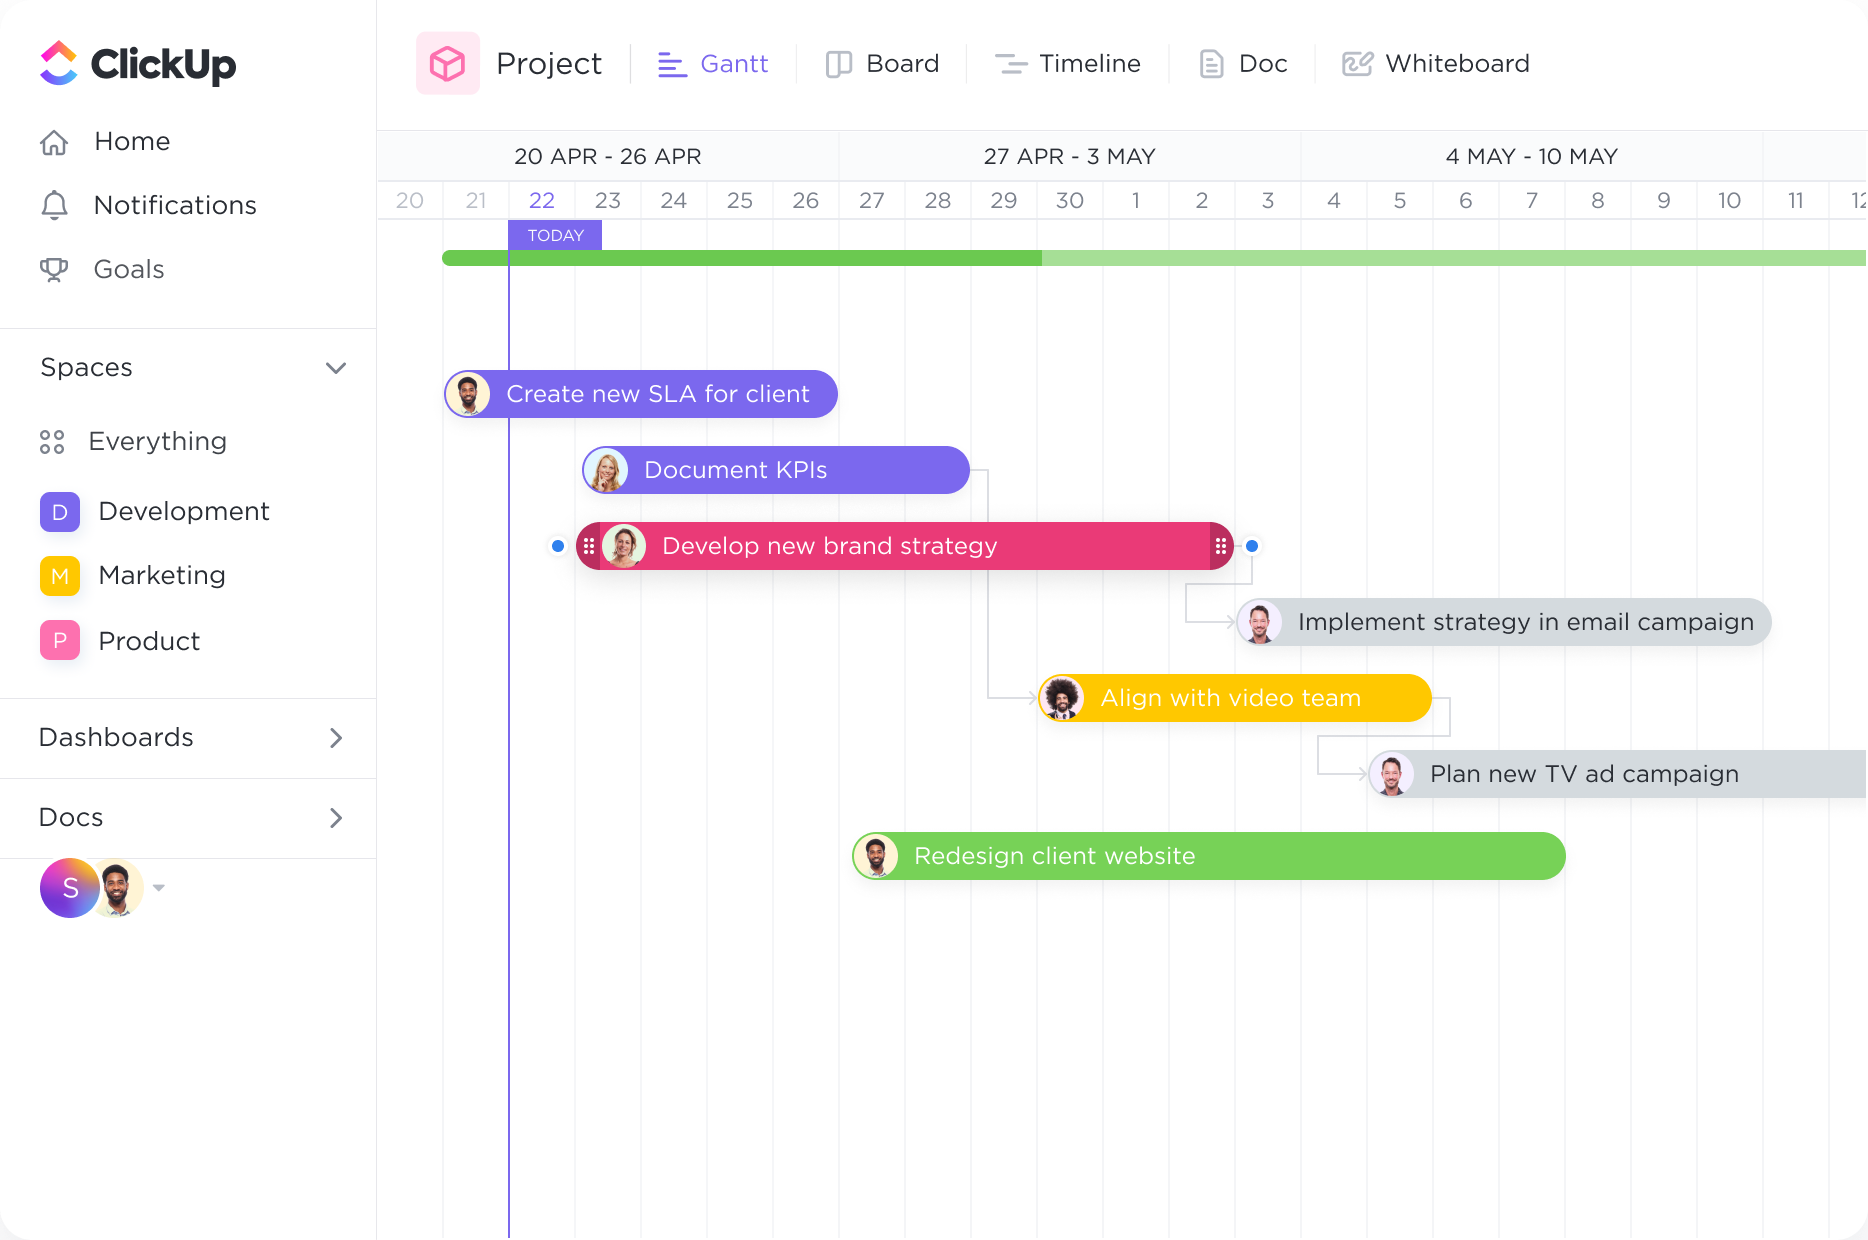
Supercharge your real estate investment projects with ClickUp's Gantt Chart software. Streamline your planning process, track progress, and meet deadlines effortlessly. Visualize your tasks, dependencies, and milestones in a user-friendly interface and gain complete control over your real estate projects. With ClickUp, you'll have all the tools you need to stay organized and make informed decisions for maximum profitability.
Free forever. No credit card.

Activity
Easily update projects with a simple drag-and-drop action to collaborate amongst your team in real-time. Dynamic progress percentages provide a detailed snapshot.

Visualize
Organize how you see your tasks with quick sorting. Create cascading views with a single click to easily see what important tasks are coming next.
Real estate investors often have multiple projects in progress simultaneously, each with its own set of tasks and deadlines. Gantt charts provide a comprehensive visual representation of project timelines, allowing investors to see the duration and sequence of each task. This helps in planning and organizing the various stages of property acquisition, renovation, marketing, and sale, ensuring that all projects stay on track and deadlines are met.
Real estate investment projects require the coordination and allocation of various resources, such as contractors, suppliers, and financial resources. Gantt charts enable investors to assign tasks to team members or external parties, ensuring that responsibilities are clearly defined and distributed. By visualizing resource availability and task dependencies, investors can optimize resource allocation, avoid bottlenecks, and ensure efficient project execution.
Managing finances is a critical aspect of real estate investment. Gantt charts can be used to track project costs, budgets, and financial milestones. By integrating financial data into the Gantt chart, investors can monitor expenses, forecast cash flow, and make informed decisions regarding project financing and investment strategies. This helps to maintain financial control, identify potential risks, and ensure the profitability of real estate investments.
Real estate investors often have a pipeline of potential deals and a portfolio of properties to manage. Gantt charts can be used to track the progress of each deal or property, from initial research and due diligence to acquisition and ongoing management. By visualizing the status of each project in the pipeline or portfolio, investors can prioritize actions, allocate resources effectively, and make informed decisions about future investments. This helps to streamline workflows, improve productivity, and optimize the overall real estate investment strategy.
A Gantt chart can help real estate investors keep track of multiple projects and their respective timelines, ensuring that each project is properly managed and coordinated.
A Gantt chart can visually represent the key milestones and deadlines for each real estate project, allowing investors to monitor progress and ensure that tasks are completed on time.
With a Gantt chart, real estate investors can allocate and manage resources effectively by visualizing the availability and utilization of resources across different projects.
A Gantt chart can help real estate investors identify dependencies between tasks and determine the critical path for each project, enabling them to prioritize and schedule tasks accordingly.
A Gantt chart provides a clear visual representation of project timelines, milestones, and progress, making it easier for real estate investors to communicate updates and status to stakeholders such as lenders, partners, or clients.
By having a visual representation of the project timeline, real estate investors can proactively identify potential risks and delays and take appropriate actions to mitigate them, ensuring that projects stay on track.
Gantt chart software can help you manage your real estate investment projects effectively by providing a visual representation of project timelines, tasks, and dependencies. It enables you to track project progress, identify potential bottlenecks or delays, and allocate resources efficiently. This helps in coordinating tasks, managing deadlines, and facilitating communication among team members, leading to improved project management and successful outcomes.
There is no specific Gantt chart template that is exclusively used by real estate investors. However, real estate investors can customize a Gantt chart template to suit their specific project needs, such as tracking property acquisitions, construction timelines, financing milestones, and marketing activities.
Yes, Gantt chart software can help you track the progress of multiple real estate projects simultaneously by providing a visual representation of each project's timeline, tasks, and milestones. It allows you to monitor the status of each project, identify potential delays or bottlenecks, and allocate resources effectively to ensure timely completion of all projects.