Overview
Manage all of your projects in one place.
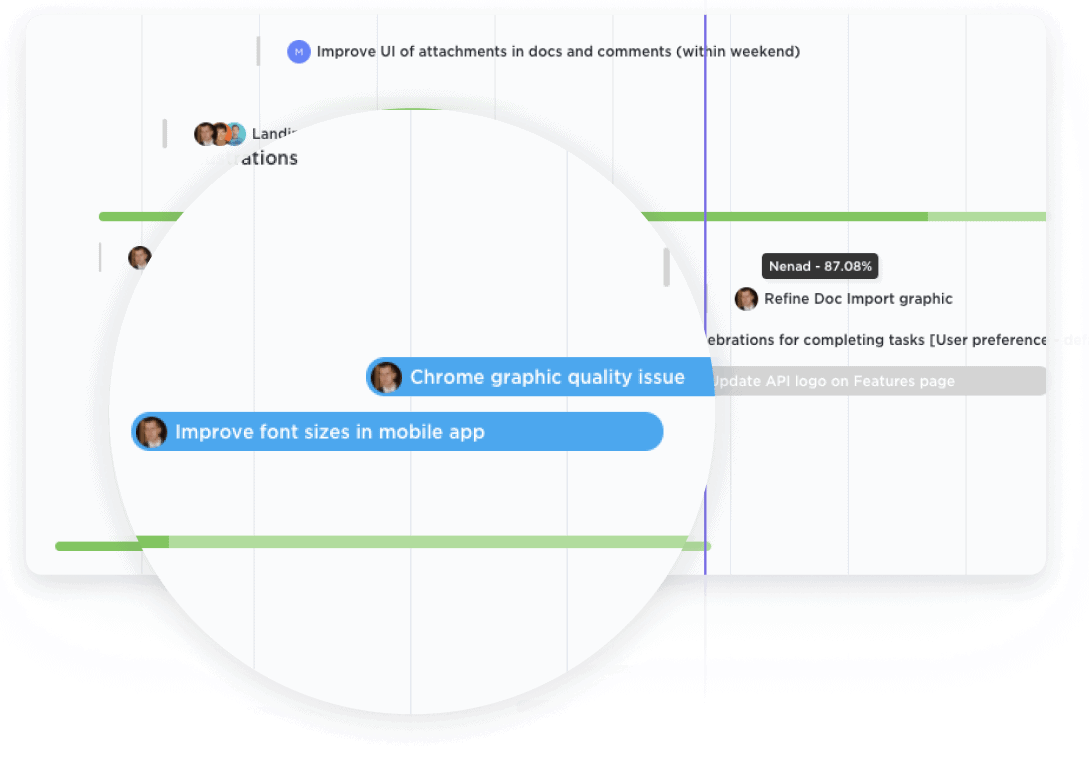
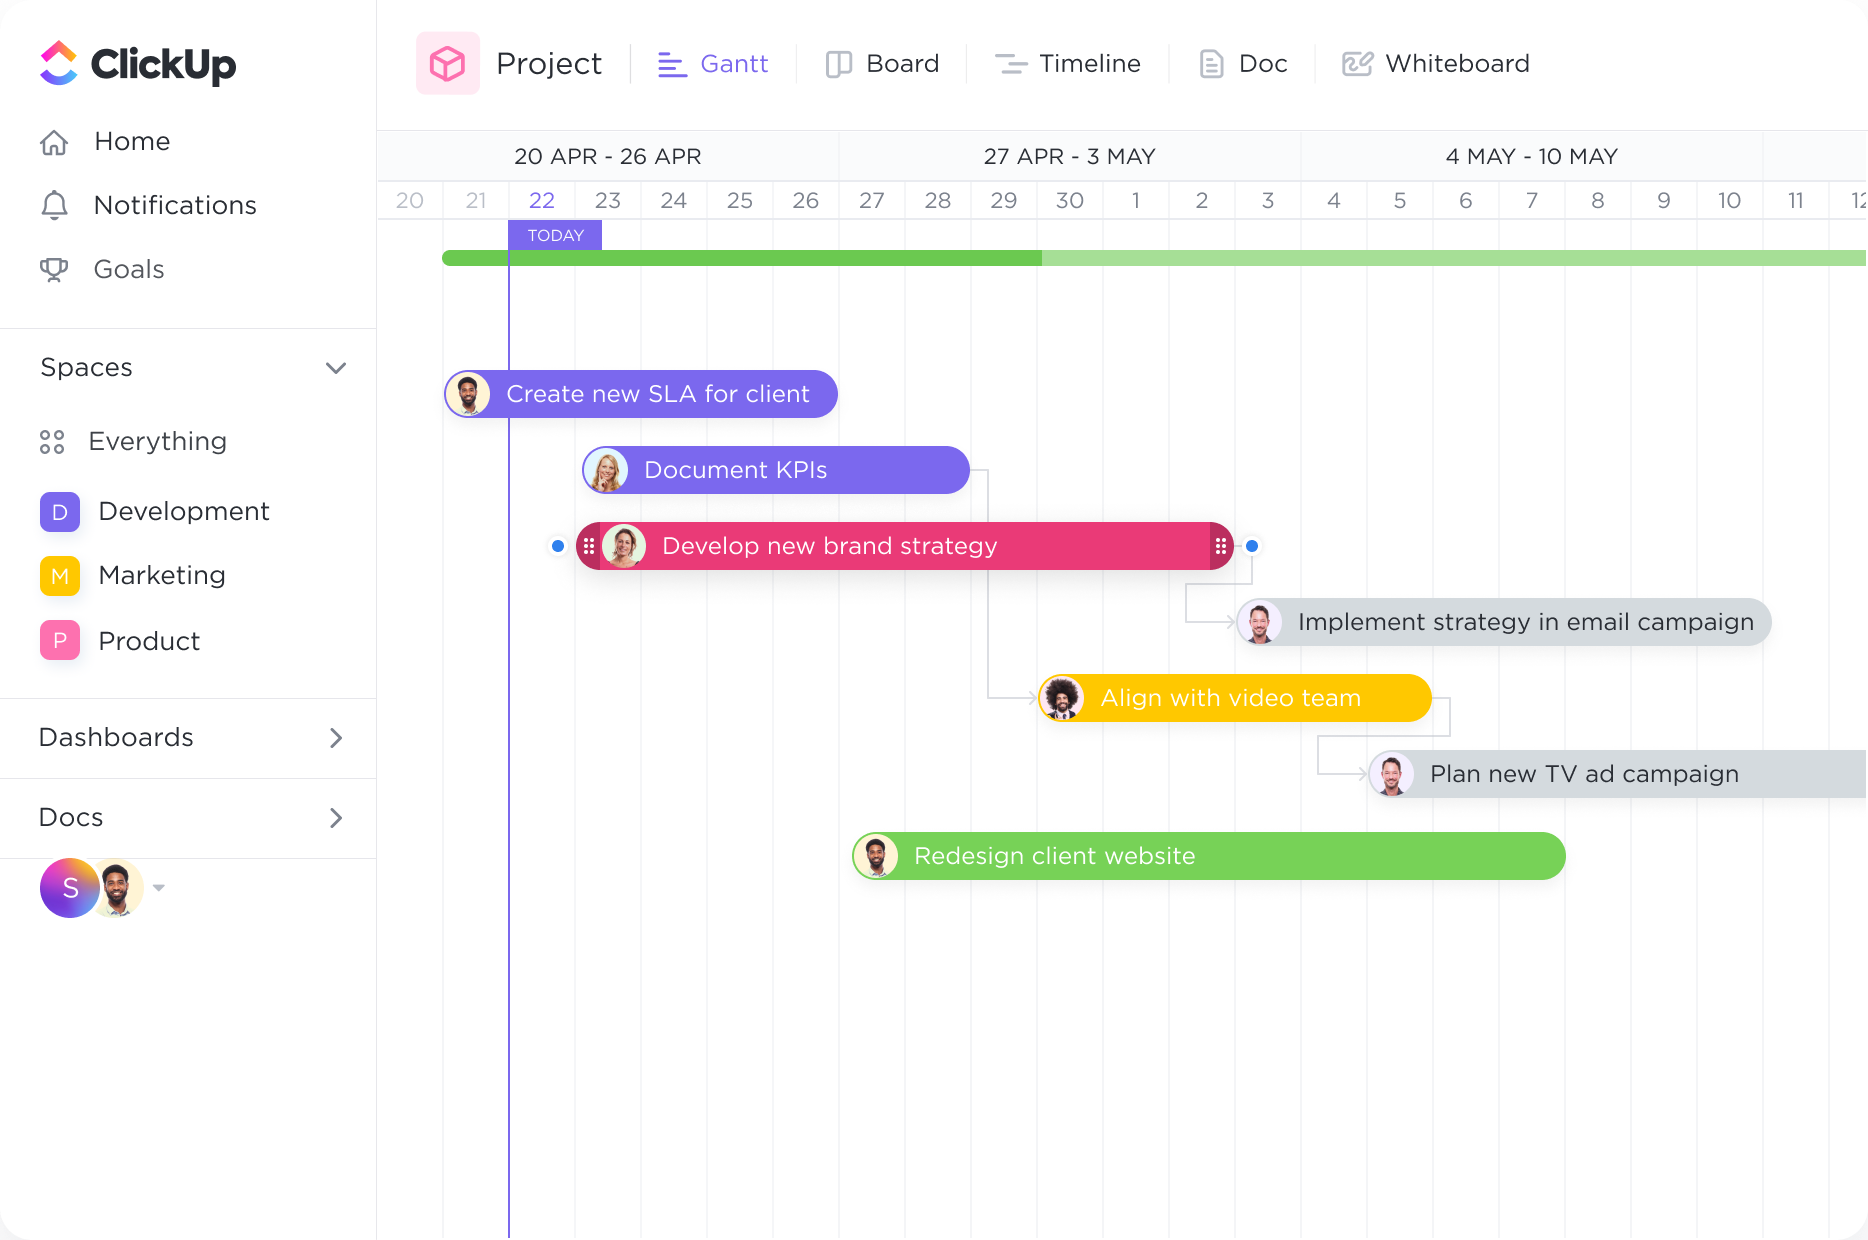
Get a bird's-eye view of all Spaces, Projects, Lists, and tasks in one Gantt chart. With clear coloring options, you can easily see what work is happening and where.

Gantt Charts
Optimize your workflow and streamline project management with ClickUp's powerful Gantt Chart software. Empower Quality Control Technicians to visualize project timelines, allocate resources, and track progress effortlessly. With ClickUp's intuitive interface and customizable features, you can create Gantt Charts that are tailored specifically to the needs of your Quality Control team. Boost productivity and efficiency with ClickUp's Gantt Chart software today.
Free forever. No credit card.

Overview
Get a bird's-eye view of all Spaces, Projects, Lists, and tasks in one Gantt chart. With clear coloring options, you can easily see what work is happening and where.

Tracking
Intelligent dependency-path tracking shows you where potential bottlenecks might exist to prevent inefficiencies.
Gantt charts are invaluable tools for quality control technicians to manage and oversee quality control projects. By visualizing project timelines, deadlines, and milestones, technicians can effectively plan and coordinate their activities. The Gantt chart provides a clear overview of the project's progress, allowing technicians to identify any bottlenecks or delays and take appropriate actions to ensure the project stays on track.
In quality control, tasks often need to be allocated among team members to ensure efficient and thorough inspections. Gantt charts enable quality control technicians to assign tasks to specific team members and track their progress. This promotes collaboration and accountability, as team members can easily see their assigned tasks and deadlines, ensuring that all inspections are completed in a timely manner.
Quality control technicians often need to manage and optimize the use of resources, such as personnel and equipment. Gantt charts provide a comprehensive view of resource availability and utilization, allowing technicians to allocate resources effectively. By identifying potential resource conflicts or shortages in advance, technicians can make adjustments to ensure that the necessary resources are available when needed, minimizing downtime and maximizing productivity.
Gantt charts serve as a powerful tool for monitoring and reporting quality control activities. By incorporating milestones and deadlines into the chart, technicians can track progress and ensure that inspections are completed within the specified timeframes. This enables them to generate accurate reports on project status and performance, providing valuable insights for decision-making and continuous improvement efforts.
A Gantt chart can help quality control technicians schedule and track inspections and tests for different products or processes. They can allocate resources and time slots for each task, ensuring that all necessary inspections and tests are completed within the required timeframe.
Quality control technicians often work on multiple projects at the same time. A Gantt chart can help them visualize and manage these projects by displaying the timelines, tasks, and dependencies for each project. This allows technicians to prioritize and allocate their time and resources efficiently.
By using a Gantt chart, quality control technicians can identify bottlenecks or delays in the quality control process. They can see which tasks are causing delays and take appropriate actions to address these issues, such as reallocating resources or adjusting timelines.
Quality control processes often involve collaboration with other departments or teams. A Gantt chart can serve as a central platform for communication and coordination, allowing technicians to visually track their tasks and deadlines, as well as easily communicate with other stakeholders involved in the quality control process.
A Gantt chart can be used to track and monitor key quality control metrics, such as the number of inspections completed, test results, and compliance with quality standards. Technicians can use this data to analyze performance, identify trends, and make data-driven decisions to improve the quality control process.
Gantt charts can be shared with stakeholders, such as managers, clients, or regulatory bodies, to provide visibility and transparency into the quality control process. This allows stakeholders to track progress, understand timelines, and make informed decisions based on the information presented in the Gantt chart.
Gantt chart software can be used to track and manage quality control processes by visually mapping out the timeline of quality control tasks and their dependencies. It allows for the allocation of resources and setting deadlines for each task, ensuring that quality control activities are completed in a timely manner. Additionally, Gantt charts enable the identification of potential bottlenecks or delays in the quality control process, allowing for proactive adjustments to maintain quality standards.
Yes, Gantt chart software can be integrated with other quality control tools and systems. This integration allows for seamless data sharing, enabling real-time updates on quality control activities and their impact on project timelines. It facilitates the identification of quality-related tasks and dependencies, ensuring effective coordination and collaboration among team members.
Yes, Gantt chart software can help you identify bottlenecks in quality control workflows by visually representing the workflow and timelines. It allows you to see where tasks overlap or are delayed, enabling you to adjust task durations, dependencies, and resources in real-time. This helps you quickly identify and address delays, optimize workflow efficiency, and ensure smooth quality control processes.