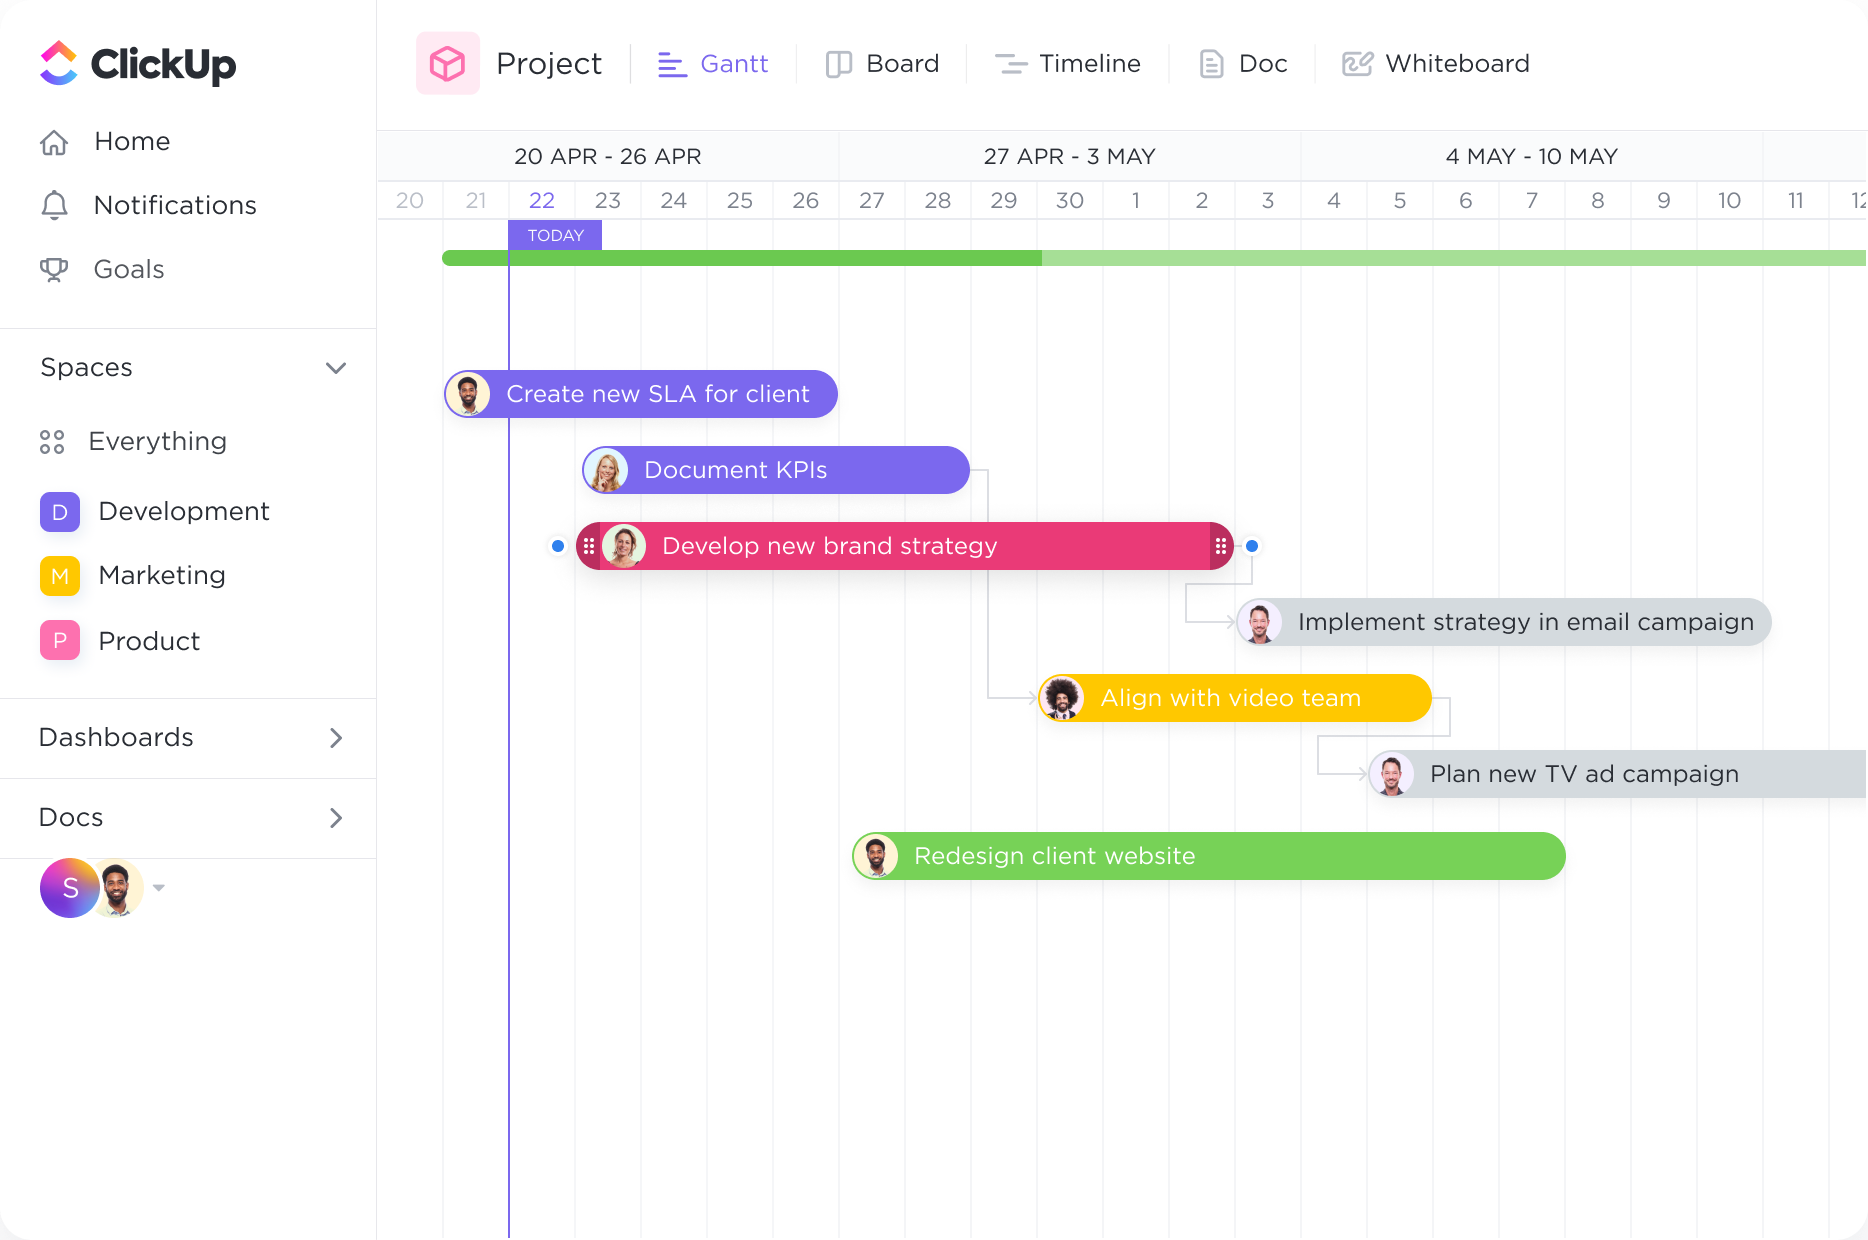
Timelines
Stay ahead of every deadline.
With the Gantt chart's dynamic timeline, you can easily schedule tasks, keep up with project progress, manage deadlines, and handle bottlenecks.
Gantt Charts
Supercharge your prototyping team's productivity with ClickUp's Gantt Chart software. Streamline your project planning and execution process with intuitive features that allow you to create, visualize, and track tasks effortlessly. Empower your team to meet deadlines and stay on track with real-time collaboration and easy task dependencies. Say goodbye to project delays and hello to seamless teamwork with ClickUp's Gantt Chart software.
Free forever. No credit card.

Timelines
With the Gantt chart's dynamic timeline, you can easily schedule tasks, keep up with project progress, manage deadlines, and handle bottlenecks.
Visualize
Organize how you see your tasks with quick sorting. Create cascading views with a single click to easily see what important tasks are coming next.
Prototyping teams often go through multiple phases, from ideation to testing and refining. Gantt charts provide a visual representation of these phases, allowing teams to plan and manage each step of the prototyping process. By breaking down the project into smaller tasks and assigning them to team members, Gantt charts help ensure that each phase is completed on time and in the correct sequence.
In prototyping teams, different tasks and activities often depend on each other. Gantt charts enable teams to identify these dependencies and track the progress of each task. By visualizing the relationships between tasks, teams can ensure that they are completed in the right order and that any delays or issues are addressed promptly. This helps maintain a smooth workflow and prevents bottlenecks in the prototyping process.
Prototyping teams typically have limited resources, such as materials, equipment, and personnel. Gantt charts allow teams to allocate and manage these resources effectively. By scheduling resource usage and tracking availability, teams can ensure that the necessary resources are allocated to each task at the right time. This helps optimize resource utilization, avoid conflicts, and minimize downtime, ultimately improving the efficiency of the prototyping process.
Prototyping teams often work with various stakeholders, including designers, engineers, and clients. Gantt charts serve as a visual communication tool, enabling teams to share project timelines, progress, and milestones with stakeholders. This enhances collaboration and transparency, as everyone involved can easily understand the project's status and upcoming activities. Gantt charts also facilitate discussions and decision-making, ensuring that all stakeholders are aligned throughout the prototyping process.
A Gantt chart can help prototyping teams create a detailed plan and schedule for their projects, allowing them to allocate resources effectively and prioritize tasks.
By visualizing the timeline and progress of each task in a Gantt chart, prototyping teams can easily track their progress and ensure that they are meeting project milestones and deadlines.
A Gantt chart can highlight task dependencies, allowing teams to identify potential bottlenecks or delays in the prototyping process. This enables them to take proactive measures to address these issues and keep the project on track.
A Gantt chart can serve as a central platform for collaboration, allowing team members to visually track their individual tasks and coordinate their efforts with others. This promotes better communication and teamwork within the prototyping team.
By visualizing the workload and resource allocation in a Gantt chart, prototyping teams can ensure that resources are distributed efficiently and avoid overloading team members or underutilizing resources.
A Gantt chart can be shared with stakeholders to provide a clear visual representation of the project timeline and progress. This enables prototyping teams to effectively communicate project status, manage expectations, and address any concerns or questions from stakeholders.
Gantt chart software can provide prototyping teams with a visual representation of the project timeline, allowing for better planning and coordination of tasks. It helps in identifying dependencies, setting realistic deadlines, and allocating resources effectively. Additionally, it enables teams to track progress, identify bottlenecks, and make adjustments in real-time, ensuring efficient and timely completion of prototypes.
Gantt chart software can help in managing and tracking the progress of prototyping projects by visually representing the project timeline, tasks, and dependencies. It allows for the identification of critical paths, enabling teams to prioritize tasks and allocate resources effectively. Additionally, it provides a clear overview of task durations and deadlines, facilitating progress monitoring and ensuring timely completion of project milestones.
Yes, Gantt chart software can be integrated with other project management tools used by prototyping teams. This integration allows for seamless data synchronization, enabling teams to have a comprehensive overview of project timelines, tasks, and dependencies across multiple platforms. It enhances collaboration, streamlines communication, and improves overall project coordination and efficiency.