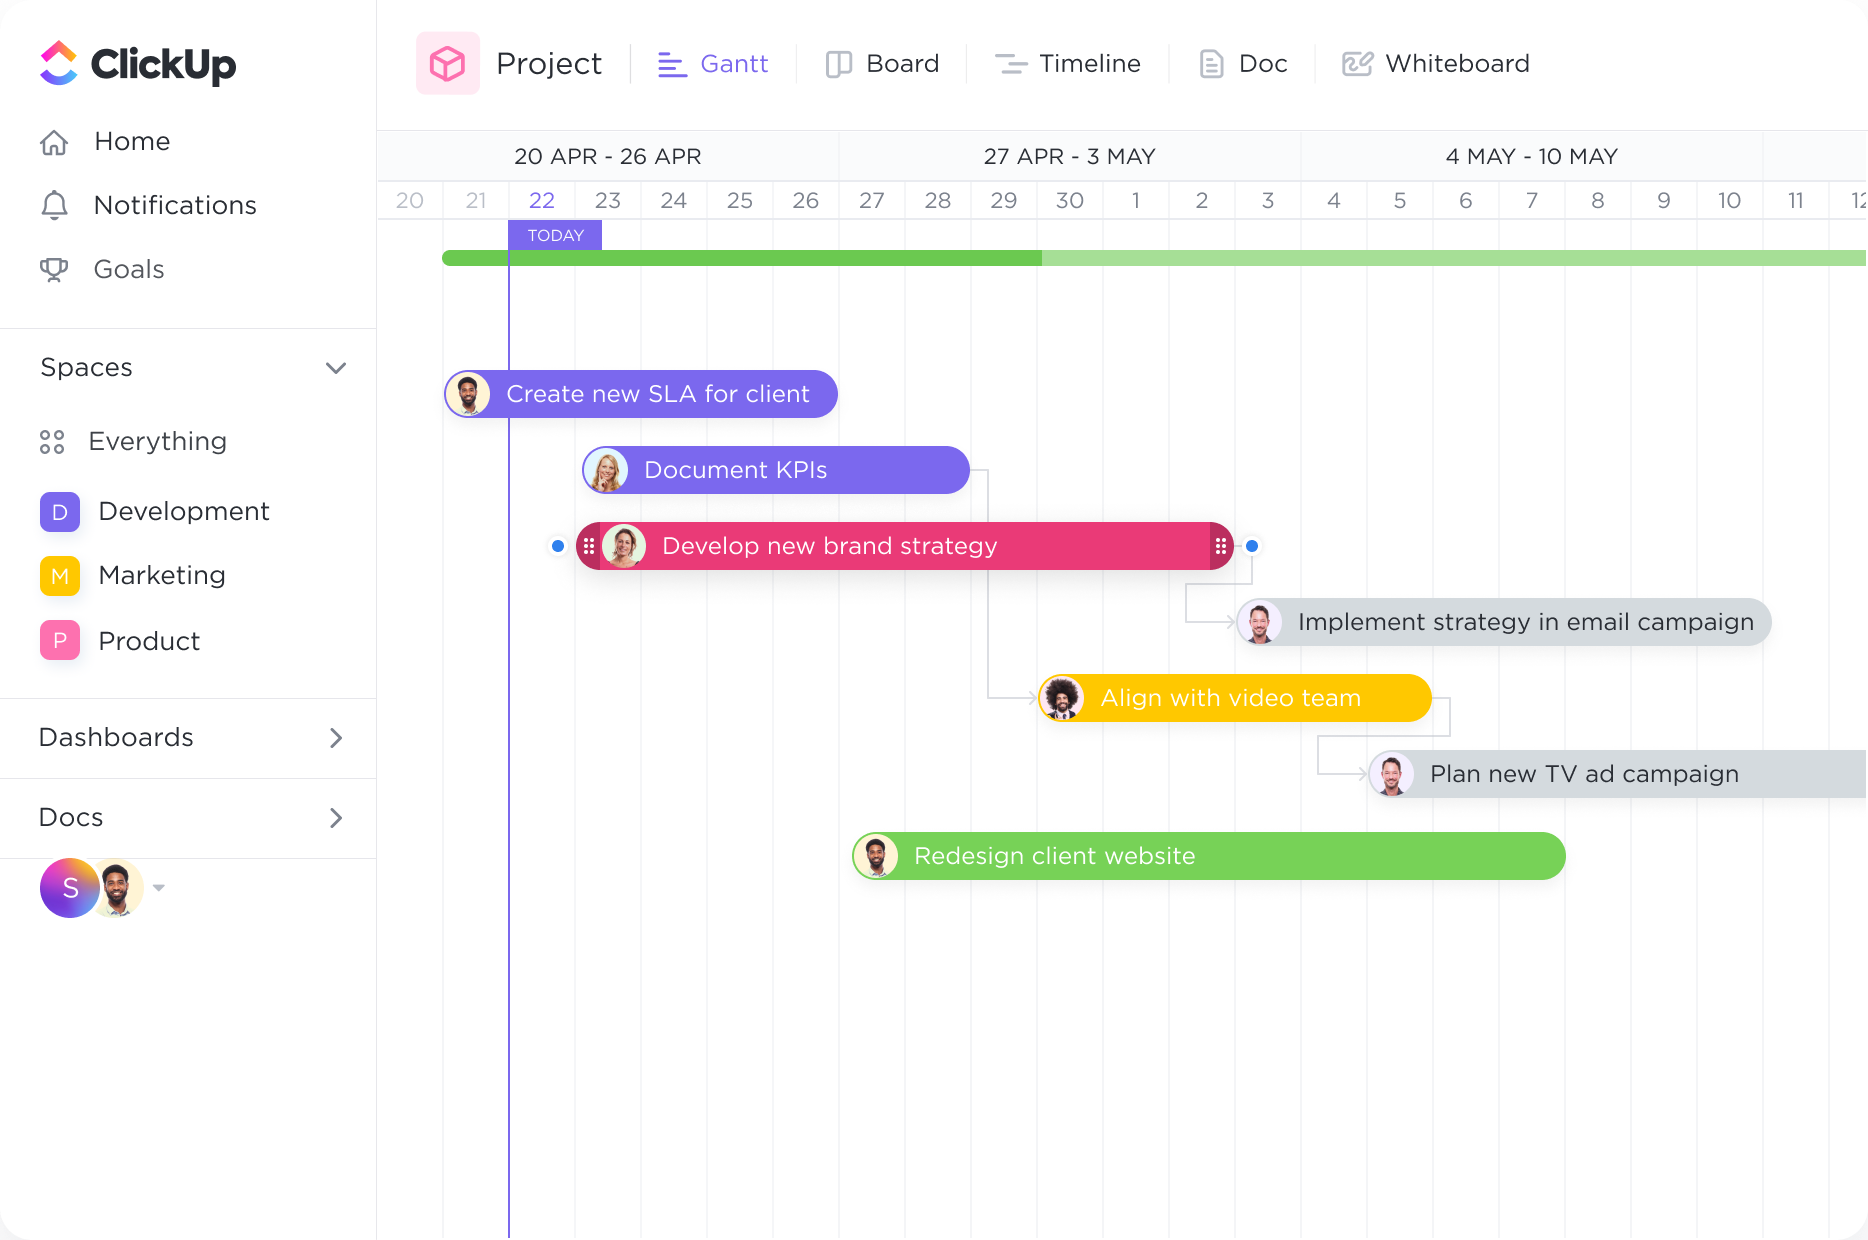
Timelines
Stay ahead of every deadline.
With the Gantt chart's dynamic timeline, you can easily schedule tasks, keep up with project progress, manage deadlines, and handle bottlenecks.
Gantt Charts
Streamline your investment management process with ClickUp's powerful Gantt Chart Software. Plan, track, and execute your projects seamlessly, enabling you to meet deadlines and achieve your investment goals with ease. Create visually appealing and customizable Gantt Charts that provide a comprehensive overview of your tasks, dependencies, and milestones. Take control of your investment management projects like never before with ClickUp's Gantt Chart Software.
Free forever. No credit card.

Timelines
With the Gantt chart's dynamic timeline, you can easily schedule tasks, keep up with project progress, manage deadlines, and handle bottlenecks.
Dependencies
Create tasks and link them with dependencies. Dragging a task with dependencies will automatically reschedule tasks in the chain
Gantt charts can be used by investment managers to visually plan and manage their portfolio. By mapping out the various assets and their expected performance over time, investment managers can make informed decisions about asset allocation, diversification, and risk management. Gantt charts provide a clear overview of the portfolio's timeline, allowing investment managers to monitor and adjust their strategies accordingly.
Investment managers often conduct extensive research and due diligence before making investment decisions. Gantt charts can be used to outline the research process, including tasks such as analyzing financial statements, conducting market research, and evaluating potential investment opportunities. By visualizing the research timeline, investment managers can ensure that all necessary steps are completed on time, leading to well-informed investment decisions.
Monitoring the performance of investments is a crucial aspect of investment management. Gantt charts can be utilized to track the progress and performance of various investments over time. By plotting key performance indicators, such as returns, risk metrics, and benchmark comparisons, investment managers can easily identify trends, assess the success of their strategies, and generate comprehensive reports for clients and stakeholders.
Gantt charts can be valuable tools for investment managers during the fundraising process and when managing relationships with investors. By creating a timeline that outlines key milestones, such as investor meetings, due diligence periods, and fund closings, investment managers can effectively manage the fundraising process. Gantt charts also enable investment managers to keep investors informed about the progress of their investments and provide transparency regarding upcoming events and distributions.
Compliance with regulations and reporting requirements is a critical aspect of investment management. Gantt charts can be used to plan and track compliance-related tasks, such as filing regulatory reports, conducting internal audits, and implementing risk management procedures. By visualizing compliance timelines, investment managers can ensure that all necessary tasks are completed within the required deadlines, reducing the risk of penalties and maintaining regulatory compliance.
Investment managers often need to evaluate different investment strategies and analyze various scenarios to make informed decisions. Gantt charts can be used to map out and compare different investment strategies, including their expected returns, risk profiles, and implementation timelines. By visualizing these strategies side by side, investment managers can assess the potential outcomes and make data-driven decisions that align with their investment objectives.
A Gantt chart can help investment managers visually track and manage multiple portfolios, including the allocation of assets, investment strategies, and performance targets.
A Gantt chart can serve as a collaborative tool for investment teams, allowing members to coordinate their tasks, deadlines, and actions to ensure efficient execution of investment strategies.
Investment managers often have interdependent projects, such as conducting due diligence, analyzing financial data, and making investment decisions. A Gantt chart can help identify and manage these dependencies, ensuring that tasks are completed in the right order and no critical steps are missed.
A Gantt chart can provide a clear overview of the timelines and deadlines associated with each investment, helping managers stay on track and meet important milestones, such as investment entry and exit points.
By integrating investment performance data into a Gantt chart, investment managers can visually analyze the performance of each investment over time, identify trends, and make informed decisions based on historical data.
A Gantt chart can be shared with clients to provide a transparent and visual representation of investment strategies, progress, and projected outcomes. This can help build trust and keep clients informed about the status of their investments.
Gantt chart software can help investment managers track and manage projects by providing a visual representation of project timelines, tasks, and dependencies. It allows for the allocation of resources and the identification of potential scheduling conflicts. Investment managers can use Gantt charts to monitor project progress, track milestones, and make informed decisions based on real-time data, improving project coordination and efficiency.
Yes, Gantt chart software can be integrated with other investment management tools to streamline the workflow. Integration allows for the seamless transfer of data between platforms, enabling real-time updates and synchronization of project information. This enhances collaboration, improves data accuracy, and reduces manual data entry, resulting in a more efficient and streamlined workflow for investment management.
Yes, Gantt chart software can provide real-time updates and notifications to investment managers, keeping them informed about project progress and deadlines. This helps them stay on top of the project's status, make timely decisions, and effectively manage investments.