Overview
Manage all of your projects in one place.
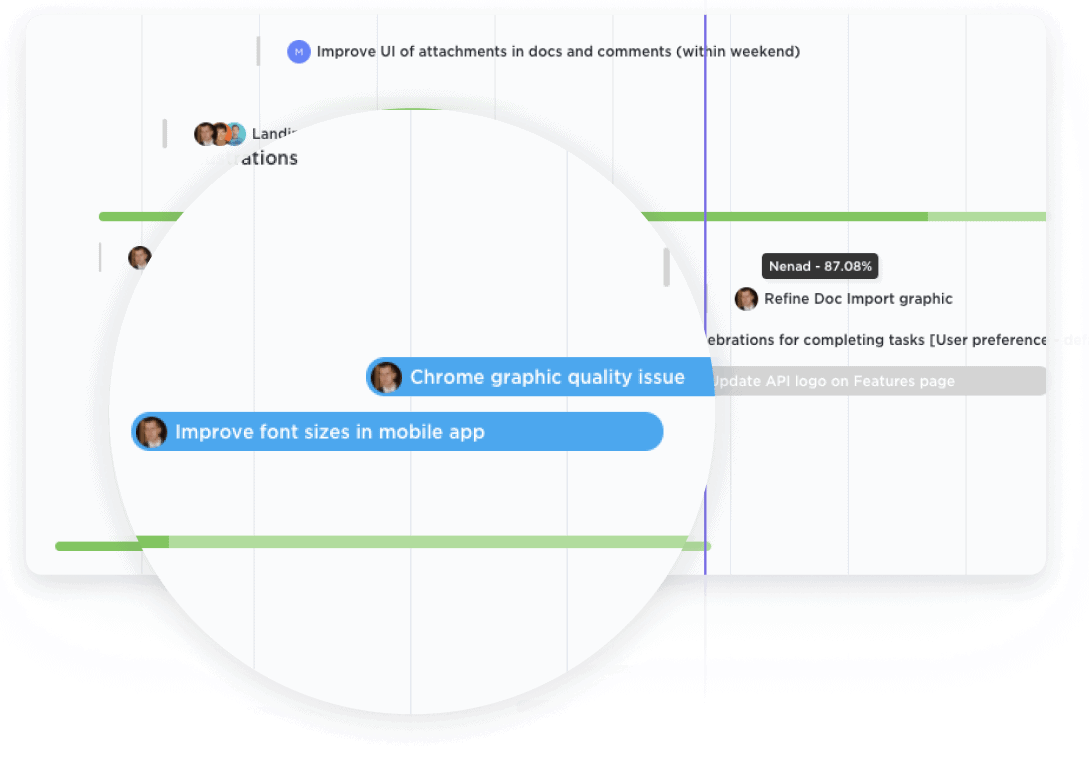
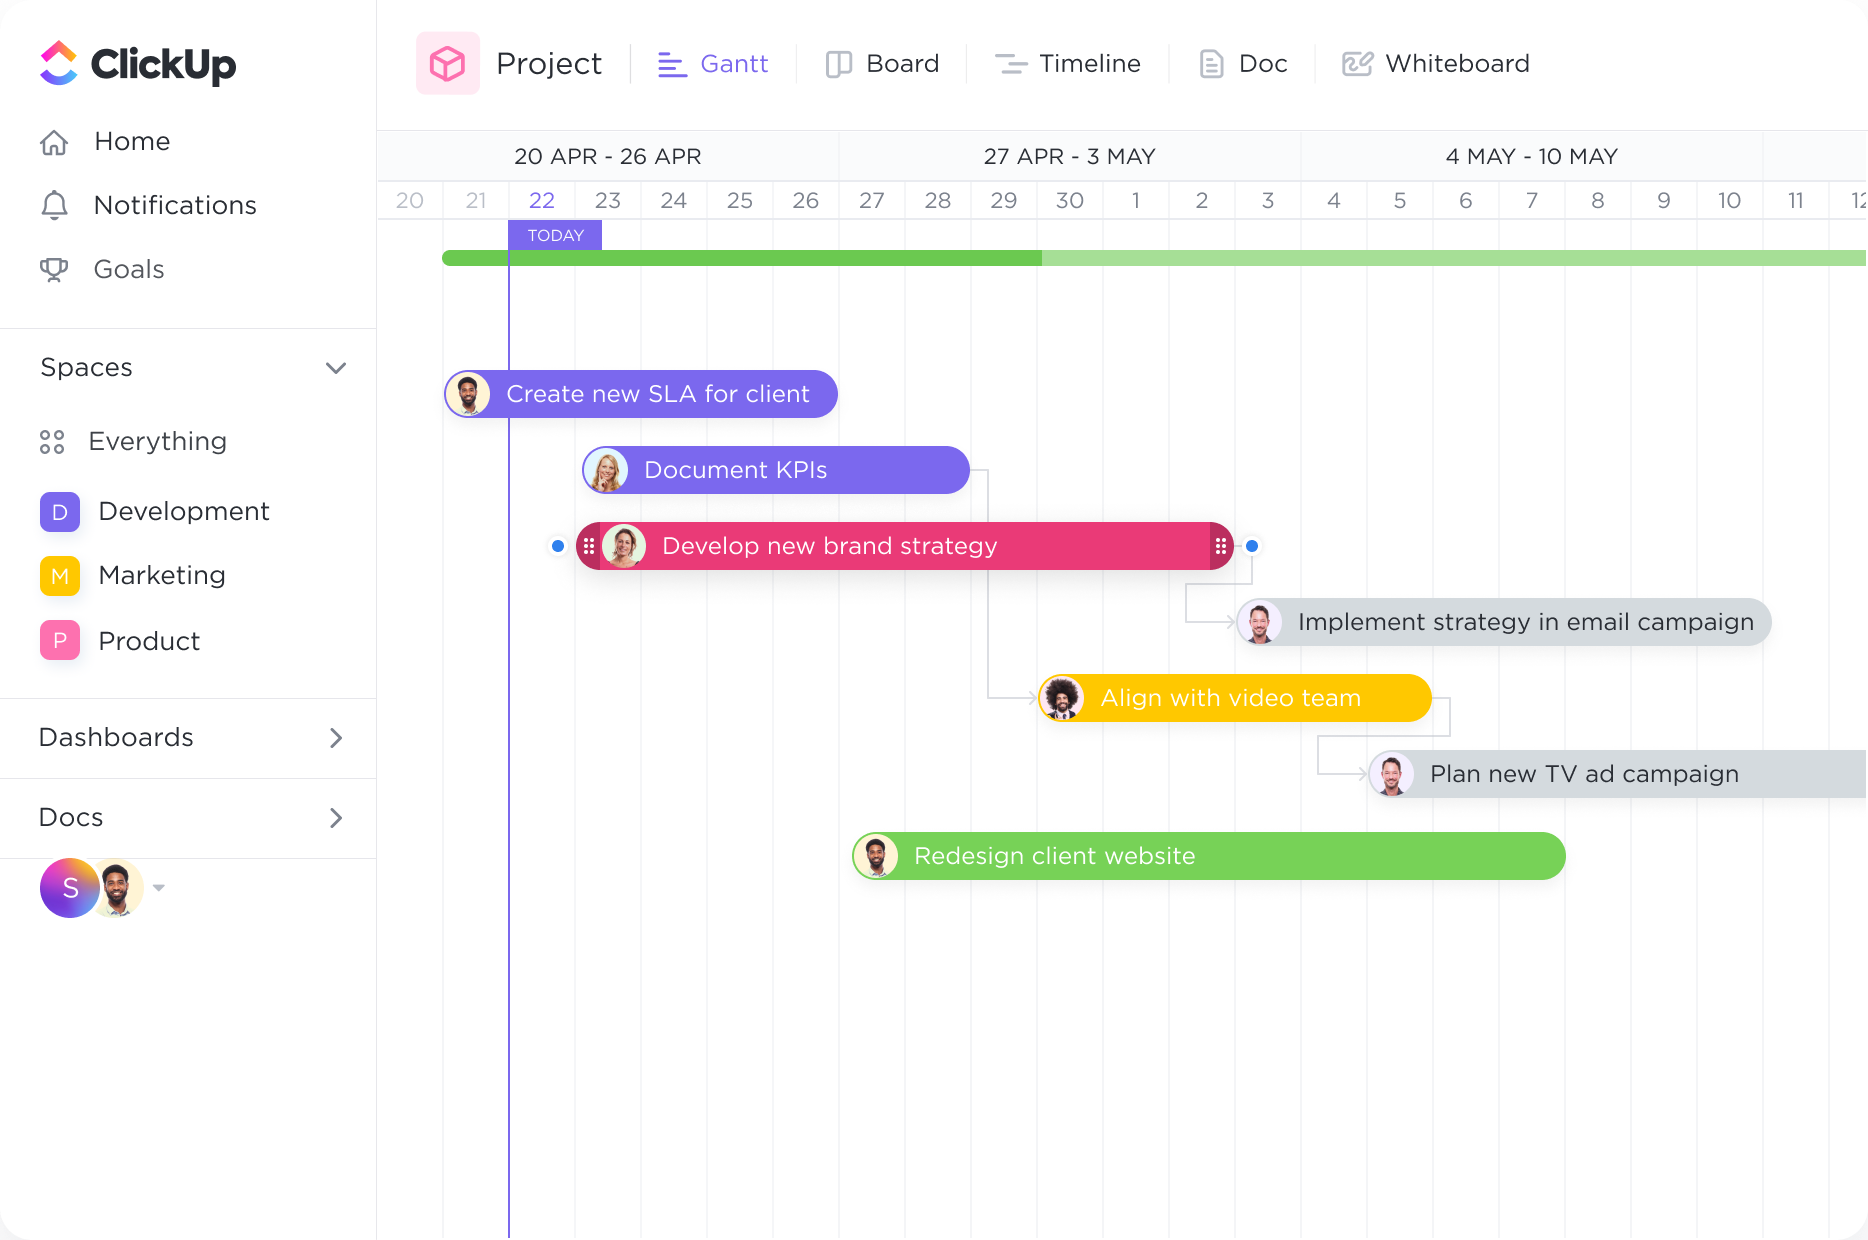
Get a bird's-eye view of all Spaces, Projects, Lists, and tasks in one Gantt chart. With clear coloring options, you can easily see what work is happening and where.

Gantt Charts
Streamline your project management process with ClickUp's powerful Gantt Chart software designed specifically for Internet Service Providers. Plan, track, and visualize your projects with ease using our intuitive interface and extensive features. With ClickUp, you can effortlessly create custom Gantt Charts that fit the unique needs of your ISP business, ensuring efficient project execution and seamless collaboration. Take control of your projects and maximize productivity with ClickUp's Gantt Chart software today.
Free forever. No credit card.

Overview
Get a bird's-eye view of all Spaces, Projects, Lists, and tasks in one Gantt chart. With clear coloring options, you can easily see what work is happening and where.

Tracking
Intelligent dependency-path tracking shows you where potential bottlenecks might exist to prevent inefficiencies.
Internet service providers often undertake large-scale projects to upgrade their network infrastructure. Gantt charts can be used to plan and manage these projects, including activities such as equipment procurement, network installation, and testing. By visualizing the project timeline and milestones, ISPs can ensure that the upgrade is completed on schedule and minimize service disruptions for their customers.
Gantt charts are useful for ISPs to allocate resources effectively, including personnel and equipment, to various tasks and projects. By visualizing resource availability and workload distribution, ISPs can optimize resource utilization, prevent bottlenecks, and ensure that tasks are completed efficiently. This helps to improve productivity and customer satisfaction.
When ISPs are expanding their services to new areas or launching new products, Gantt charts can help with planning and monitoring the rollout process. This includes activities such as site surveys, infrastructure setup, service activation, and customer onboarding. By using Gantt charts, ISPs can ensure a smooth and organized rollout, minimizing delays and ensuring a positive customer experience.
Maintaining and upgrading network infrastructure is crucial for ISPs to provide reliable and high-quality services. Gantt charts can be used to schedule and track routine maintenance tasks, equipment upgrades, and software updates. By visualizing these activities, ISPs can ensure that maintenance tasks are performed regularly, minimizing downtime and service disruptions.
Gantt charts can be utilized by ISPs to manage customer support activities and meet service level agreements (SLAs). This includes activities such as ticket resolution, response times, and service escalations. By using Gantt charts, ISPs can allocate resources effectively to meet customer demands, track progress, and ensure that SLAs are met consistently.
Maintaining network security and responding to incidents is a critical aspect of ISP operations. Gantt charts can be used to plan and manage security audits, vulnerability assessments, and incident response activities. By visualizing these tasks, ISPs can ensure that security measures are implemented timely, vulnerabilities are addressed promptly, and incidents are handled efficiently, minimizing the impact on their network and customers.
A Gantt chart can help internet service providers track and visualize the timeline for each installation and service activation, allowing them to efficiently allocate resources and manage customer expectations.
A Gantt chart can serve as a central platform for collaboration between the office and field technicians, enabling them to visually track their individual tasks, coordinate schedules, and ensure timely completion of installations and repairs.
By visualizing the workload and capacity of field technicians in a Gantt chart, internet service providers can easily identify areas where resources are stretched thin or potential bottlenecks may occur. This allows them to proactively allocate additional resources or adjust schedules to prevent delays.
A Gantt chart can be used to track and prioritize customer service and support requests, ensuring that they are addressed in a timely manner and preventing any potential backlog or delays in resolving customer issues.
Internet service providers can use a Gantt chart to plan and schedule routine maintenance and upgrades, enabling them to minimize service disruptions and ensure that necessary updates are completed within designated timeframes.
For internet service providers looking to expand their network infrastructure, a Gantt chart can help plan and track the various tasks involved, such as site surveys, equipment installation, and network testing. This ensures that the expansion project stays on schedule and that new service areas are activated within the planned timeline.
Gantt chart software can help you manage and track multiple internet service provider projects by providing a visual representation of each project's timeline, tasks, and dependencies. This allows you to identify potential scheduling conflicts, allocate resources efficiently, and track project progress in real-time. It also enables effective communication and collaboration among team members, ensuring streamlined project management and successful completion of all projects.
Gantt chart software for internet service providers can provide a visual timeline of network infrastructure projects, allowing for better project planning and resource allocation. It enables tracking of tasks, dependencies, and milestones, ensuring efficient project coordination. Additionally, it facilitates communication among team members and stakeholders, enhances documentation and reporting, and helps identify potential bottlenecks or delays in service deployment.
Yes, Gantt chart software can help optimize resource allocation and scheduling for internet service provider projects by visually representing project timelines and dependencies. It allows for the identification of potential resource conflicts and bottlenecks, enabling efficient allocation of resources. Additionally, it facilitates tracking project progress and adjusting schedules in real-time, ensuring timely completion and efficient project management.