Activity
Track your progress at every step.
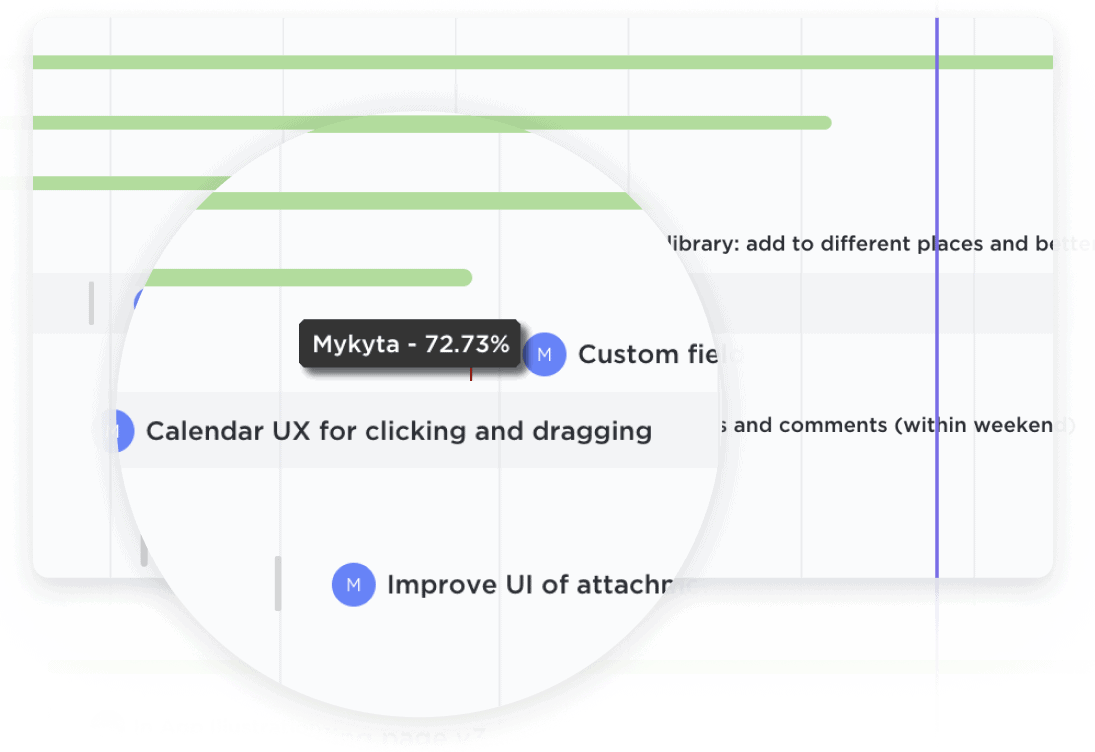
Easily update projects with a simple drag-and-drop action to collaborate amongst your team in real-time. Dynamic progress percentages provide a detailed snapshot.

Gantt Charts
Create dynamic and visually stunning Gantt charts with ClickUp, the ultimate Gantt chart software for Information Professionals. Streamline your project planning process and easily track progress with intuitive features like drag-and-drop functionality and real-time collaboration. Whether you're managing complex timelines or organizing team tasks, ClickUp's Gantt chart software empowers you to effortlessly visualize and manage your projects with precision and efficiency. Take control of your project management with ClickUp's Gantt chart software today.
Free forever. No credit card.

Activity
Easily update projects with a simple drag-and-drop action to collaborate amongst your team in real-time. Dynamic progress percentages provide a detailed snapshot.

Dependencies
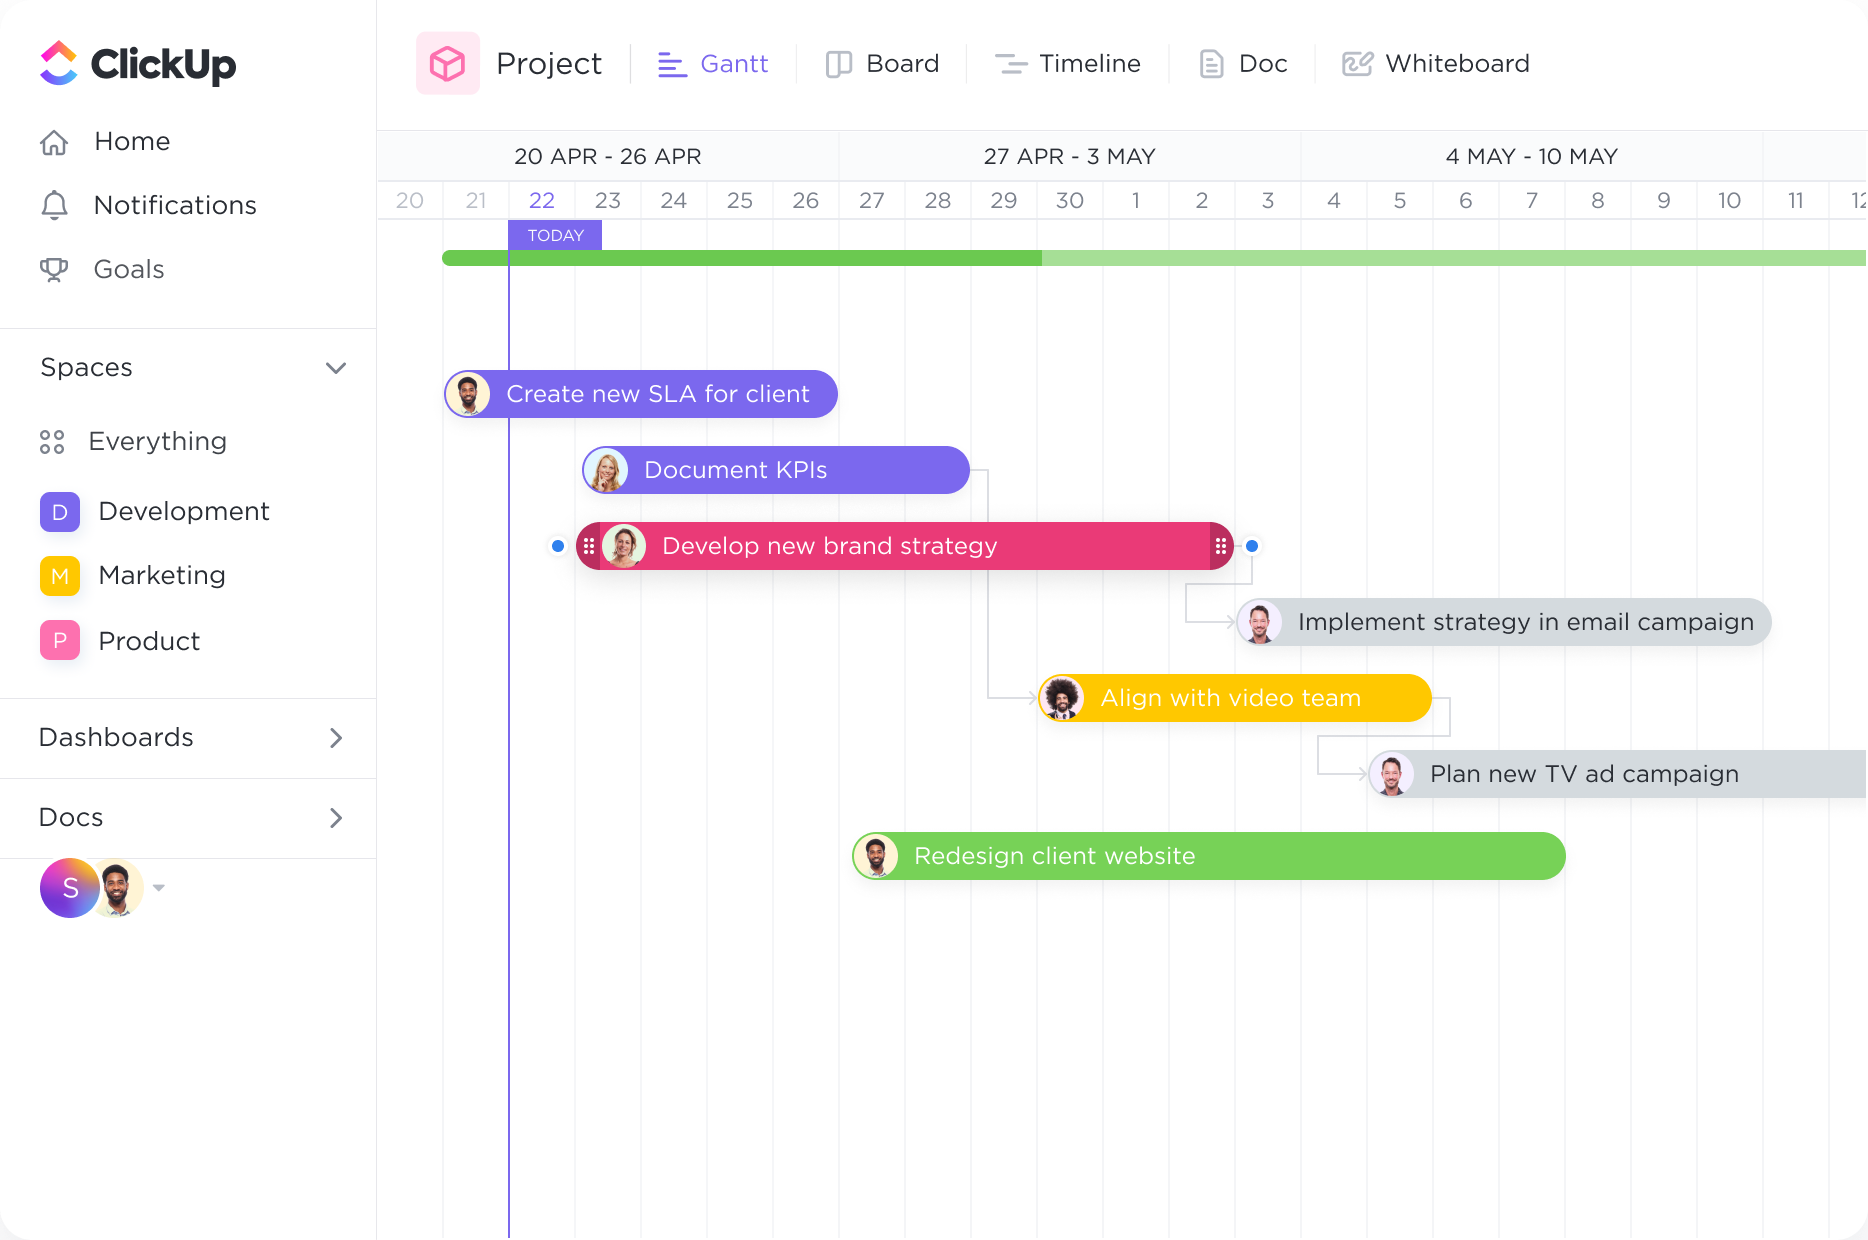
Create tasks and link them with dependencies. Dragging a task with dependencies will automatically reschedule tasks in the chain
Information professionals often work on projects that involve organizing and managing large amounts of data or information. Gantt charts can be used to visualize project timelines, deadlines, and milestones, allowing information professionals to effectively plan and track the progress of their projects. This helps ensure that tasks are completed on time and that project goals are achieved efficiently.
Information professionals often have to manage and optimize the use of resources, such as personnel and equipment, to complete their projects. Gantt charts can be used to allocate resources effectively by visually representing resource availability and utilization. This allows information professionals to identify any resource constraints or bottlenecks and make adjustments to ensure that resources are utilized optimally throughout the project.
Information professionals often work in teams, collaborating with colleagues to complete projects. Gantt charts can facilitate team collaboration by allowing team members to allocate tasks, track progress, and coordinate their efforts. This helps ensure that everyone is aware of their responsibilities and that work is distributed evenly among team members. Gantt charts also provide a centralized view of the project, making it easier for team members to communicate and stay aligned.
Information professionals involved in research projects can use Gantt charts to plan and schedule their research activities. Gantt charts provide a visual representation of the research timeline, allowing information professionals to break down their research into manageable phases and set realistic deadlines. This helps ensure that research activities are conducted in a systematic and organized manner, leading to more efficient and successful research outcomes.
Information professionals often create and publish content, such as articles, reports, or blog posts. Gantt charts can be used to manage the editorial calendar and publishing schedule for content creation. By visualizing the content creation process, including tasks like researching, writing, editing, and publishing, information professionals can ensure that content is produced and published on time. Gantt charts also help identify any potential bottlenecks or delays in the content creation process, allowing for timely adjustments and ensuring a smooth publishing workflow.
Information professionals often have to juggle multiple projects and tasks simultaneously. A Gantt chart can help them visualize and prioritize their workload, ensuring that all projects are properly managed and deadlines are met.
Many information projects have dependencies and interdependencies between tasks. A Gantt chart can clearly display these relationships, allowing information professionals to understand the impact of delays or changes in one task on the overall project timeline.
Information professionals often have limited resources, such as staff, budget, or equipment. A Gantt chart can help them allocate these resources effectively by visualizing their availability and utilization across different projects and tasks.
Information professionals often work with stakeholders who need to be updated on the status and progress of projects. A Gantt chart can be shared with stakeholders to provide a clear visual representation of the project timeline, milestones, and progress, facilitating effective communication and transparency.
Information projects can be prone to various risks, such as data quality issues, technology limitations, or changing requirements. A Gantt chart can help information professionals identify potential risks and plan mitigation strategies, ensuring that projects stay on track and deliver the desired outcomes.
By visualizing project timelines in a Gantt chart, information professionals can identify opportunities for optimizing the sequencing and duration of tasks. This can help them streamline processes, reduce bottlenecks, and improve overall project efficiency.
Gantt Chart software can help information professionals in managing their projects effectively by providing a visual representation of project timelines and task dependencies. It allows for better resource allocation, tracking of project progress, and identification of potential bottlenecks or delays. This enhances project coordination, communication, and decision-making, ultimately leading to more efficient project management for information professionals.
There is no specific Gantt Chart software that is recommended for information professionals as the choice of software will depend on individual needs and preferences. However, popular options for Gantt Chart software include Microsoft Project, Trello, Asana, and Smartsheet. It is important to evaluate features, pricing, and integration capabilities to find the best fit for managing projects and tasks in the information profession.
Information professionals should look for Gantt Chart software that offers features such as task and milestone tracking, resource management, dependency management, and customizable views. Additionally, software that provides collaboration and communication tools, integration with other project management tools, and the ability to generate reports and analytics will greatly enhance their ability to plan, organize, and manage projects effectively.