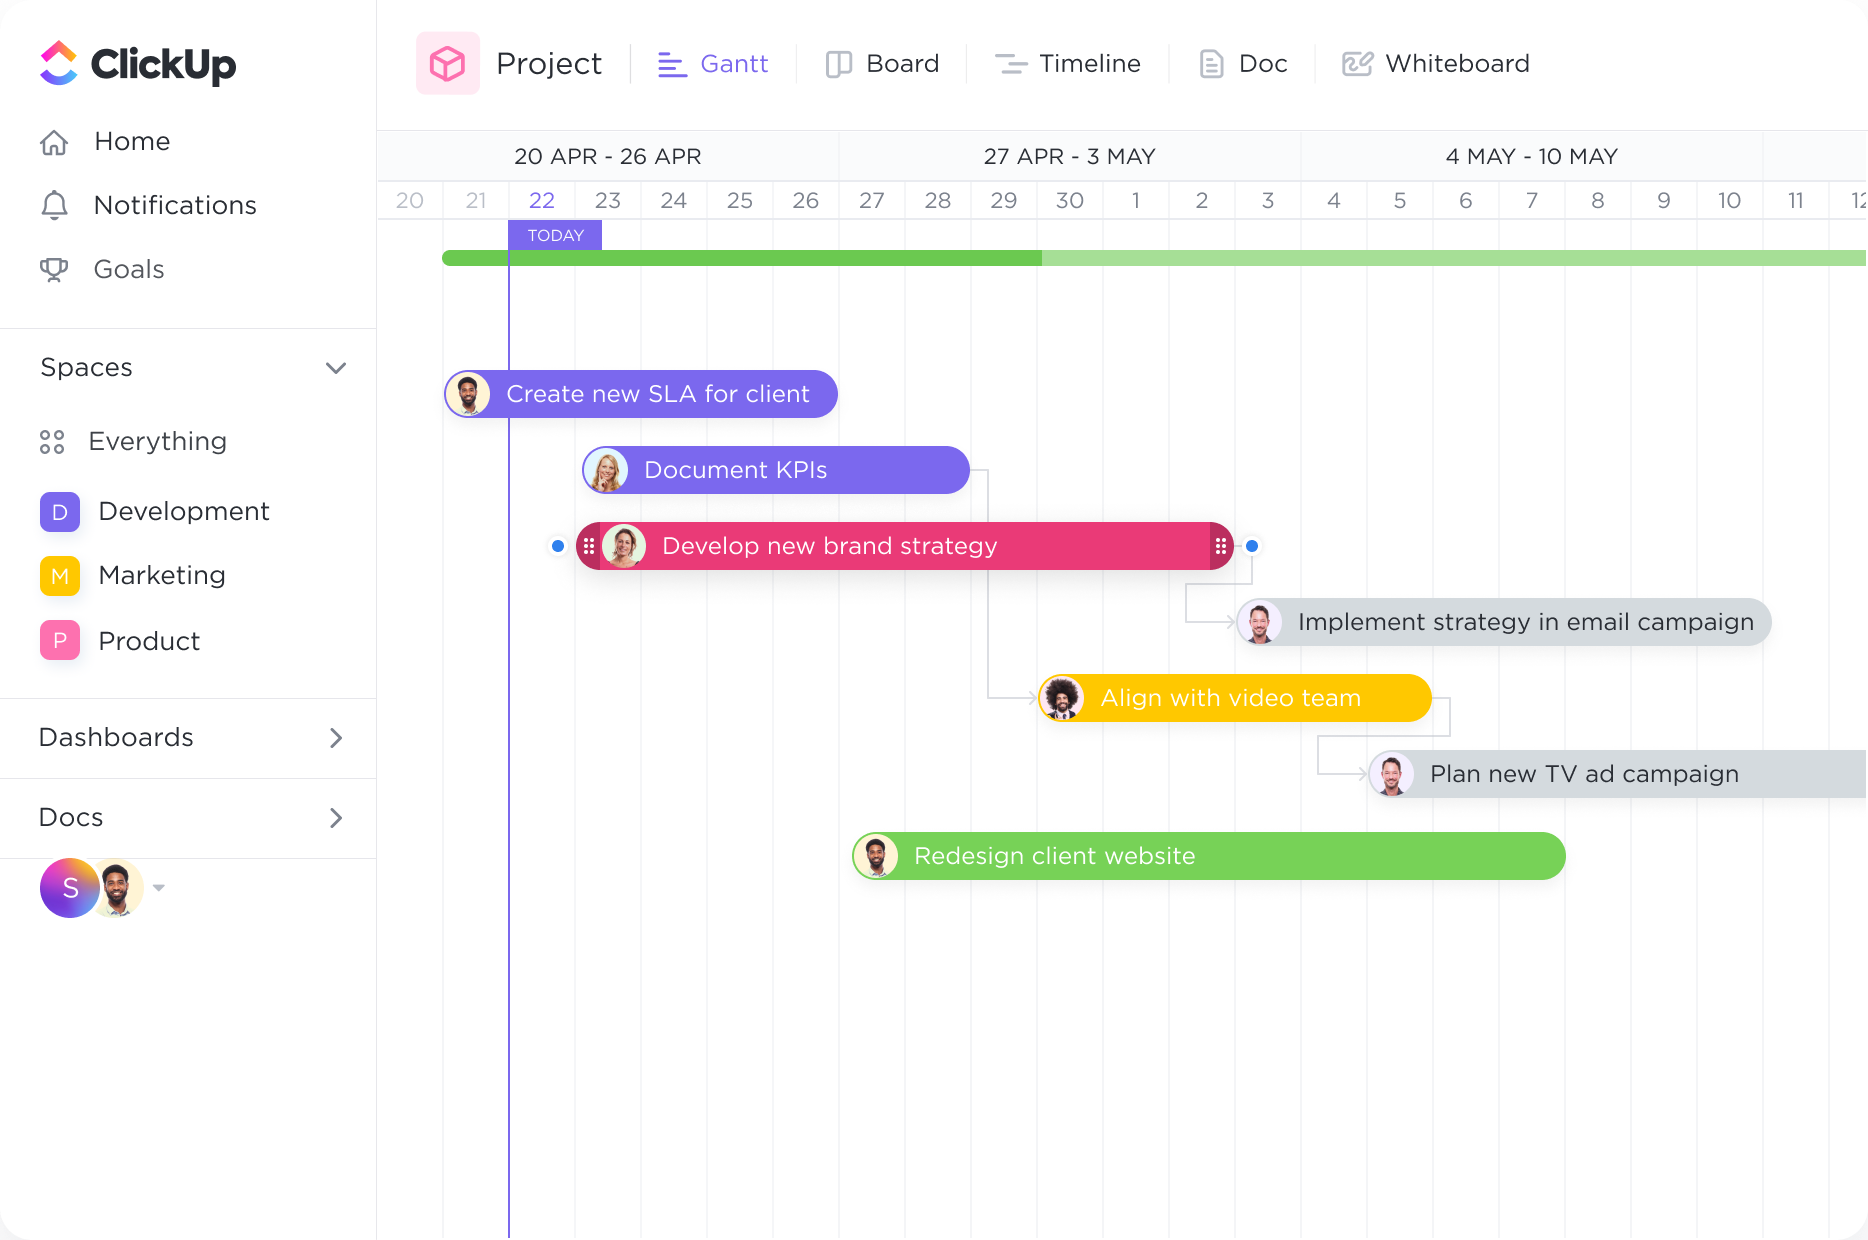
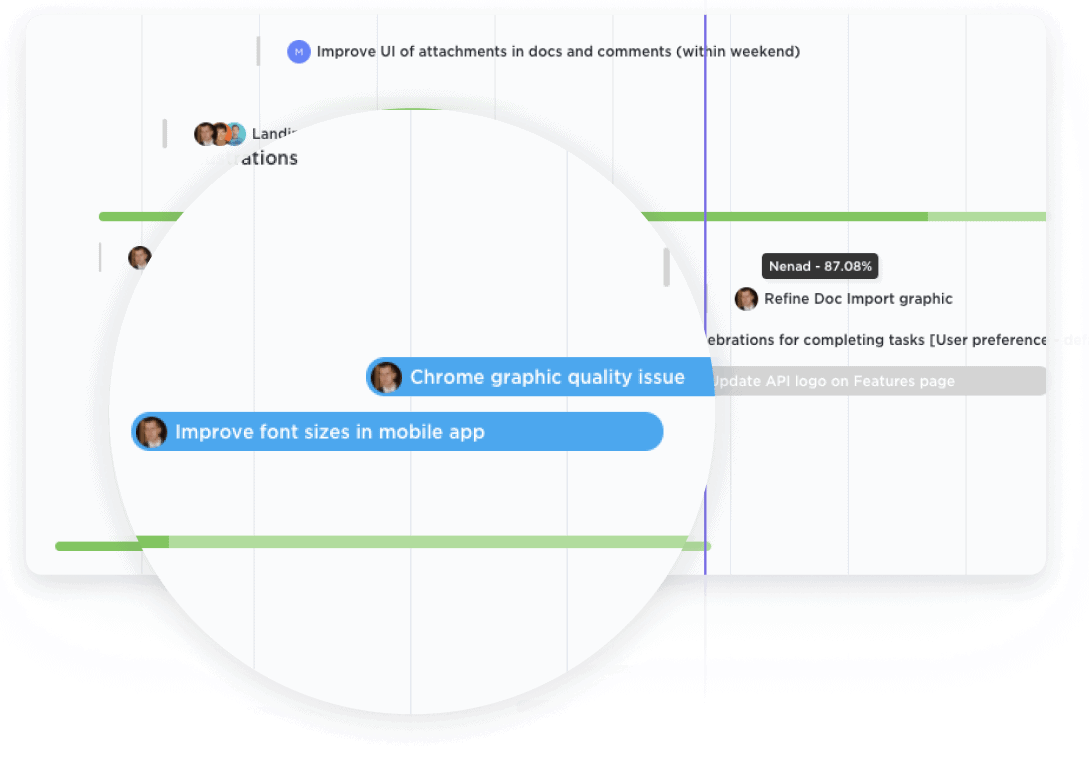
Tracking
Eliminate bottlenecks before they happen.
Intelligent dependency-path tracking shows you where potential bottlenecks might exist to prevent inefficiencies.
Gantt Charts
Streamline your gas company's project management with ClickUp's powerful Gantt Chart software. Plan, track, and visualize your projects with ease, using interactive Gantt charts that help you stay organized and on schedule. From exploration to production, ClickUp's Gantt Chart software is the perfect tool for gas companies looking to optimize their operations and maximize their productivity. Try ClickUp today and see the difference it can make for your gas company's project management.
Free forever. No credit card.

Tracking
Intelligent dependency-path tracking shows you where potential bottlenecks might exist to prevent inefficiencies.
Overview
Get a bird's-eye view of all Spaces, Projects, Lists, and tasks in one Gantt chart. With clear coloring options, you can easily see what work is happening and where.

Gas companies often undertake large-scale infrastructure projects, such as building pipelines or constructing storage facilities. Gantt charts can be used to plan and track the various phases of these projects, including land acquisition, design, construction, and commissioning. By visualizing the timelines and dependencies of each task, gas companies can ensure efficient project management and timely completion of infrastructure development and maintenance projects.
Efficient management of resources and equipment is crucial for gas companies to optimize operations and minimize downtime. Gantt charts can help in scheduling and allocating resources such as personnel, vehicles, and equipment for different tasks, ensuring that they are utilized effectively and efficiently. This allows gas companies to streamline their operations, reduce costs, and improve overall productivity.
Gas companies operate in a heavily regulated industry, and compliance with various regulations and reporting requirements is essential. Gantt charts can be utilized to plan and track the tasks and deadlines associated with compliance and regulatory reporting. By visualizing these requirements and their timelines, gas companies can ensure timely completion of necessary documentation, inspections, and audits, avoiding penalties and maintaining regulatory compliance.
Regular maintenance and inspections are critical for the safe and efficient operation of gas facilities. Gantt charts can be used to schedule and track these maintenance activities, ensuring that they are performed at the appropriate intervals and in a timely manner. By visualizing the maintenance schedule, gas companies can proactively identify and address potential issues, minimize downtime, and ensure the integrity and reliability of their infrastructure.
Gas companies need to have robust emergency response plans in place to address any potential incidents or accidents. Gantt charts can be utilized to outline the various tasks and activities involved in emergency response planning, such as training, drills, communication protocols, and equipment readiness. By visualizing these tasks and their dependencies, gas companies can ensure that their emergency response plans are comprehensive, well-coordinated, and executed efficiently.
Managing project costs is crucial for gas companies to ensure profitability and financial sustainability. Gantt charts can be used to track project expenses, including budget allocation, resource costs, and procurement timelines. By visualizing the cost elements and their timelines, gas companies can monitor and control project expenditures, make informed decisions, and avoid cost overruns. This helps in maintaining financial discipline and achieving project objectives within budgetary constraints.
A Gantt chart can help gas companies create and manage a detailed schedule for exploration and production activities, including drilling, well completion, and infrastructure development.
A Gantt chart can provide a visual representation of the availability and allocation of resources such as drilling rigs, equipment, and personnel, ensuring efficient and effective utilization.
Gas companies often need to schedule maintenance and repair activities for pipelines, processing plants, and storage facilities. A Gantt chart can help track these activities, ensuring timely execution and minimizing downtime.
Gas companies need to adhere to various compliance and regulatory requirements. A Gantt chart can help track and manage tasks related to environmental monitoring, safety inspections, and reporting, ensuring compliance with applicable regulations.
Gas companies may be involved in constructing new pipelines, processing plants, or storage facilities. A Gantt chart can help in planning and managing these construction projects, tracking progress, and ensuring timely completion.
A Gantt chart can be used to provide a clear visual representation of project progress to stakeholders, such as investors, regulators, and community members. It enables effective communication and ensures transparency in project execution.
Gantt chart software can help gas companies in planning and scheduling complex projects, tracking progress, and managing resources effectively. It enables visual representation of project timelines, dependencies, and critical paths, allowing for better project coordination and decision-making. Additionally, it facilitates resource allocation, identifies potential bottlenecks, and enhances communication among team members, resulting in improved efficiency and productivity for gas companies.
Gantt chart software can help gas companies effectively manage and track their projects by providing a visual representation of project timelines, tasks, and dependencies. It allows for the allocation of resources, identification of scheduling conflicts, and tracking of project progress. This enables better coordination, efficient resource management, and timely decision-making, resulting in improved project outcomes for gas companies.
Yes, some Gantt chart software offer features tailored to the needs of gas companies, such as resource management for tracking equipment and personnel availability, integration with geographic information systems (GIS) for visualizing pipeline routes, and risk management tools for identifying and mitigating potential hazards in gas operations.