Overview
Manage all of your projects in one place.
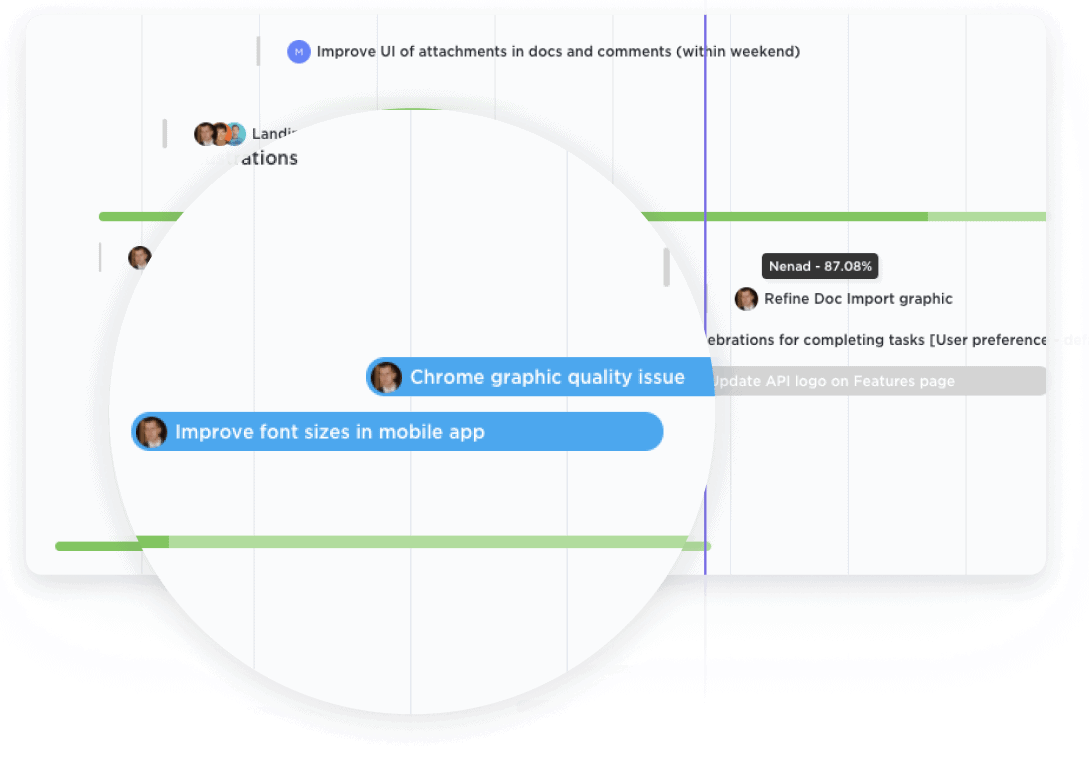
Get a bird's-eye view of all Spaces, Projects, Lists, and tasks in one Gantt chart. With clear coloring options, you can easily see what work is happening and where.

Gantt Charts
Streamline your project management process with ClickUp, the ultimate Gantt Chart software for Environmental Scientists. Plan, track, and visualize your projects with ease using our intuitive interface. From research to implementation, ClickUp empowers you to create customized Gantt Charts that perfectly align with your unique needs. Stay organized, meet deadlines, and achieve success - all with ClickUp. Try it today and revolutionize your project management experience.
Free forever. No credit card.

Overview
Get a bird's-eye view of all Spaces, Projects, Lists, and tasks in one Gantt chart. With clear coloring options, you can easily see what work is happening and where.

Dependencies
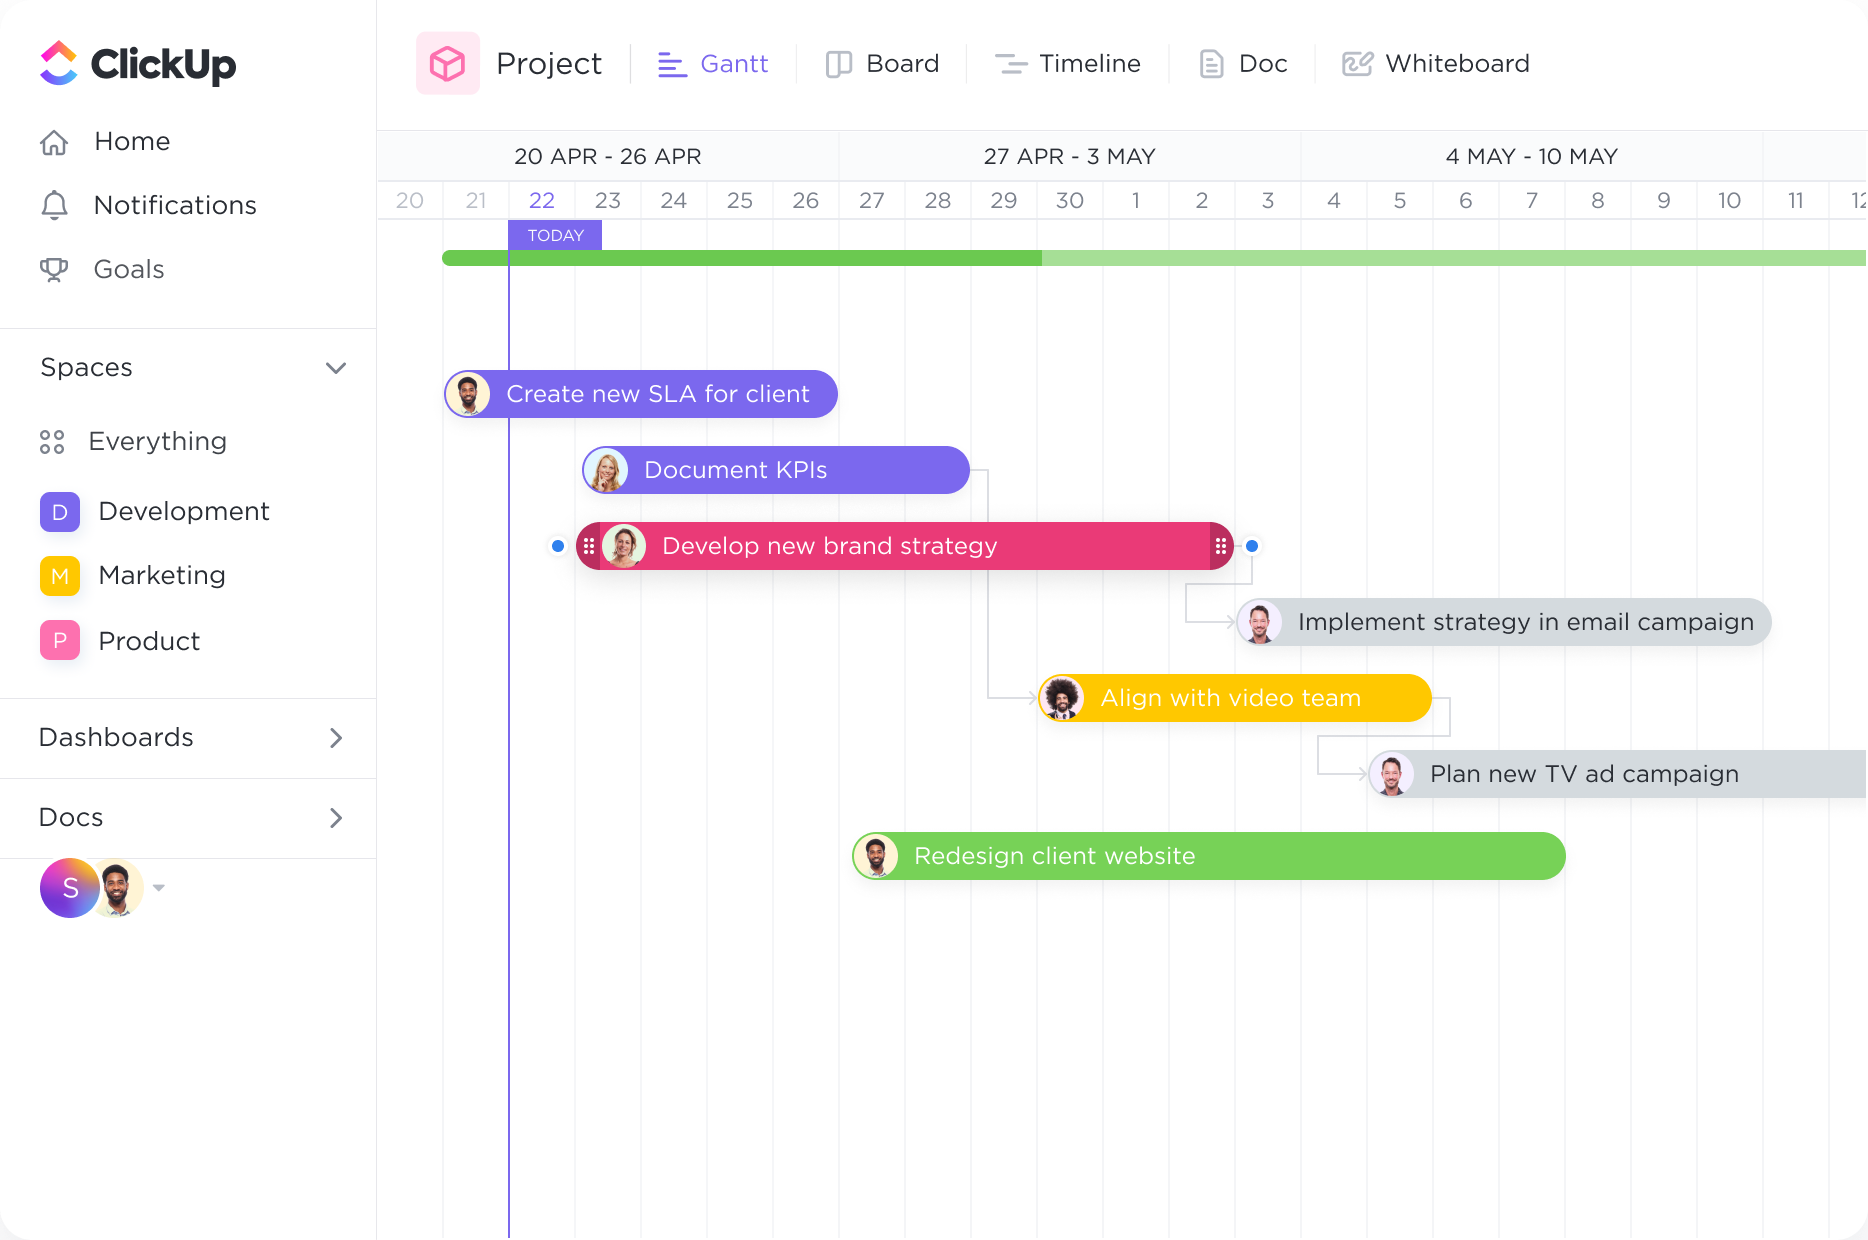
Create tasks and link them with dependencies. Dragging a task with dependencies will automatically reschedule tasks in the chain
Environmental scientists often work on complex projects with multiple phases and deadlines. Gantt charts provide a visual representation of the project timeline, allowing scientists to easily track and manage each stage of the project. By visualizing key milestones, deadlines, and dependencies, scientists can effectively plan and allocate resources to ensure the project stays on track.
Environmental research projects require the allocation of various resources, including personnel, equipment, and funding. Gantt charts enable scientists to allocate these resources efficiently by providing a clear overview of resource availability and utilization throughout the project. This helps scientists optimize resource allocation, prevent bottlenecks, and ensure that resources are used effectively to achieve project objectives.
Environmental research often involves collaboration among multiple scientists and teams. Gantt charts facilitate collaborative project planning by allowing scientists to assign tasks, set deadlines, and track progress in a centralized platform. This promotes effective communication, coordination, and accountability among team members, ensuring that everyone is aligned and working towards the same goals.
Environmental research projects are subject to various risks and uncertainties, such as weather conditions, regulatory changes, or data collection challenges. Gantt charts can be used to identify potential risks and plan for contingencies. By incorporating risk assessment and mitigation strategies into the Gantt chart, scientists can proactively address challenges, adjust timelines, and allocate resources accordingly to minimize project disruptions.
A Gantt chart can help environmental scientists effectively plan and allocate their time across multiple research projects by displaying the schedule and timeline for each project.
Environmental scientists often have to coordinate fieldwork activities and data collection efforts. A Gantt chart can serve as a visual tool to track the progress of fieldwork tasks, assign responsibilities to team members, and ensure that data collection is completed on time.
Gantt charts can be used to set and track project milestones and deadlines in environmental research. This allows scientists to monitor progress and ensure that projects stay on schedule.
Gantt charts can help environmental scientists manage and allocate resources, such as equipment, personnel, and funding, by visually depicting their availability and usage across different projects and tasks.
Environmental research often involves complex processes and dependencies. A Gantt chart can help identify critical tasks and their dependencies, allowing scientists to prioritize and allocate resources accordingly.
Gantt charts can be shared with stakeholders, such as funding agencies or collaborators, to provide a clear visual representation of project progress and findings. This helps in effective communication and ensuring alignment among all parties involved.
Gantt chart software can provide environmental scientists with a visual representation of project timelines, tasks, and dependencies. It enables efficient resource allocation and helps identify potential scheduling conflicts. By offering a clear overview of project progress, milestones, and deadlines, it enhances communication and collaboration among team members. Additionally, Gantt charts facilitate the tracking of project data and enable real-time adjustments, ensuring effective project management for environmental scientists.
Yes, you can integrate data from other environmental monitoring tools into Gantt chart software. This allows you to track project progress in real-time and make informed decisions based on the data collected from these tools.
Gantt chart software can visually map out project timelines, tasks, and dependencies, allowing environmental scientists to easily identify potential bottlenecks or delays. By tracking progress and comparing it to the planned schedule, scientists can take proactive measures to mitigate any issues. This includes adjusting task durations, reallocating resources, and reorganizing the project timeline, ensuring smoother project execution and timely completion.