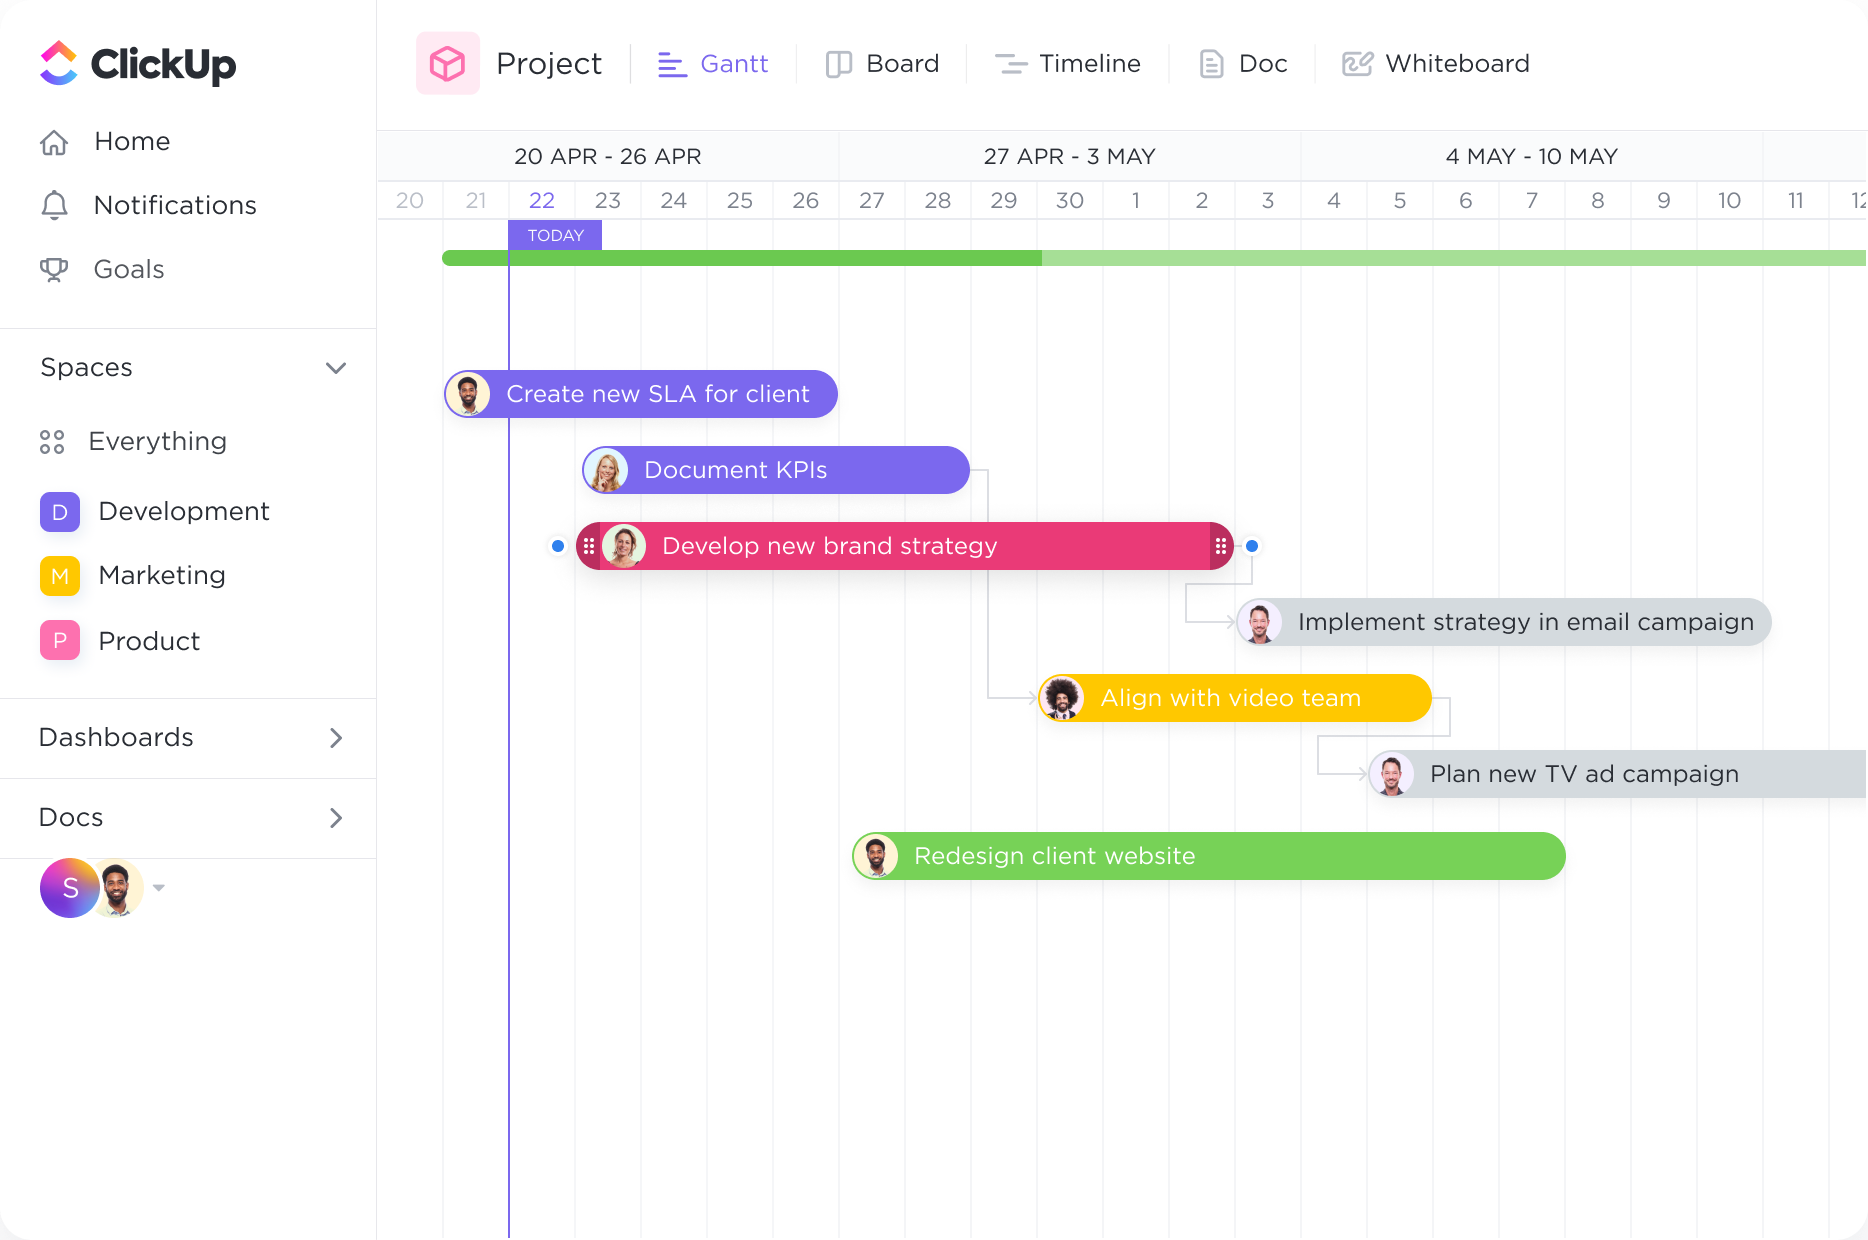
Tracking
Eliminate bottlenecks before they happen.
Intelligent dependency-path tracking shows you where potential bottlenecks might exist to prevent inefficiencies.
Gantt Charts
Streamline your asset management processes with ClickUp's powerful Gantt Chart software. Plan, track, and manage your projects with ease using our intuitive interface and customizable features. Stay on top of deadlines, allocate resources efficiently, and collaborate seamlessly with your team. Take your asset management to the next level with ClickUp's Gantt Chart software.
Free forever. No credit card.

Tracking
Intelligent dependency-path tracking shows you where potential bottlenecks might exist to prevent inefficiencies.
Visualize
Organize how you see your tasks with quick sorting. Create cascading views with a single click to easily see what important tasks are coming next.
Asset managers can utilize Gantt charts to effectively manage and allocate portfolios. By visualizing the timeline of various investments, asset managers can track the performance, diversification, and rebalancing of assets. Gantt charts provide a comprehensive overview of portfolio allocation, enabling asset managers to make informed decisions and optimize their investment strategies.
Asset managers often undertake projects such as mergers and acquisitions, fund launches, or infrastructure development. Gantt charts can be used to plan and execute these projects by outlining the necessary tasks, dependencies, and timelines. This allows asset managers to track progress, identify bottlenecks, and ensure that projects are completed within set deadlines and budgets.
Compliance and regulatory reporting are critical aspects of asset management. Gantt charts can help asset managers stay on top of compliance requirements by visualizing reporting deadlines, milestones, and necessary tasks. By utilizing Gantt charts, asset managers can ensure timely submission of reports, monitor progress, and maintain compliance with industry regulations.
Monitoring the performance of assets is essential for asset managers. Gantt charts can be used to track key performance indicators (KPIs), visualize performance trends, and generate performance reports. This allows asset managers to assess the effectiveness of their investment strategies, identify underperforming assets, and make data-driven decisions to optimize portfolio performance.
Effective risk management is crucial for asset managers to protect investments and minimize potential losses. Gantt charts can be utilized to identify and mitigate risks by visualizing risk assessment tasks, risk mitigation strategies, and monitoring progress. By incorporating risk management into Gantt charts, asset managers can proactively address potential risks, implement risk mitigation plans, and safeguard their portfolios.
A Gantt chart can provide a clear overview of all investment portfolios, their respective timelines, and key milestones, allowing asset managers to effectively monitor and manage their portfolios.
A Gantt chart can serve as a central platform for asset managers and their team members to track and coordinate investment activities, ensuring that tasks are assigned, deadlines are met, and resources are allocated efficiently.
A Gantt chart can help asset managers identify and understand the dependencies and interdependencies between different investment activities, enabling them to plan and prioritize their tasks accordingly.
By visualizing the progression of investment activities in a Gantt chart, asset managers can easily pinpoint areas where the process is slowing down or where tasks are being delayed, allowing them to take proactive measures to address these issues and keep their investments on track.
A Gantt chart can be shared with clients, stakeholders, and team members to provide a clear visual representation of the investment strategy, timeline, and progress. This helps asset managers effectively communicate their plans, demonstrate progress, and manage expectations.
Gantt chart software can provide asset managers with a visual representation of project timelines, enabling them to effectively plan and allocate resources. It allows for the tracking of project progress, highlighting any potential delays or bottlenecks. Additionally, Gantt charts enhance communication and collaboration among team members, ensuring efficient workflow management and timely decision-making for asset managers.
Gantt chart software can help asset managers track and manage project timelines effectively by providing a visual representation of tasks, milestones, and dependencies. It allows for the identification of critical paths and potential delays, enabling proactive adjustments to ensure timely project completion. Additionally, it facilitates collaboration and communication among team members, ensuring efficient resource allocation and effective project management.
Yes, Gantt chart software offers specific features for asset managers, including resource allocation and cost tracking functionalities. These features allow asset managers to effectively allocate resources to different tasks and projects, ensuring optimal utilization and productivity. Additionally, the software enables cost tracking, helping asset managers monitor project expenses and budget adherence in real-time. This allows for better financial management and decision-making throughout the project lifecycle.