Timelines
Stay ahead of every deadline.
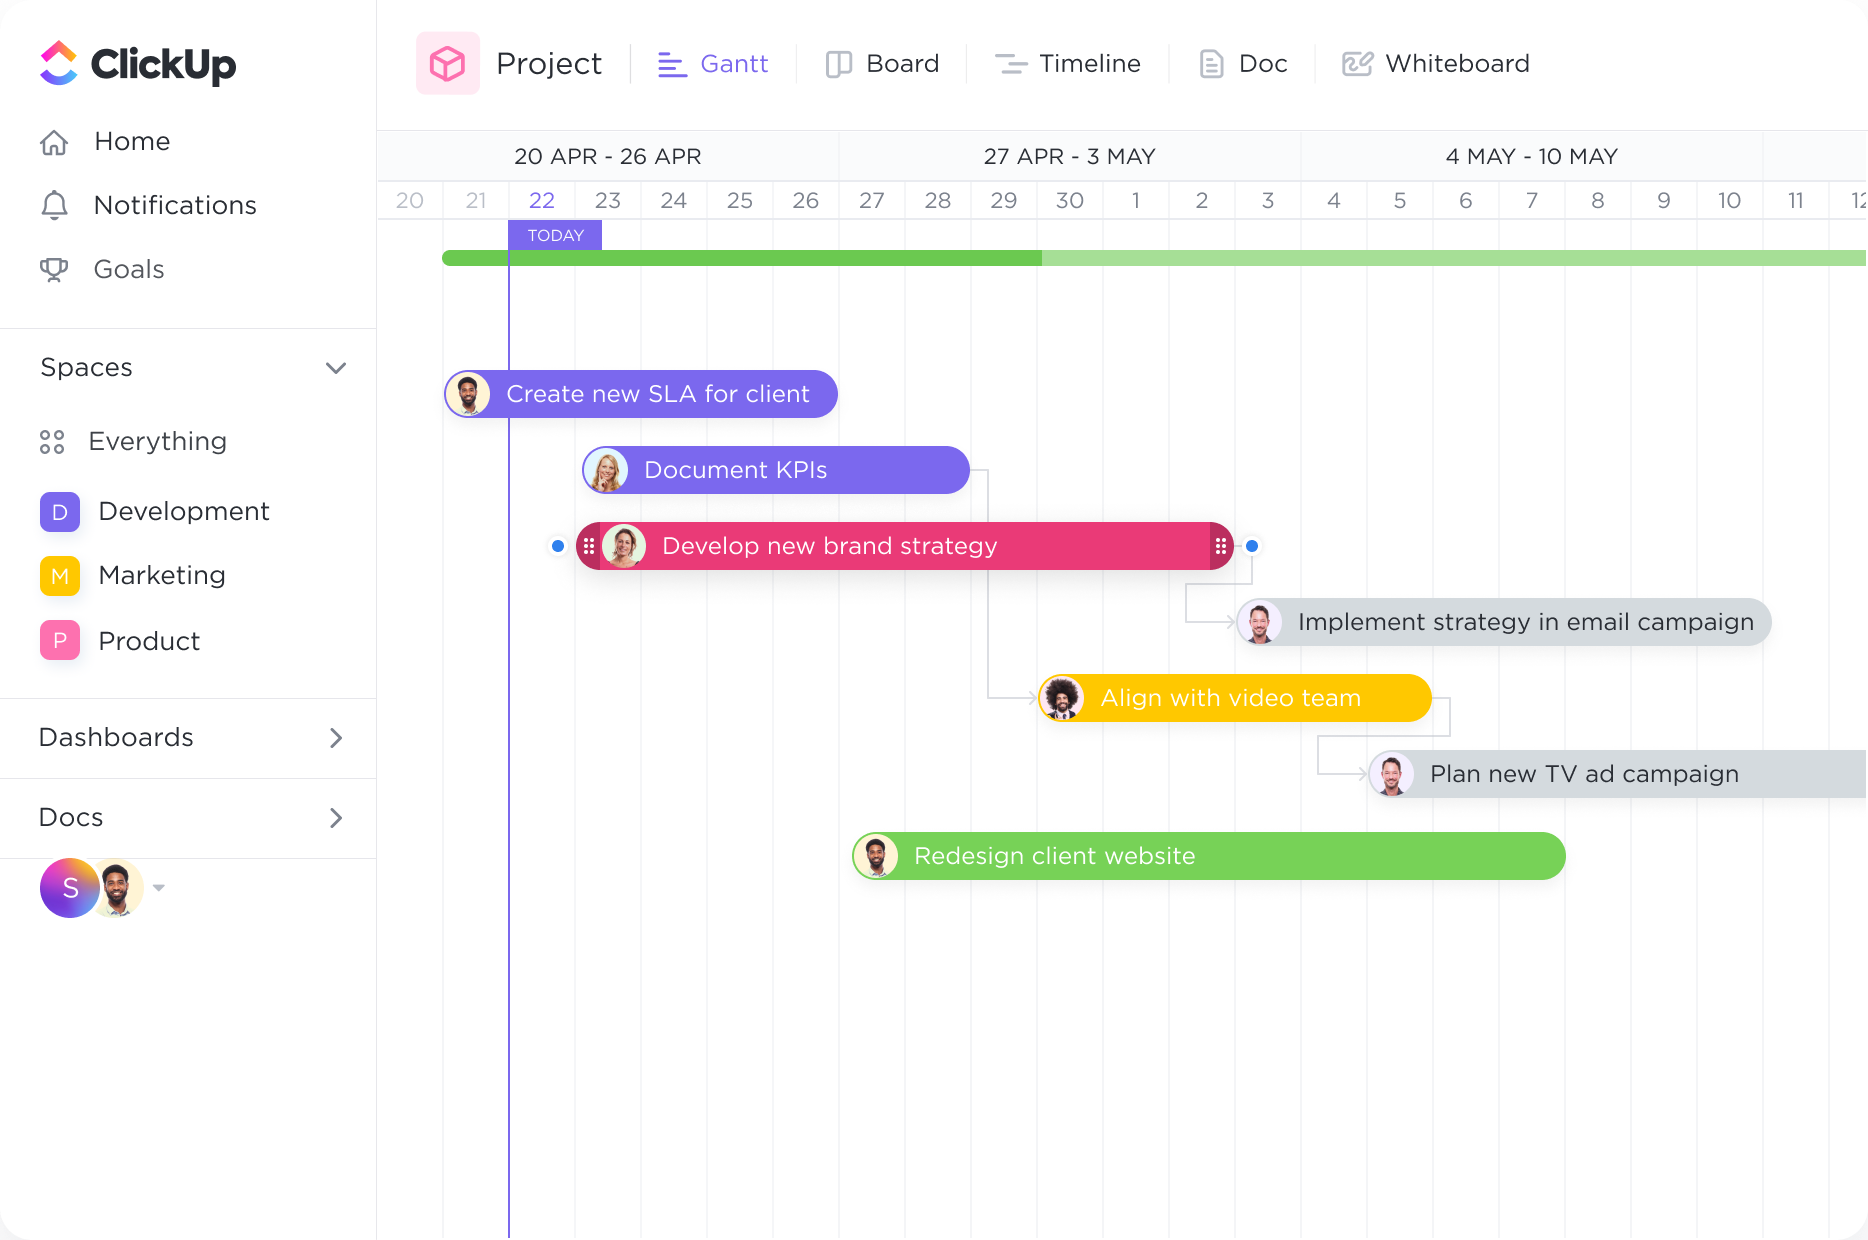
With the Gantt chart's dynamic timeline, you can easily schedule tasks, keep up with project progress, manage deadlines, and handle bottlenecks.
Gantt Charts
Streamline your project management process with ClickUp's powerful Gantt Chart software. Visualize your project timeline, set dependencies, and allocate resources with ease. Whether you're an analyst tracking complex data or managing multiple projects, ClickUp's Gantt Chart software empowers you to stay organized and efficient. Start optimizing your workflow today with ClickUp's intuitive features and make Gantt Charts that are tailored to analysts.
Free forever. No credit card.

Timelines
With the Gantt chart's dynamic timeline, you can easily schedule tasks, keep up with project progress, manage deadlines, and handle bottlenecks.
Overview
Get a bird's-eye view of all Spaces, Projects, Lists, and tasks in one Gantt chart. With clear coloring options, you can easily see what work is happening and where.

Gantt charts can be used in financial analysis to plan and track the various stages of financial reporting. Analysts can use Gantt charts to outline tasks such as data collection, financial modeling, analysis, and report generation. This helps ensure that all necessary steps are completed within the desired timeframe, allowing for accurate and timely financial reporting.
When conducting market research and competitive analysis, analysts can utilize Gantt charts to organize and manage the different stages of the process. This includes tasks such as defining research objectives, gathering data, analyzing competitors, and presenting findings. A Gantt chart provides a visual representation of the research timeline, enabling analysts to stay on track and meet project deadlines.
Gantt charts can also be beneficial in data analysis projects. Analysts can use them to map out the steps involved in data cleaning, transformation, analysis, and visualization. By breaking down the analysis process into smaller tasks and assigning them specific timelines, analysts can ensure that data analysis projects are executed efficiently and effectively.
In the context of risk assessment and management, Gantt charts can help analysts identify, analyze, and mitigate potential risks. By creating a Gantt chart that outlines risk assessment tasks, such as identifying risks, assessing their impact and likelihood, and implementing risk mitigation strategies, analysts can effectively manage and monitor risks throughout the project lifecycle.
Gantt charts can support analysts in identifying and improving business processes within an organization. By using a Gantt chart to map out the current process, analysts can identify bottlenecks, inefficiencies, and areas for improvement. They can then plan and implement process improvement initiatives, tracking their progress and ensuring that they are completed within the designated timeframe.
Analysts can use Gantt charts to evaluate and measure the performance of projects they are involved in. By setting up a Gantt chart that includes project milestones, tasks, and deadlines, analysts can track the progress of the project and compare it against the planned schedule. This allows them to identify any deviations, assess project performance, and make necessary adjustments to ensure successful project completion.
A Gantt chart can help analysts keep track of multiple projects and tasks, allowing them to prioritize and allocate their time effectively.
Analysts often work on projects with interdependent tasks. A Gantt chart can clearly display the dependencies between tasks, ensuring that analysts understand the order in which tasks need to be completed.
With a Gantt chart, analysts can easily track the progress of their projects and ensure that they are meeting deadlines. This visualization can help them identify any delays or bottlenecks and take corrective actions.
A Gantt chart can assist analysts in managing their workload by visualizing the allocation of resources across different tasks and projects. This allows them to identify any potential resource constraints and make adjustments accordingly.
A Gantt chart can serve as a communication tool to share project timelines and progress with stakeholders. It provides a visual representation that is easy to understand, allowing analysts to effectively communicate project status and milestones.
By visualizing project timelines and dependencies, analysts can identify potential risks and plan for contingencies. A Gantt chart helps them proactively manage risks by highlighting critical paths and potential areas of concern.
Gantt chart software can help you track and manage your project tasks as an analyst by visually representing the project timeline, task dependencies, and milestones. It allows you to allocate resources, set deadlines, and monitor task progress in real-time. This enables you to identify potential bottlenecks, adjust task durations, and ensure timely completion of deliverables, improving project efficiency and coordination.
Yes, Gantt chart software allows you to visually map out project timelines and dependencies, enabling the identification of potential bottlenecks or risks. It also facilitates the adjustment of task durations and dependencies in real-time, helping you address any issues promptly. Additionally, you can track and manage project dependencies and risks more effectively by allocating buffer times and assessing the impact of changes on the overall project timeline.
Yes, Gantt chart software can integrate with other tools commonly used by analysts, such as data visualization or reporting software. This integration allows for the seamless transfer of project data, enabling analysts to create comprehensive reports and visualizations that reflect the project's progress, timelines, and milestones. This integration enhances project management capabilities by providing a centralized platform for data analysis, reporting, and decision-making.