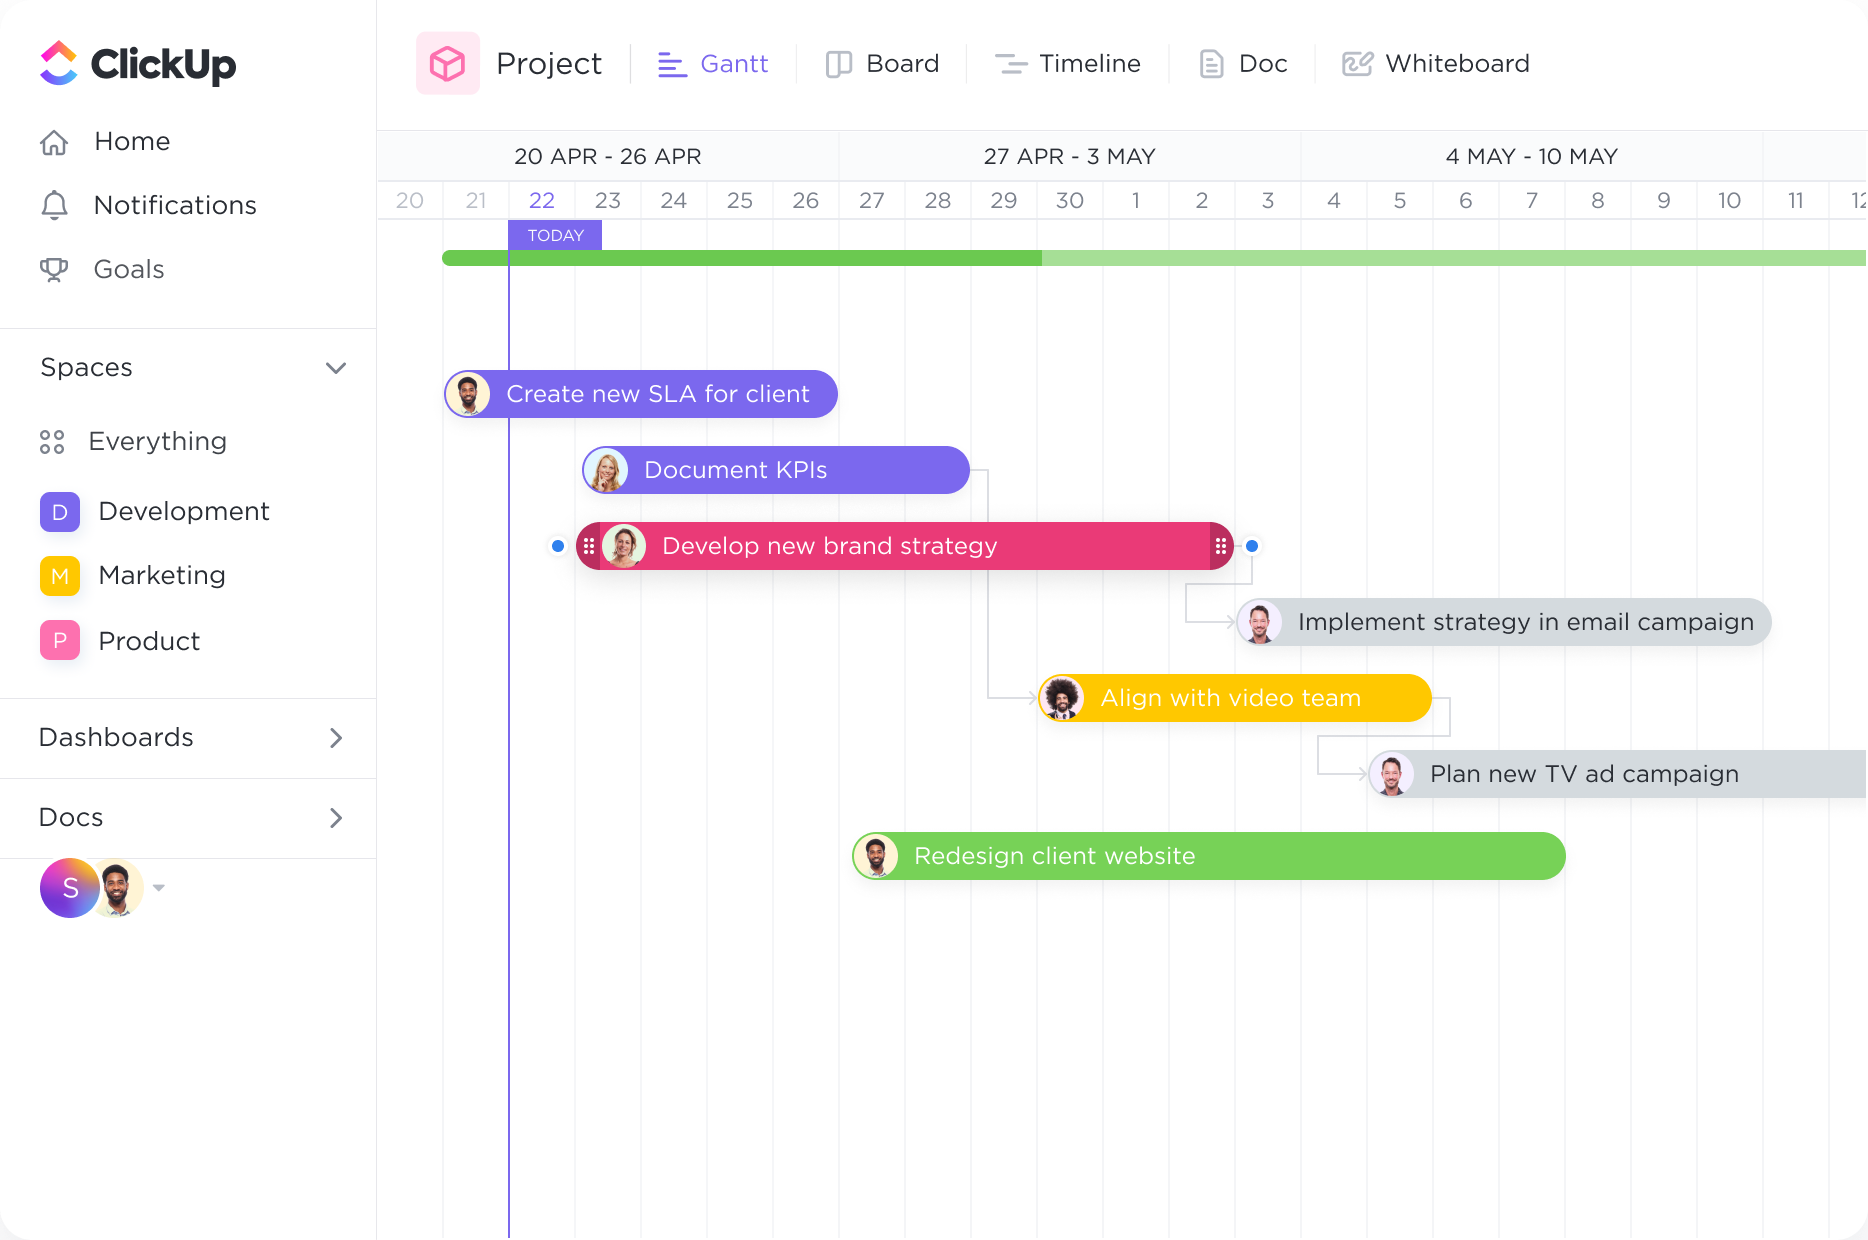
Tracking
Eliminate bottlenecks before they happen.
Intelligent dependency-path tracking shows you where potential bottlenecks might exist to prevent inefficiencies.
Gantt Charts
Streamline your project management process with ClickUp's powerful Gantt Chart software. Empower your Aerospace Engineers to create detailed project plans, track progress, and meet deadlines effortlessly. With ClickUp's intuitive interface and customizable features, your team can collaborate seamlessly and stay on top of every task. Maximize productivity and deliver projects on time with ClickUp's Gantt Chart software.
Free forever. No credit card.

Tracking
Intelligent dependency-path tracking shows you where potential bottlenecks might exist to prevent inefficiencies.
Visualize
Organize how you see your tasks with quick sorting. Create cascading views with a single click to easily see what important tasks are coming next.
Aerospace engineering projects often involve complex timelines and multiple tasks that need to be completed in a specific order. Using a Gantt chart allows aerospace engineers to visualize the entire project timeline, including deadlines and milestones. This helps in planning and organizing the project, ensuring that tasks are completed on time and the project stays on track.
Aerospace engineering projects require collaboration among different teams and individuals. With a Gantt chart, tasks can be allocated to team members, clearly defining their roles and responsibilities. This promotes efficient collaboration, ensures that everyone is aware of their tasks, and allows for better coordination among team members.
Aerospace engineering projects often involve the allocation and management of various resources, such as personnel, equipment, and materials. Gantt charts can be used to schedule and optimize the use of these resources. By visualizing resource availability and allocation, aerospace engineers can ensure that resources are utilized efficiently, preventing bottlenecks and delays in the project.
Gantt charts provide a visual representation of the project's progress, allowing aerospace engineers to track the completion of tasks and milestones. This helps in monitoring the project's overall progress and identifying any potential delays or issues. By having a clear overview of the project status, engineers can take proactive measures to address any challenges and keep the project on schedule.
A Gantt chart can help aerospace engineers visualize and track the various tasks and their interdependencies, ensuring that all necessary steps are completed in the correct sequence.
By using a Gantt chart, aerospace engineers can easily identify periods of high workload or resource constraints, allowing for better allocation and balancing of resources across different projects and tasks.
A Gantt chart can provide a clear overview of project milestones and deadlines, helping aerospace engineers stay on track and ensuring that critical milestones are met.
With a Gantt chart, aerospace engineers can easily identify the critical path of a project and understand the impact of delays or changes in dependent tasks, enabling them to prioritize and allocate resources accordingly.
A Gantt chart can serve as a visual tool for effective communication and collaboration with cross-functional teams, allowing engineers to share project progress, dependencies, and timelines with stakeholders from different departments or disciplines.
By visualizing the project timeline and dependencies in a Gantt chart, aerospace engineers can proactively identify potential risks and bottlenecks, enabling them to develop contingency plans and mitigate any potential delays or issues.
Gantt chart software can help you effectively manage complex aerospace engineering projects by visually representing the project timeline, tasks, and dependencies. It allows for resource allocation, tracking of progress, and identification of potential scheduling conflicts. This enables better coordination, efficient project management, and informed decision-making throughout the project lifecycle.
Gantt chart software offers aerospace engineers the ability to track and manage project timelines, dependencies, and milestones. It supports resource allocation and scheduling, allowing engineers to optimize project workflows and ensure timely completion. Additionally, Gantt charts enable easy identification of potential bottlenecks and conflicts, facilitating proactive adjustments and risk mitigation. This enhances collaboration and communication among team members, leading to more efficient project management in the aerospace industry.
Yes, there are several best practices for using Gantt chart software in aerospace engineering. These include breaking down complex tasks into smaller subtasks, establishing dependencies and deadlines, regularly updating and reviewing the chart, assigning responsibilities to team members, and using color coding or annotations to highlight critical milestones. By following these practices, you can effectively track and monitor the progress of aerospace engineering tasks and milestones, ensuring efficient project management and timely completion.