Mastering the AI Organizational Chart Generator
Understanding AI-Powered Organizational Chart Generators
An AI Organizational Chart Generator revolutionizes how companies visualize their internal frameworks—automating the design and continuous updates of org charts. Traditionally, creating these visuals involved tedious manual work in tools like PowerPoint or Visio, frequent coordination with HR, and reliance on static PDFs that quickly became outdated.
AI reshapes this by using natural language commands and real-time data to instantly render team structures, reporting relationships, and roles. For example, instructing the system with “Generate an org chart for marketing and sales teams including reporting lines” results in an immediate, accurate diagram.
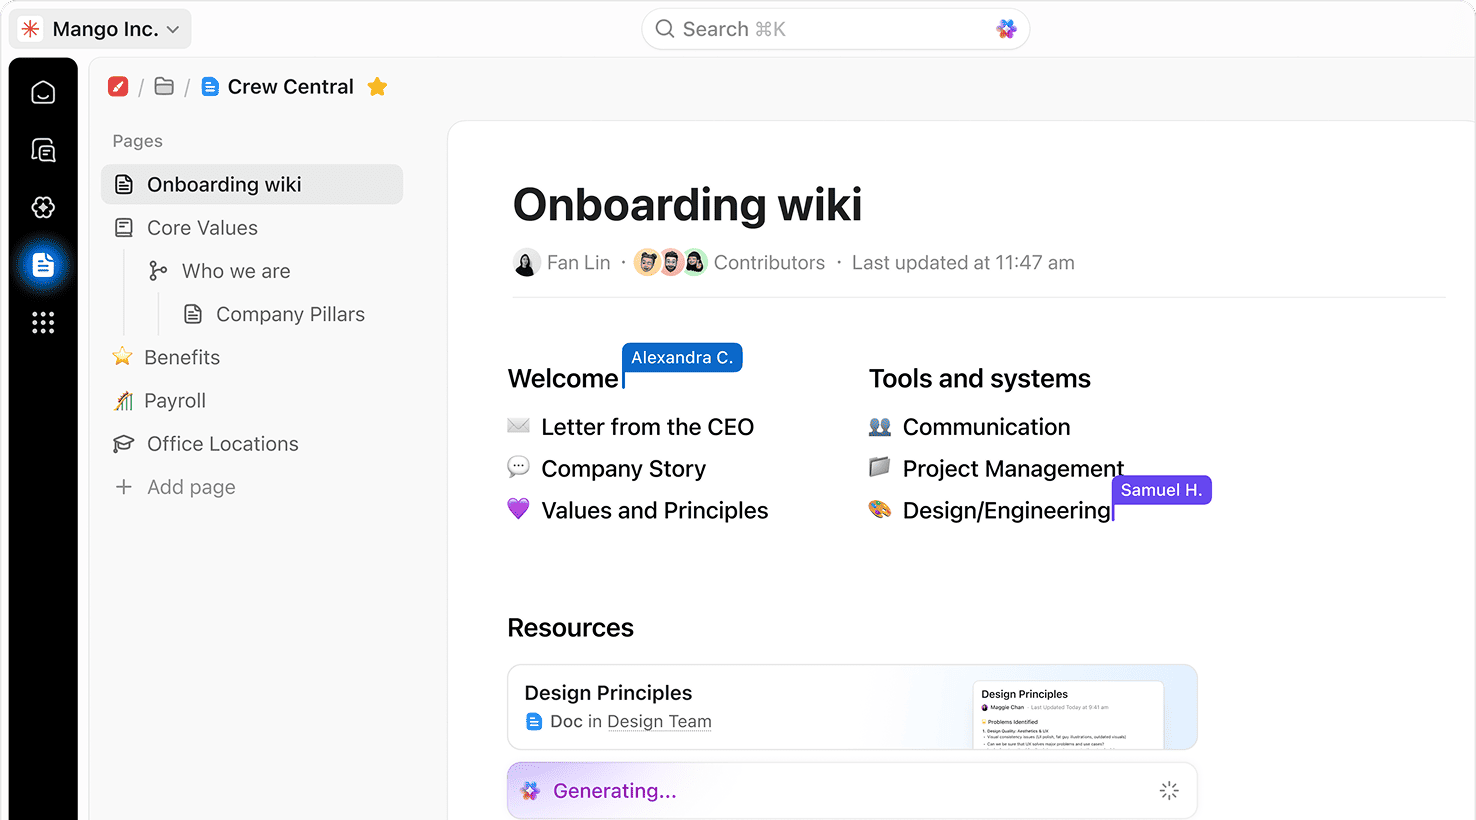
When integrated with platforms like ClickUp Brain, org charts evolve into interactive, living documents that continuously sync with your workspace’s updates.
Why ClickUp Brain Stands Apart
Conventional AI Tools
- Isolated operation: Generates org charts separately, often requiring manual transfers to other platforms.
- Static visuals: Produces charts as images or PDFs with limited real-time collaboration.
- Manual upkeep: Each organizational change demands chart rewrites or recreations.
- Security gaps: Charts may reside in unsecured environments or need special sharing protocols.
- Simplistic logic: Unable to integrate multiple data sources or adapt structurally over time.
ClickUp Brain
- Integrated in your workflow: Build org charts directly linked to tasks, documents, and projects.
- Real-time collaboration: Co-create and update org charts with your team simultaneously.
- Automatic updates: Charts adjust instantly as teams evolve or roles shift.
- Robust access control: Permissions align with ClickUp Docs for secure sharing.
- ClickUp Brain Max: Customize org structures using advanced logic by merging diverse data inputs.
Crafting Your AI-Driven Organizational Chart
1. Aggregate Data Directly from Your Workflow
Traditional approach: Gathering employee names, titles, and departments from scattered sources before starting the chart.
With ClickUp Brain:
Automatically pulls data from tasks, lists, folders, and Docs, assembling a draft org chart reflecting your current workspace. Simply prompt: “Show me the org chart for the APAC sales team.”
2. Employ AI to Define Reporting Relationships
Traditional approach: Relying solely on official titles without understanding actual collaboration.
With ClickUp Brain:
Analyzes task dependencies, comments, goals, and ownership to map real reporting lines based on teamwork dynamics, not just hierarchy.
3. Design Charts Matching Your Organizational Style
Traditional approach: Fixed top-down hierarchies that don’t reflect modern team structures.
With ClickUp Brain:
Use Whiteboards or Mind Maps for visual customization. AI suggests logical clusters, like grouping roles into delivery pods or squads, enhancing clarity and relevance.
4. Maintain Live, Auto-Updating Org Charts
Traditional approach: Charts become outdated with every change, requiring manual revisions.
With ClickUp Brain:
Org charts refresh automatically as your team grows or roles shift, ensuring your visualization always mirrors reality without extra effort.
Three Game-Changing Use Cases for AI Organizational Chart Generators
Scaling Startups with Precision and Speed
Founders and operations leaders use AI org charts to capture current team layouts, forecast future roles, and align recruitment with growth strategies.
It acts as a dynamic blueprint of your evolving talent architecture—vital for both internal alignment and investor presentations.
Strategic Organizational Change Management
Executives prototype mergers and reorganizations by visualizing potential team structures, verifying reporting accuracy, and identifying friction points early.
This proactive planning minimizes surprises and smooths transformational rollouts.
Effortless Restructuring Without the Spreadsheet Hassle
HR and department heads model new team configurations, simulate adjustments, and deploy updates instantly.
What once took days navigating slides and spreadsheets now happens seamlessly with version control and collaboration intact.
