Unlock the Power of AI Gantt Chart Generator
Understanding AI Gantt Chart Generators
An AI Gantt Chart Generator automates the creation and adjustment of Gantt charts—those essential visual timelines that keep projects on track. Traditionally, crafting these charts meant manual entry, constant updates, and juggling multiple tools like spreadsheets or standalone software.
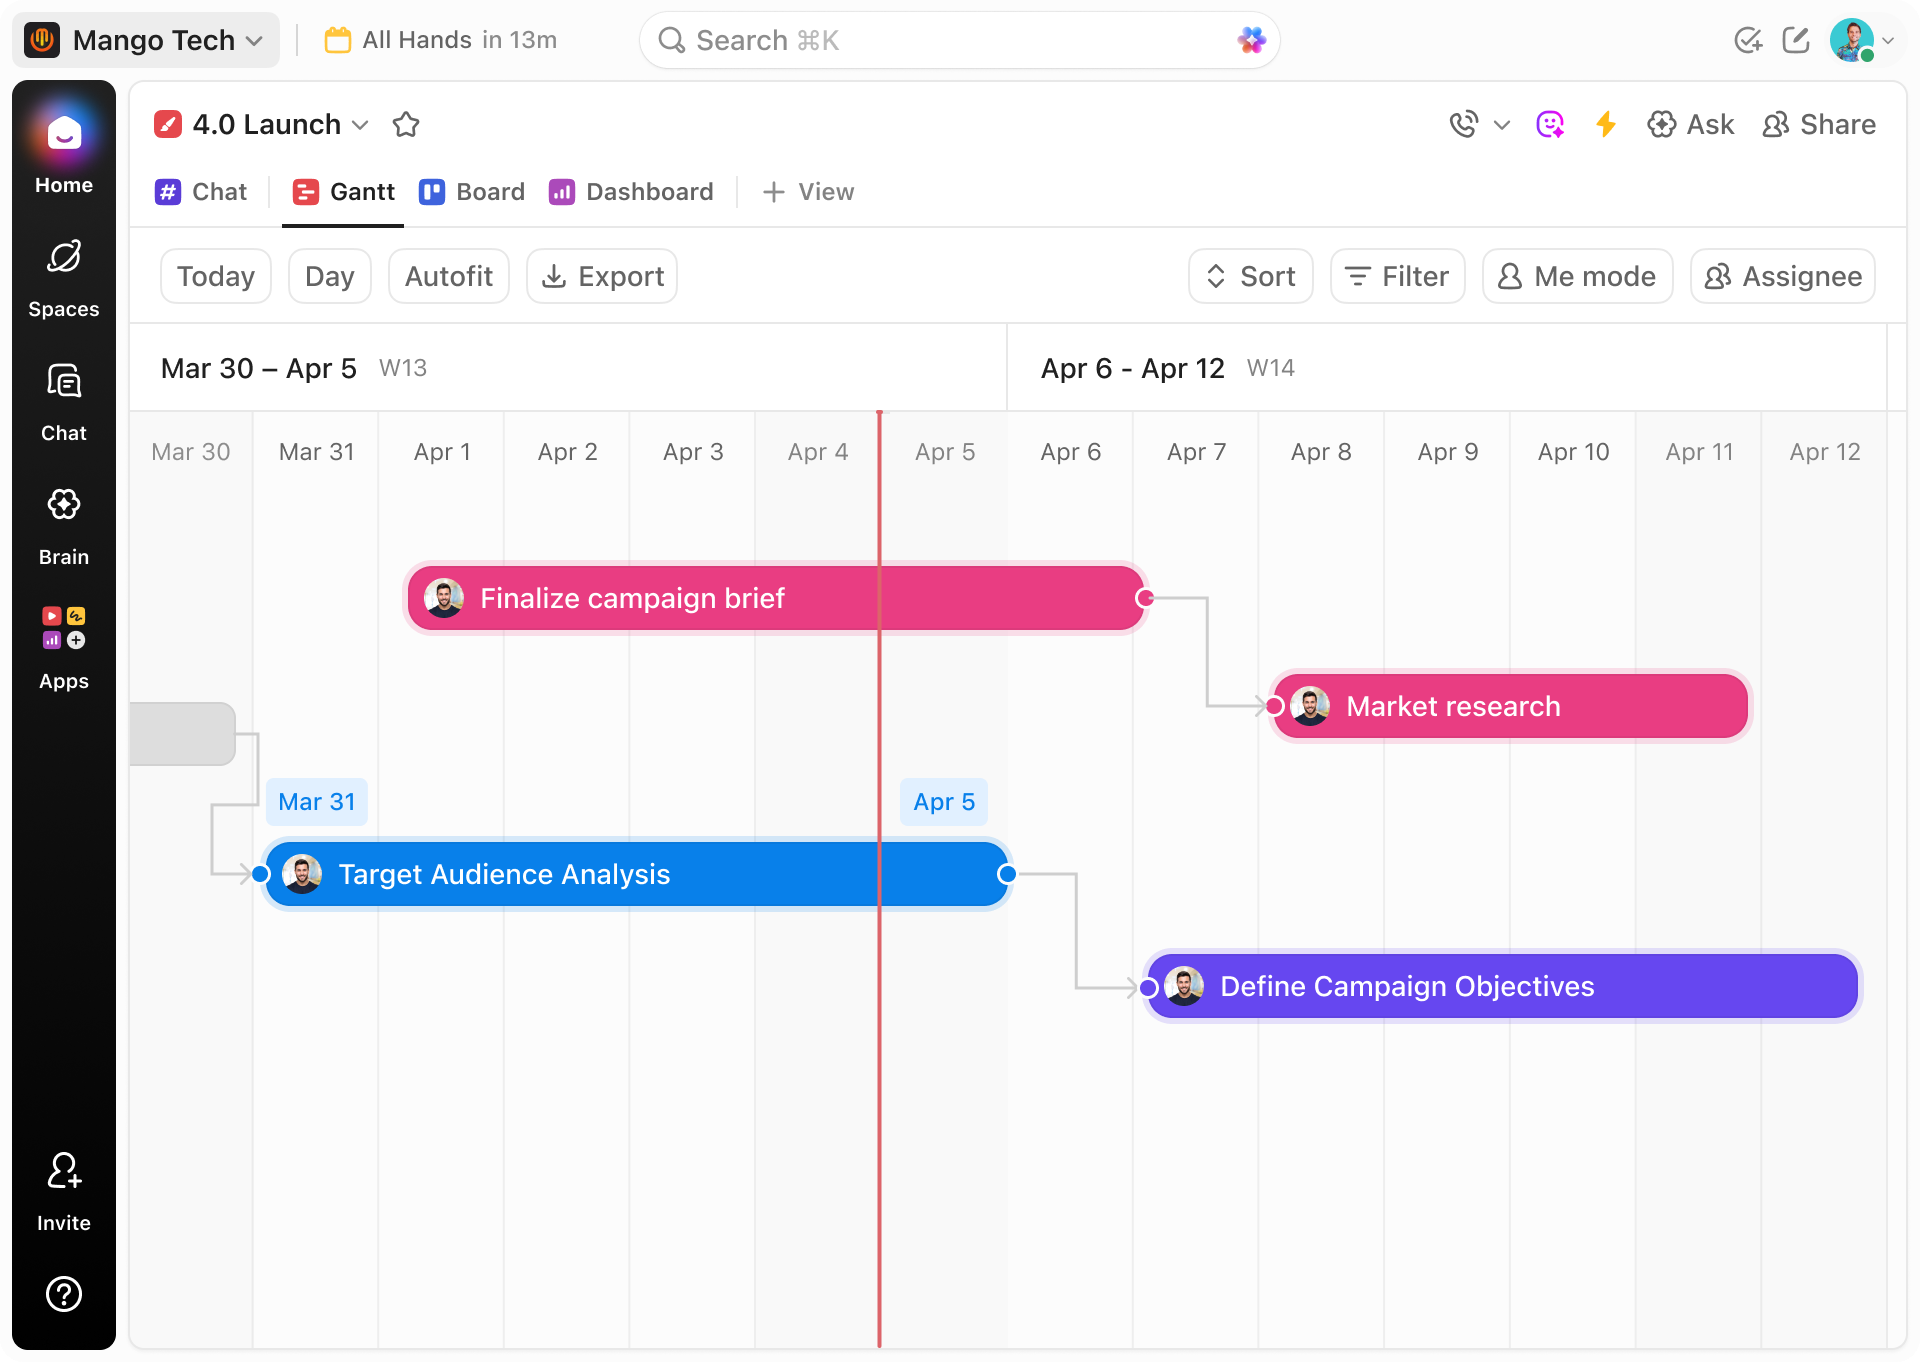
AI shifts this by interpreting project data and dependencies through natural language or integrated sources, instantly producing clear, actionable timelines. With ClickUp Brain, your Gantt charts become dynamic, reflecting real-time project changes and team workflows within your workspace.
Elevate Project Scheduling with ClickUp Brain
Conventional Gantt Tools
- Isolated software: Requires exporting and importing data across platforms.
- Static visuals: Charts often become outdated snapshots, lacking collaboration.
- Manual updates: Every timeline or dependency change demands hands-on edits.
- Limited integration: Poor connectivity with task or resource data.
- Basic dependency logic: Unable to adapt to complex project nuances dynamically.
ClickUp Brain Advantage
- Embedded in your workflow: Generates Gantt charts directly from your ClickUp tasks and projects.
- Live syncing: Charts update automatically as your project evolves.
- Intelligent dependency detection: Reads task relations, deadlines, and priorities.
- Collaborative editing: Team members can adjust timelines together in real-time.
- Brain Max customization: Tailor chart logic to unique project requirements.
How to Generate an AI Gantt Chart with ClickUp
1. Gather Project Data Seamlessly
Traditional challenge: Manually compiling tasks, dates, and dependencies from multiple sources.
With ClickUp Brain:
The AI scans your ClickUp workspace, extracting task details, due dates, and relationships to draft your project timeline instantly. Just prompt: “Create the Gantt chart for Q3 Marketing Campaign.”
2. AI Maps Task Dependencies Intelligently
Traditional challenge: Manually linking tasks to reflect true project flow.
With ClickUp Brain:
It analyzes task dependencies, priorities, and resource allocations to generate an accurate, interconnected timeline that mirrors your actual workflow.
3. Customize Visual Timeline Styles
Traditional challenge: Limited flexibility in chart layouts and styles.
With ClickUp Brain:
Adjust your chart using ClickUp’s Whiteboards or Mind Maps, or let Brain suggest grouping based on project phases or teams—making your Gantt chart as unique as your project.
4. Keep Your Gantt Chart Live and Dynamic
Traditional challenge: Static charts quickly become outdated with shifting deadlines.
With ClickUp Brain:
Your Gantt chart updates automatically as tasks progress, dates shift, or new dependencies emerge, ensuring your timeline always reflects reality.
3 Transformative Ways to Use AI Gantt Chart Generator
Accelerate Product Launch Planning
Product managers use AI Gantt charts to visualize dependencies, align cross-functional teams, and forecast release timelines.
This dynamic timeline helps identify bottlenecks early and adapt plans on the fly, keeping launches on schedule and stakeholders informed.
Optimize Construction Project Scheduling
Construction planners leverage AI-generated Gantt charts to coordinate subcontractors, manage material deliveries, and track permit approvals.
Real-time updates minimize delays and cost overruns, ensuring complex builds progress smoothly.
Simplify Marketing Campaign Coordination
Marketing teams rely on AI timelines to orchestrate content creation, media buys, and event deadlines.
The adaptive chart ensures all moving parts stay aligned, boosting campaign effectiveness and on-time delivery.
