Top AI Prompts for Graphs, Charts & Dashboards

Harness AI Prompts to Elevate Data Visualization Workflows
Crafting insightful dashboards and compelling charts goes beyond just numbers—it demands clarity and precision behind the scenes.
From gathering raw data to designing interactive visuals and monitoring KPIs, data visualization teams juggle numerous elements alongside tight timelines. AI prompts are now pivotal in simplifying these complex processes.
Teams rely on AI to:
- Quickly identify key data patterns and trends
- Generate draft charts, graphs, and dashboard layouts with ease
- Interpret and summarize dense datasets and reports
- Transform scattered notes into clear action plans and visualization tasks
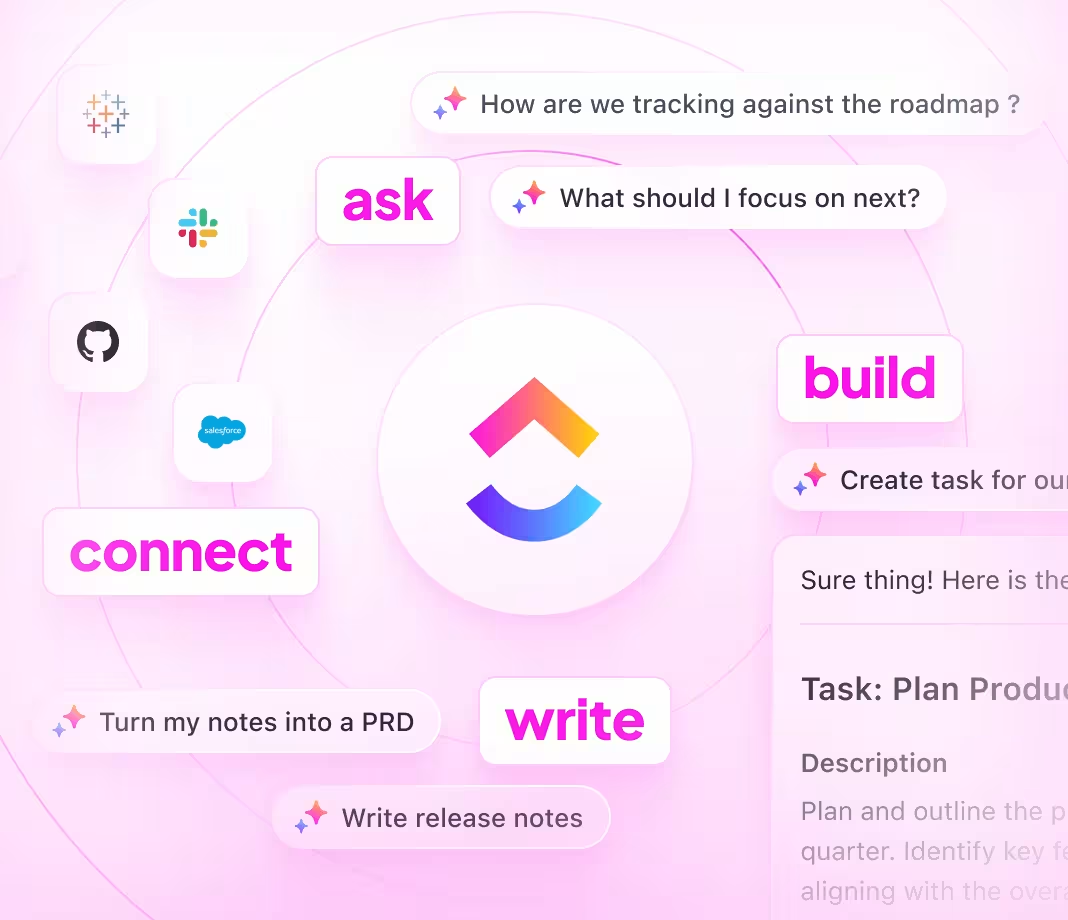
Integrated within familiar tools like documents, whiteboards, and project trackers, AI in ClickUp Brain doesn’t just assist—it seamlessly converts your data insights into structured, impactful visual projects.
Discover Why ClickUp Brain Stands Out
Conventional AI Platforms
- Constantly toggling between apps to collect information
- Repeating your objectives with every query
- Responses that miss your specific needs
- Digging through numerous apps to locate a single document
- Interacting with AI that only responds passively
- Manually switching between different AI engines
- Merely an added browser plugin
ClickUp Brain
- Instantly understands your projects, notes, and team progress
- Keeps track of your past activities and targets
- Provides detailed, context-driven guidance
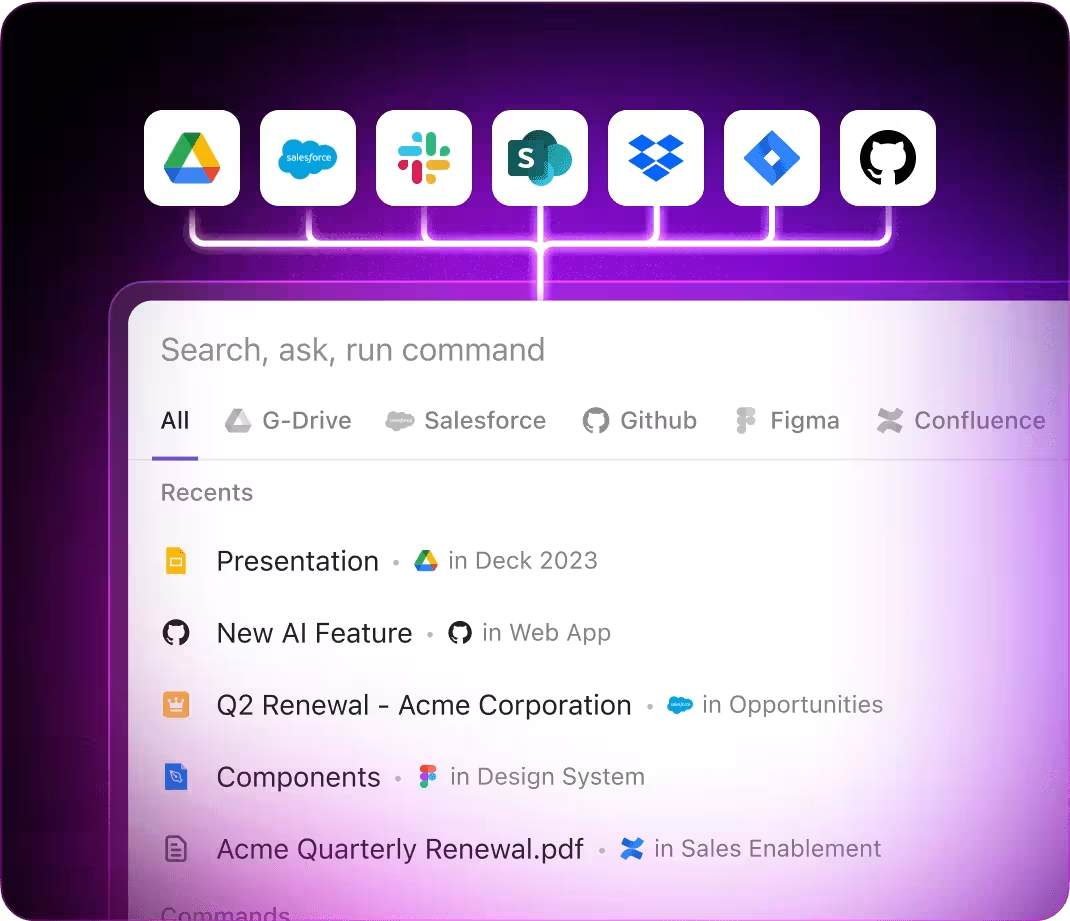
- Offers a consolidated search across all your resources
- Supports voice commands with Talk to Text
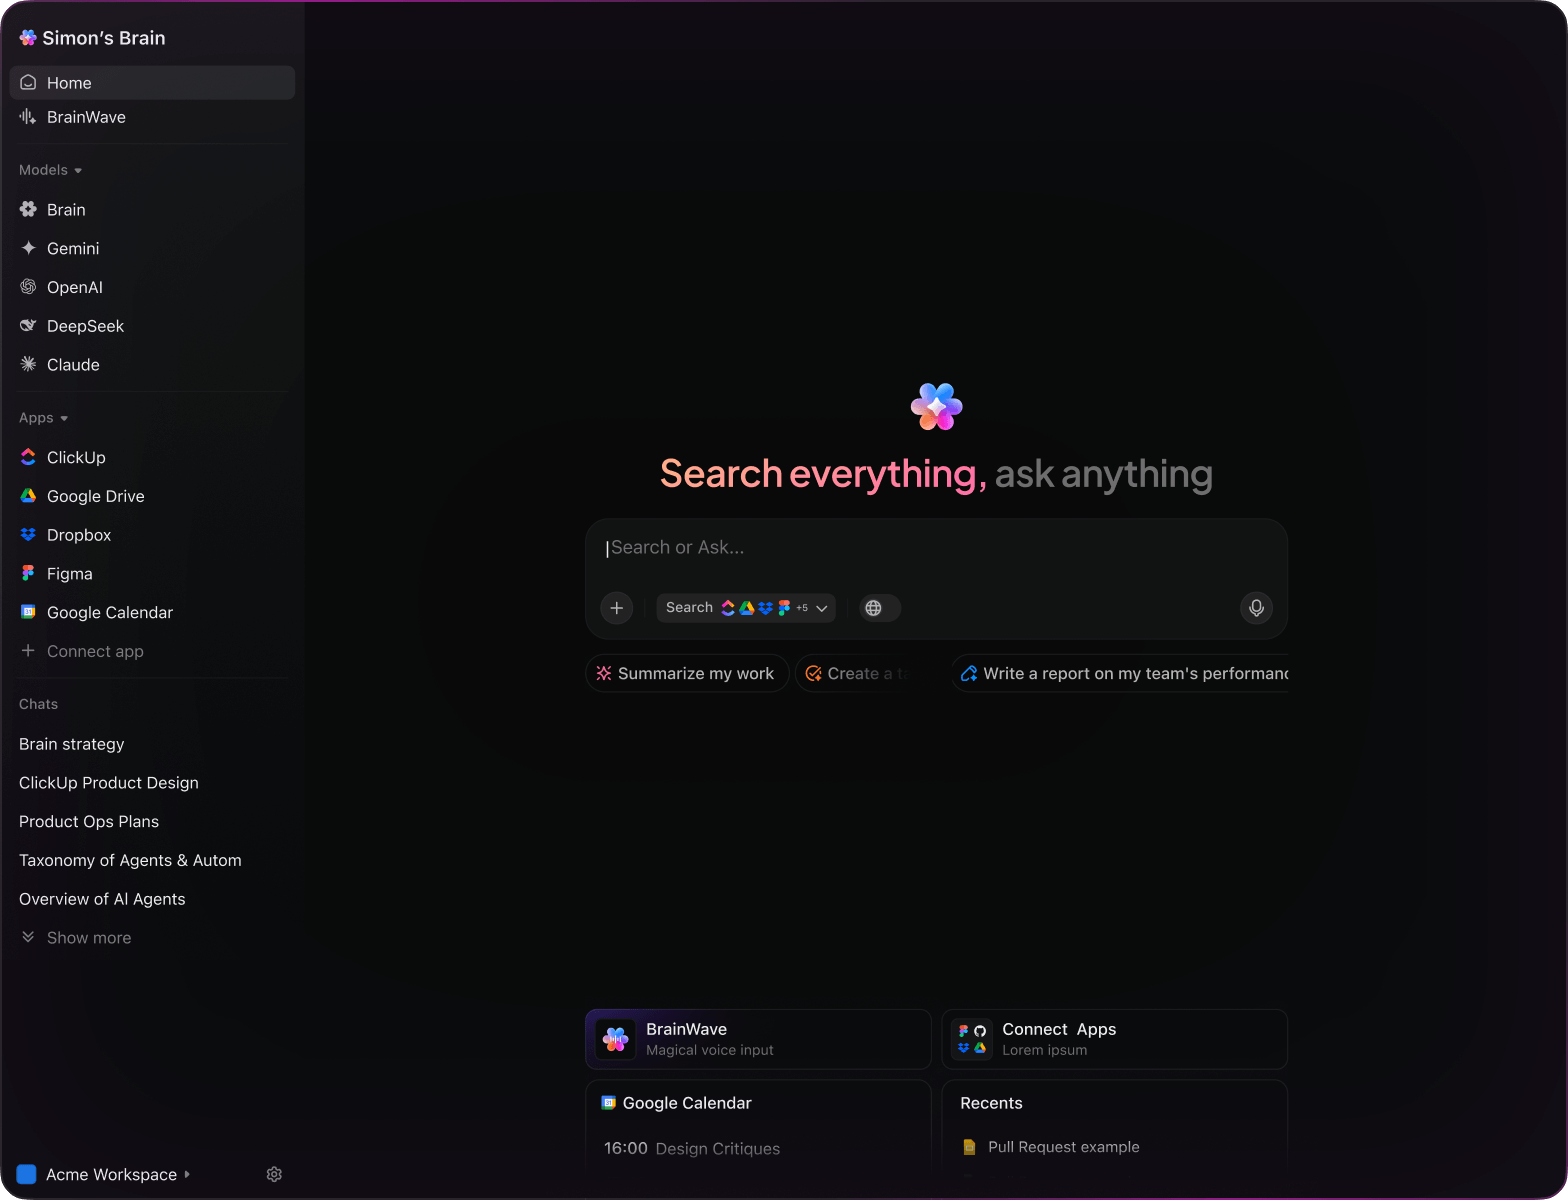
- Automatically selects the optimal AI model: GPT, Claude, Gemini
- Dedicated Mac & Windows apps designed for efficiency
15 Essential AI Prompts for Visualizing Data with ClickUp Brain
Identify 5 effective graph types to display Q1 2024 sales trends, referencing the ‘Sales Data Overview’ doc.
ClickUp Brain Behavior: Analyzes document content to recommend visualization formats suited for sales data storytelling.
Discover popular dashboard arrangements that emphasize marketing KPIs under $10K budget constraints.
ClickUp Brain Behavior: Combines insights from internal reports and public examples to suggest practical dashboard designs.
Create a detailed brief for designing a heatmap chart illustrating customer satisfaction, using notes from ‘CX Insights’ and previous project files.
ClickUp Brain Behavior: Extracts relevant data points and formatting preferences to build a structured visualization plan.
Summarize how bar charts are applied differently in product performance and sales reports, based on ‘Report Analysis Q3’ doc.
ClickUp Brain Behavior: Reviews textual and tabular data to highlight contrasting visualization approaches.
Identify preferred color schemes for financial dashboards, referencing design guidelines and user feedback documents.
ClickUp Brain Behavior: Scans internal resources to compile popular palette choices and their effectiveness notes.
From the ‘Accessibility Compliance’ doc, produce a checklist ensuring dashboards meet required standards.
ClickUp Brain Behavior: Extracts criteria and formats them into an actionable task list for designers and developers.
Highlight three key trends in interactive chart features from recent UX studies and technology reviews.
ClickUp Brain Behavior: Identifies recurring themes and innovations from linked research and documentation.
From the ‘Mobile UX Survey’ doc, summarize main user preferences regarding dashboard layouts on mobile devices.
ClickUp Brain Behavior: Analyzes survey data to extract common design requests and pain points.
Write concise, user-friendly tooltip descriptions for sales funnel visualizations, guided by the ‘Brand Voice’ doc.
ClickUp Brain Behavior: Applies tone guidelines to generate clear and approachable interface copy.
Outline recent data privacy regulations and their implications for dashboard data handling, referencing compliance docs.
ClickUp Brain Behavior: Synthesizes legal documents to highlight key changes and necessary adjustments.
Using workspace compliance docs, create placement and sizing rules for KPI widgets on executive dashboards.
ClickUp Brain Behavior: Extracts spatial and design standards to form a practical guideline checklist.
Develop a checklist for evaluating dashboard loading times and responsiveness, referencing performance reports.
ClickUp Brain Behavior: Identifies critical test points and organizes them into a structured task list.
Summarize differences in charting tools and techniques among leading analytics teams, based on competitive analysis docs.
ClickUp Brain Behavior: Compiles comparative data into an easy-to-digest summary or table format.
Identify popular chart formats emerging since 2023 for real-time data dashboards, using internal trend reports.
ClickUp Brain Behavior: Aggregates and synthesizes trend data from research and concept documents.
Summarize common user-reported problems with dashboard navigation and readability from feedback folders.
ClickUp Brain Behavior: Extracts and prioritizes issues from surveys, support tickets, and user notes.
AI Prompts for Visualizing Data with Graphs, Charts & Dashboards
Prompts for ChatGPT
Prompts for Gemini
Prompts for Perplexity
Prompts for ClickUp Brain
Transform Raw Data Into Clear Visuals
- Convert scattered data points into polished charts quickly.
- Discover trends by analyzing historical project metrics.
- Build customizable dashboard templates for consistent reporting.
Brain Max Boost: Effortlessly explore previous reports, feedback, and datasets to fuel your next visualization.

Accelerate Data Visualization Workflows
- Break down intricate data insights into straightforward, actionable visuals.
- Transform raw data points into interactive charts ready for team review.
- Automatically produce dashboard summaries and update reports without lifting a finger.
Brain Max Boost: Instantly access historical visualization templates, dataset comparisons, or dashboard configurations across your projects.

Harness AI Prompts to Elevate Data Visualization
Create Insightful Visuals Quickly
Data teams explore diverse chart types rapidly, enabling sharper analysis and avoiding visualization bottlenecks.
Enhance Data-Driven Decisions
Make informed choices confidently by transforming raw data into clear, actionable visuals that resonate with stakeholders.
Identify Data Issues Early
Spot inconsistencies and errors before they affect reports, improving accuracy and reducing revision cycles.
Align Teams with Unified Dashboards
Facilitates transparent communication, ensuring everyone interprets data consistently and acts in sync.
Innovate Your Reporting Approach
Inspire fresh perspectives with dynamic charts and dashboards that reveal hidden trends and opportunities.
Integrate AI Prompts Seamlessly in ClickUp
Transforms AI-generated insights into actionable tasks, keeping your data projects moving forward efficiently.

