Track your progress at every step.
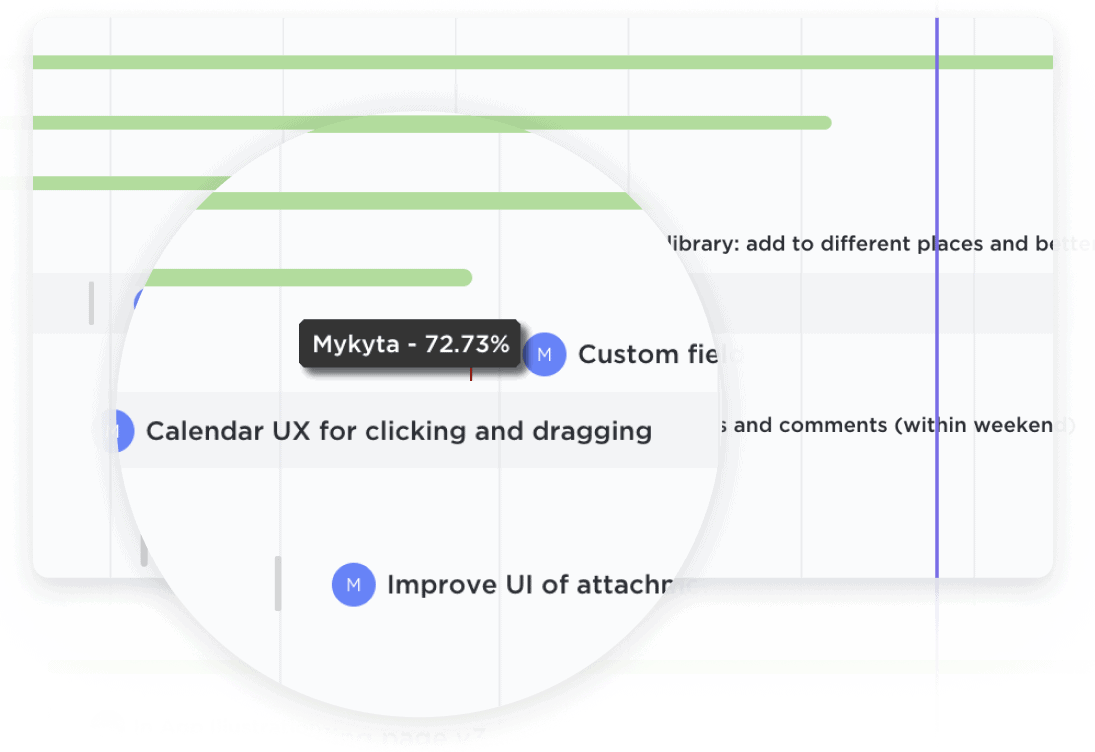
Easily update projects with a simple drag-and-drop action to collaborate amongst your team in real-time. Dynamic progress percentages provide a detailed snapshot.

Create Zoologist-specific Gantt Charts effortlessly with ClickUp. Streamline your project management and visualize timelines with our intuitive software. Plan, schedule, and track tasks with ease, allowing you to focus on what matters most - the research and conservation of wildlife. Embrace ClickUp's powerful features to optimize your workflow and stay organized in the fast-paced world of zoology.
Free forever.
No credit card.

Trusted by the world’s leading businesses
Easily update projects with a simple drag-and-drop action to collaborate amongst your team in real-time. Dynamic progress percentages provide a detailed snapshot.

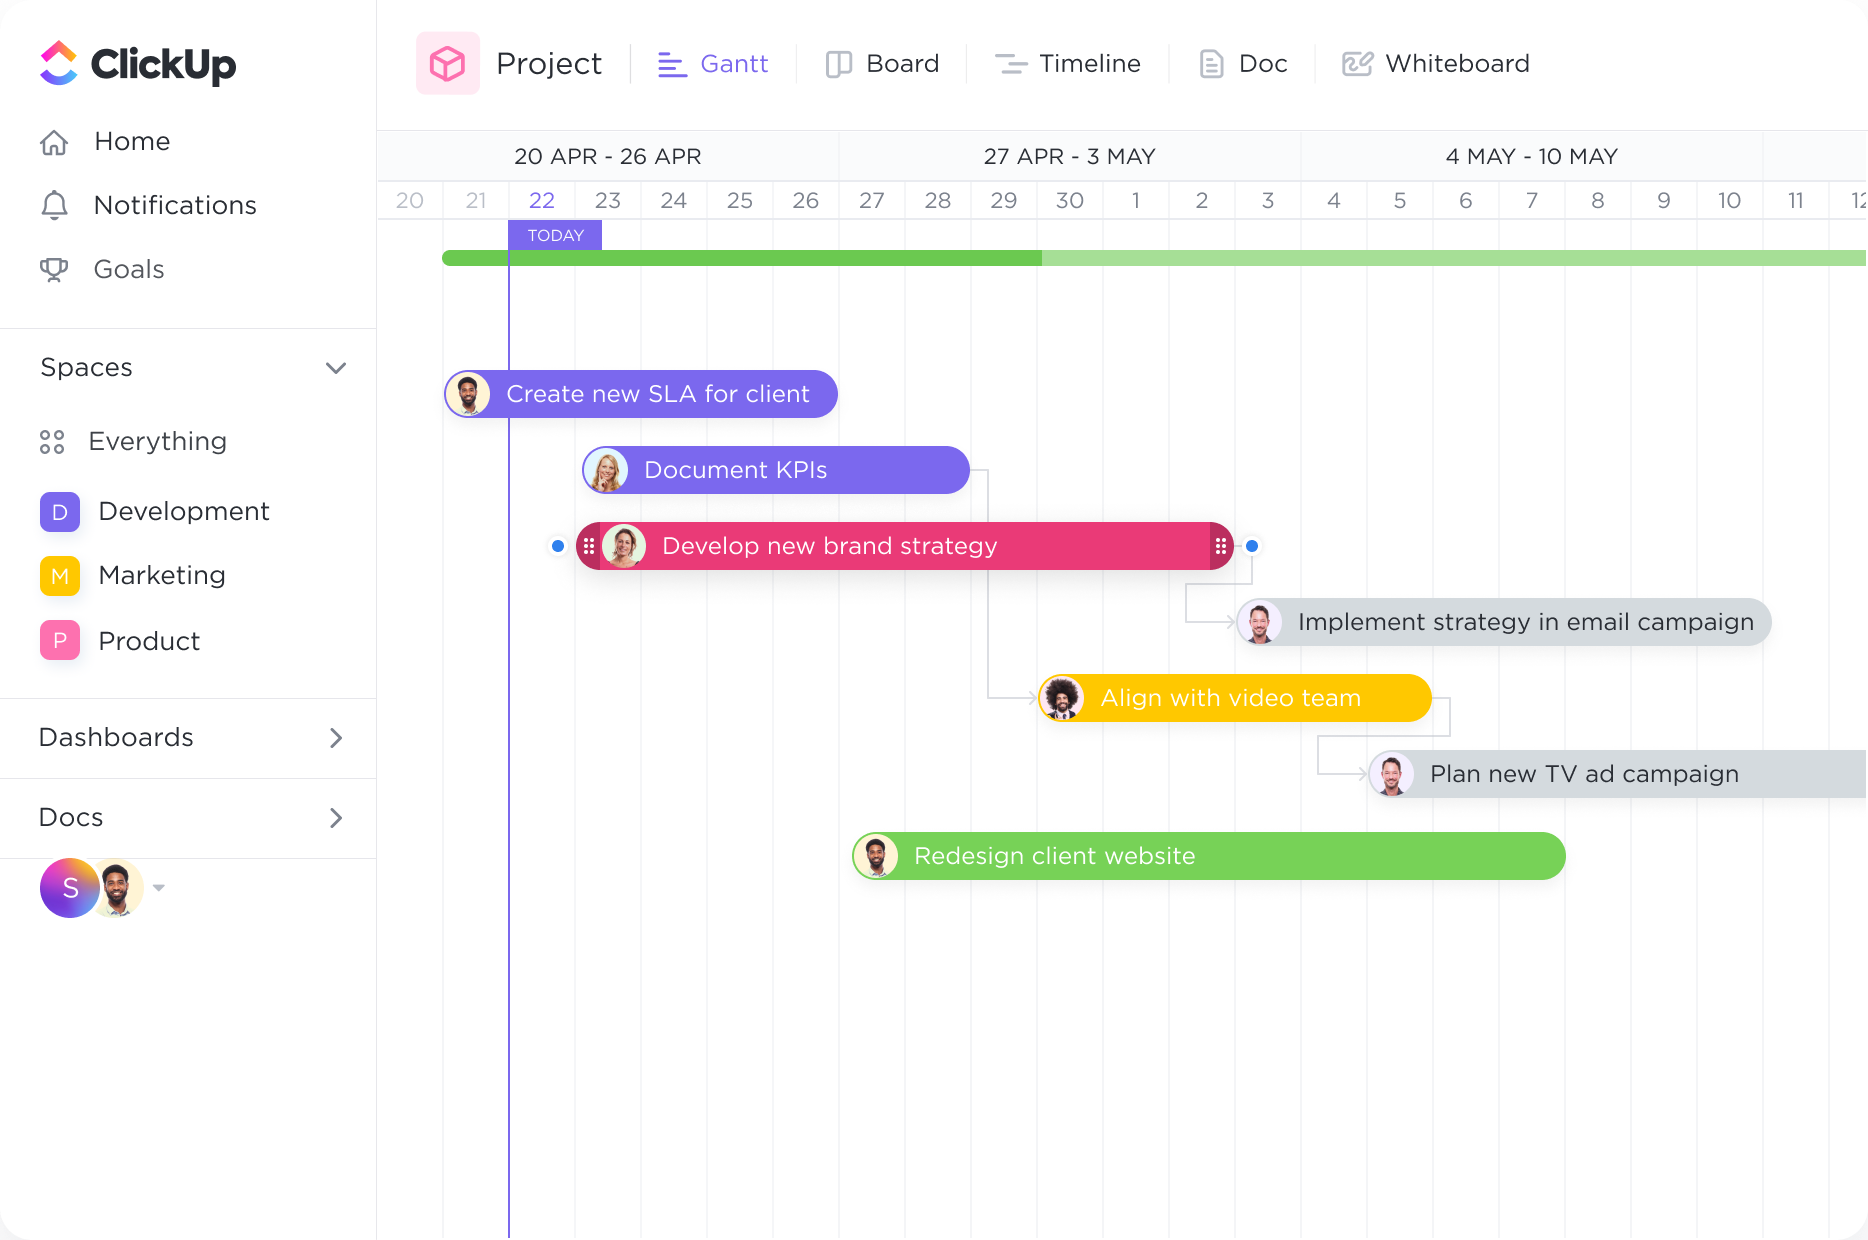
With the Gantt chart's dynamic timeline, you can easily schedule tasks, keep up with project progress, manage deadlines, and handle bottlenecks.
Zoologists often conduct research projects that involve studying animal behavior, population dynamics, and habitat conservation. A Gantt chart can be used to plan and schedule various stages of research, such as data collection, fieldwork, analysis, and report writing. This visual representation helps zoologists set realistic timelines, allocate resources efficiently, and track progress throughout the research process.
Collaboration is essential in zoology research, as it often involves working with a team of researchers, field assistants, and data analysts. A Gantt chart can be used to assign specific tasks to team members, ensuring clear roles and responsibilities. This promotes effective communication, coordination, and accountability among team members, leading to a more seamless and productive research experience.
Zoologists rely on various resources and equipment, such as GPS devices, camera traps, and laboratory facilities, to conduct their research. A Gantt chart can help in scheduling the use of these resources, avoiding conflicts and ensuring their availability when needed. It also allows zoologists to plan for any necessary maintenance or repairs, minimizing downtime and maximizing the efficiency of their research operations.
Fieldwork is a crucial aspect of zoology research, requiring careful planning and adherence to deadlines. By incorporating milestones and deadlines into a Gantt chart, zoologists can keep track of important fieldwork activities, such as data collection, specimen collection, and habitat surveys. This helps ensure that fieldwork is conducted within the planned timeframe, enabling researchers to stay on schedule and meet project objectives.
Field conditions in zoology research can be unpredictable, with factors like weather, animal behavior, and logistical challenges impacting the research timeline. A Gantt chart allows zoologists to monitor progress in real-time and make necessary adjustments to the research plan. This flexibility helps researchers adapt to unforeseen circumstances, optimize data collection opportunities, and maintain the overall integrity of the research project.
Gantt chart software can help zoologists in their research projects by providing a visual representation of project timelines, tasks, and dependencies. This allows for better planning and organization of research activities, ensuring that tasks are completed on time and in the right sequence. It also enables the allocation of resources and identification of potential bottlenecks, improving efficiency and productivity. Additionally, Gantt charts facilitate collaboration and communication among team members, enhancing coordination and overall project management.
Yes, Gantt chart software can help zoologists track and manage multiple fieldwork tasks and deadlines effectively. It provides a visual representation of the project timeline, allowing zoologists to allocate resources, identify potential scheduling conflicts, and track progress. This helps in coordinating fieldwork tasks, ensuring efficient time management, and enabling timely completion of projects.
Gantt chart software can help zoologists by providing a visual representation of their research activities' timeline and dependencies. It allows them to easily identify the duration of each task, the sequence in which tasks need to be completed, and any potential overlaps or delays. This enables zoologists to effectively plan and allocate resources, track progress, and ensure timely completion of their research activities.