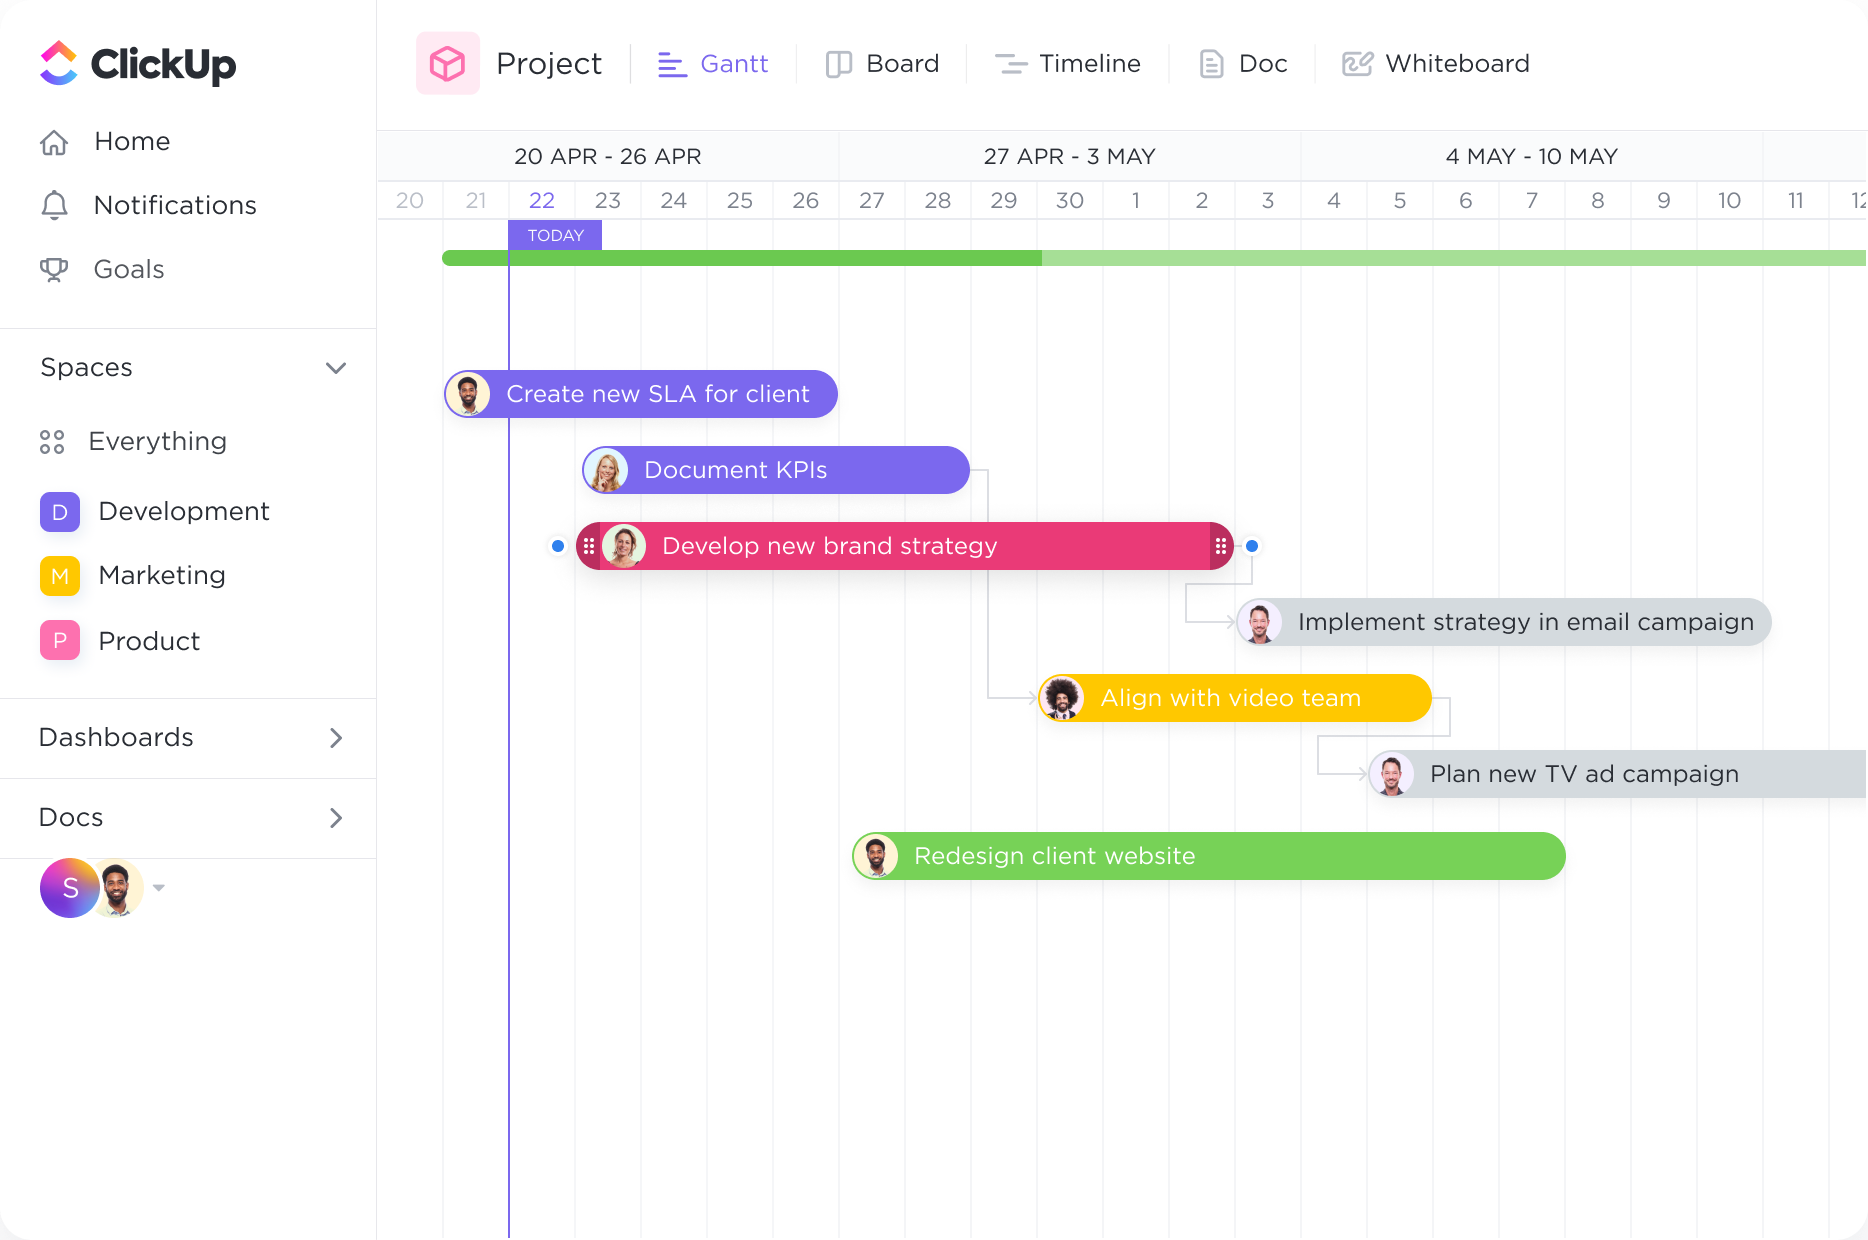
Set task dependencies.
Create tasks and link them with dependencies. Dragging a task with dependencies will automatically reschedule tasks in the chain
Streamline your project management process and boost productivity with ClickUp's powerful Gantt Chart software. Designed specifically for Utility Professionals, our user-friendly interface allows you to effortlessly create, track, and manage your projects with precision. Visualize timelines, allocate resources, and stay on top of deadlines like never before. With ClickUp's Gantt Chart software, you'll have all the tools you need to successfully plan and execute your projects, all in one place.
Free forever.
No credit card.

Trusted by the world’s leading businesses
Create tasks and link them with dependencies. Dragging a task with dependencies will automatically reschedule tasks in the chain
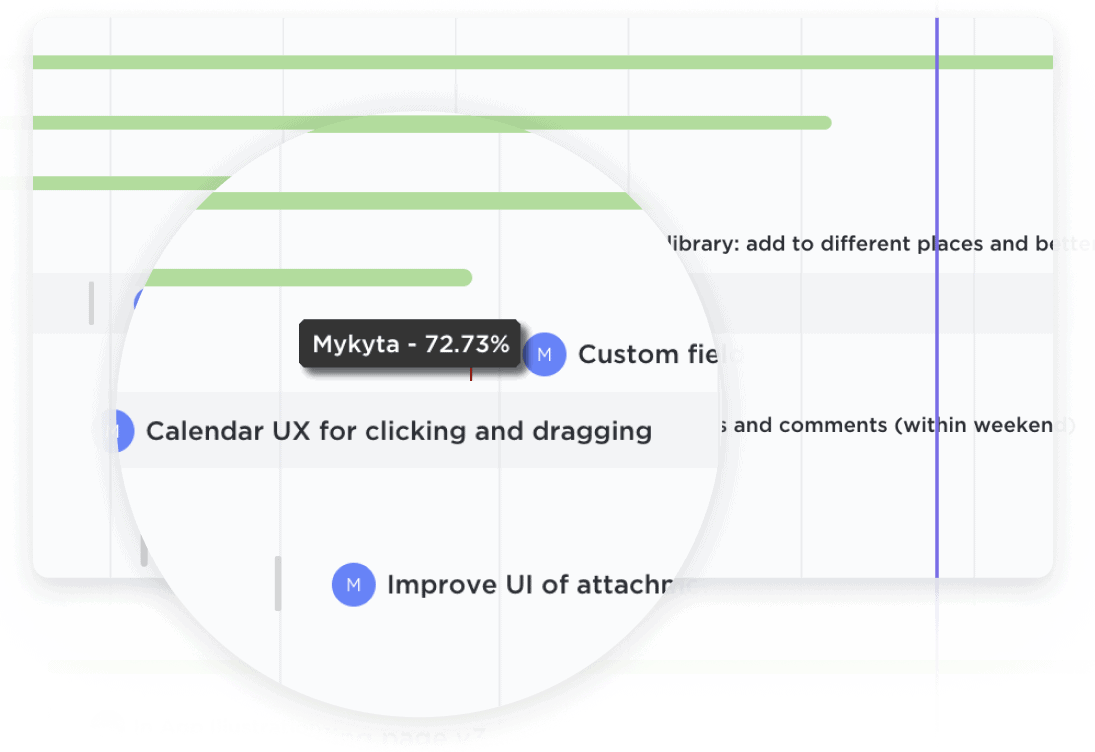
Easily update projects with a simple drag-and-drop action to collaborate amongst your team in real-time. Dynamic progress percentages provide a detailed snapshot.

Utility professionals often oversee complex projects involving the development and maintenance of infrastructure. Gantt charts provide a comprehensive overview of project timelines, deadlines, and milestones. This allows utility professionals to effectively plan and manage the various stages of a project, from initial design and construction to ongoing maintenance and upgrades.
Efficiently allocating and managing resources is crucial in the utility industry. Gantt charts enable utility professionals to visualize and optimize the use of personnel, equipment, and materials. By clearly outlining resource availability and scheduling, utility professionals can ensure that the right resources are allocated to the right tasks at the right time, minimizing downtime and maximizing productivity.
Utility professionals must adhere to strict compliance and regulatory requirements. Gantt charts can be used to outline the necessary steps and timelines for meeting these obligations. By incorporating compliance milestones and deadlines into the chart, utility professionals can ensure that all necessary tasks are completed on time, reducing the risk of penalties or legal issues.
In times of emergencies or natural disasters, utility professionals play a critical role in restoring services and ensuring public safety. Gantt charts can be used to plan and coordinate emergency response efforts, including assessing damages, mobilizing resources, and restoring services. By visualizing the tasks and timelines involved, utility professionals can respond quickly and efficiently, minimizing downtime and mitigating the impact on affected communities.
Gantt chart software can help manage utility projects by visually mapping out project timelines, dependencies, and tasks. It allows for efficient resource allocation, tracking of project progress, and identification of potential scheduling conflicts or delays. This enables effective coordination, communication, and decision-making, leading to improved project efficiency and successful completion of utility projects.
Gantt chart software for utility professionals offers features such as resource management, task prioritization, and scheduling capabilities. It allows for the visual representation of project timelines, dependencies, and critical paths. Additionally, it provides tools for tracking project progress, managing resources, and identifying potential bottlenecks. This enables utility professionals to effectively plan, coordinate, and execute projects, ensuring efficient resource allocation and on-time project completion.
Yes, there are several case studies and success stories of utility professionals using Gantt chart software to improve project management processes. Many utility companies have reported significant improvements in project planning, resource allocation, and overall efficiency by implementing Gantt charts. These tools have helped them streamline project workflows, track progress, and identify potential bottlenecks, ultimately leading to successful project completion and enhanced customer satisfaction.