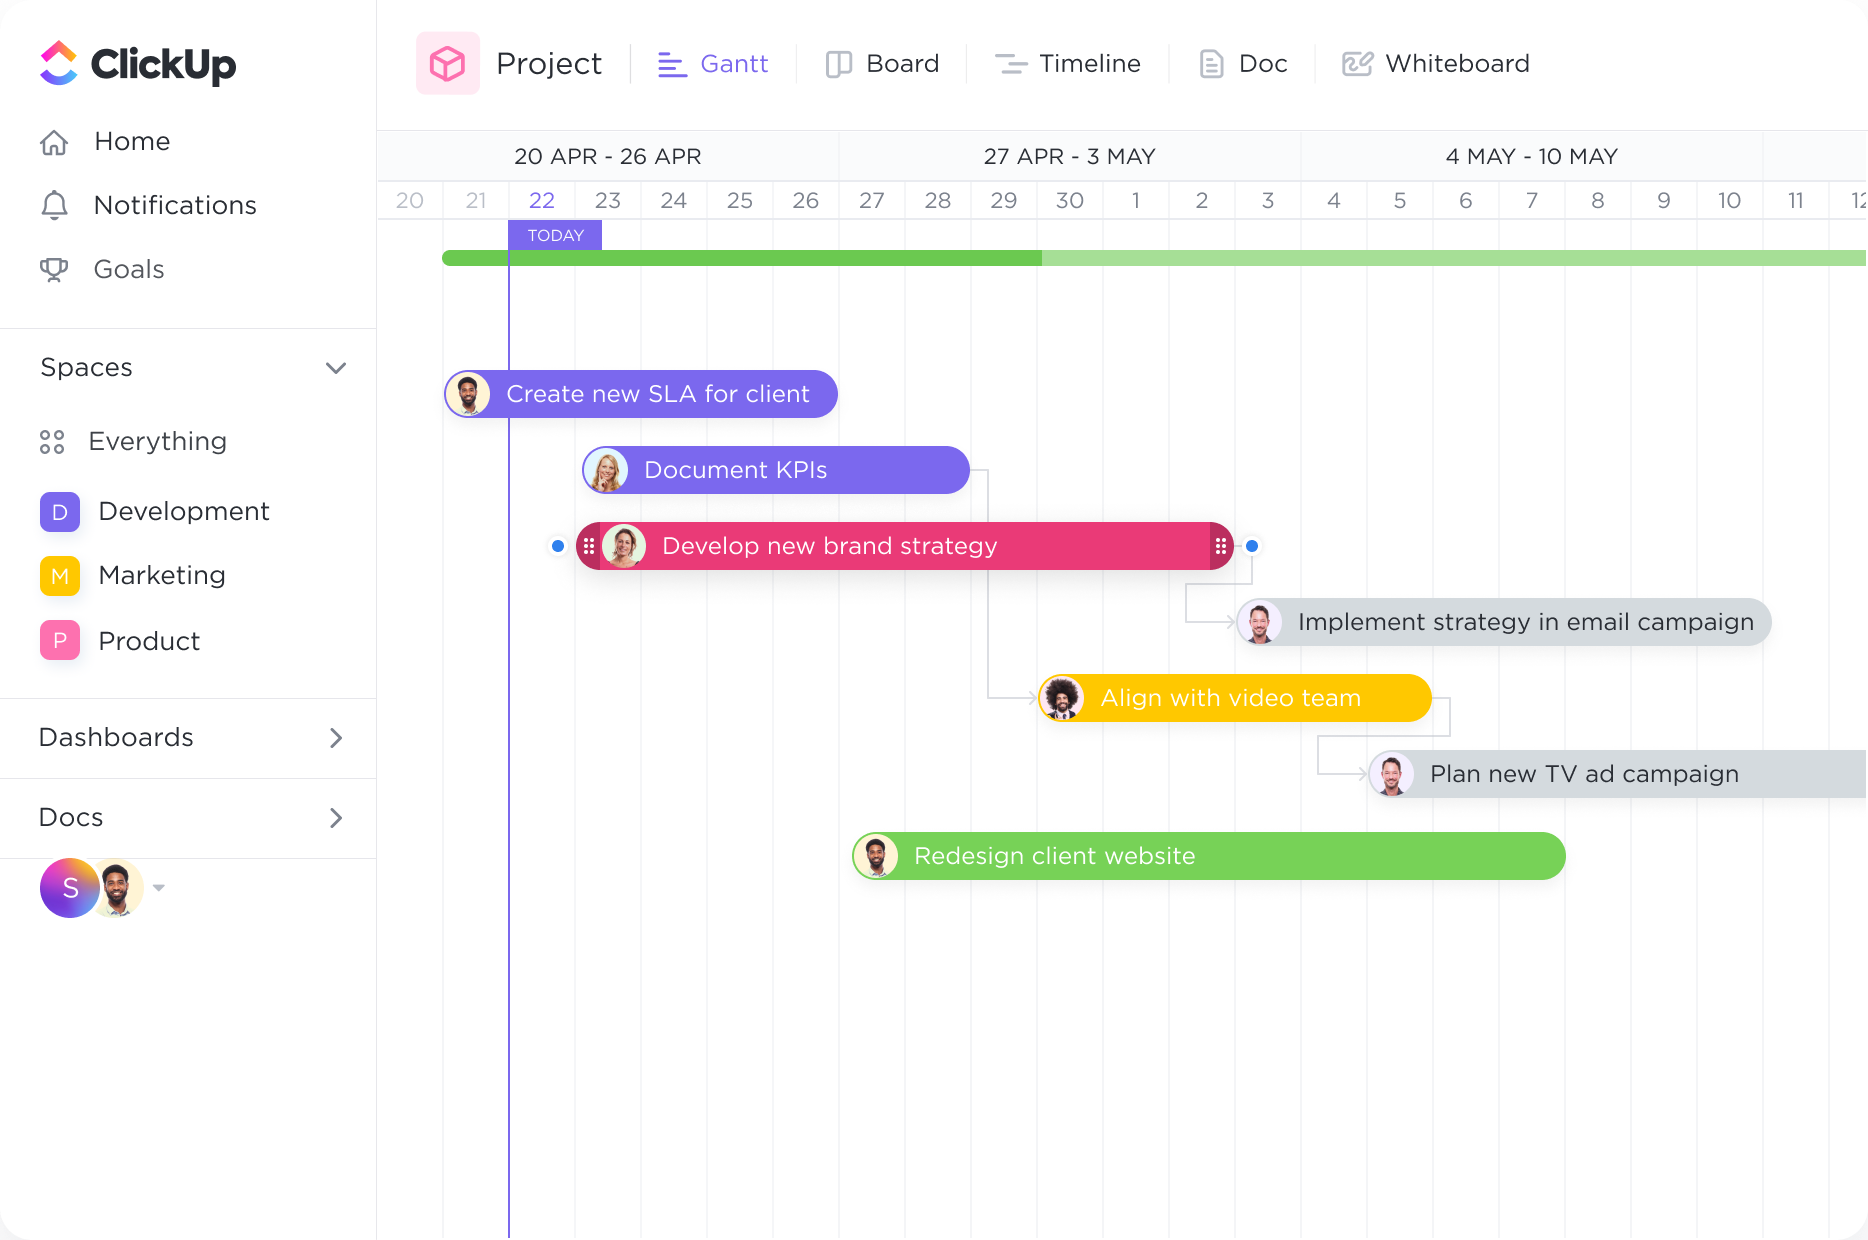
Set task dependencies.
Create tasks and link them with dependencies. Dragging a task with dependencies will automatically reschedule tasks in the chain
Supercharge your project management with ClickUp's cutting-edge Gantt Chart software designed specifically for System Administrators. Streamline your tasks, deadlines, and dependencies with ease, effortlessly visualizing your entire project timeline. With ClickUp's intuitive interface, you can collaborate seamlessly, track progress, and ensure smooth project execution. Don't waste any more time - harness the power of ClickUp's Gantt Chart software and take your project management to the next level.
Free forever.
No credit card.

Trusted by the world’s leading businesses
Create tasks and link them with dependencies. Dragging a task with dependencies will automatically reschedule tasks in the chain
Intelligent dependency-path tracking shows you where potential bottlenecks might exist to prevent inefficiencies.
System administrators often oversee complex projects, such as network upgrades or server migrations. Gantt charts provide a comprehensive overview of project timelines, tasks, and dependencies, allowing administrators to plan and execute projects more efficiently. By visualizing the project scope and deadlines, system administrators can allocate resources, track progress, and ensure timely completion of tasks.
System administrators are responsible for managing various resources, including personnel, equipment, and software licenses. Gantt charts enable administrators to allocate resources effectively by visually representing their availability and utilization. This helps prevent resource bottlenecks, optimize resource allocation, and ensure that the right resources are assigned to the right tasks at the right time.
Implementing changes in an IT environment requires careful planning and coordination. Gantt charts can be used to outline the steps involved in change management processes, such as software updates or system upgrades. By visualizing the sequence of tasks, dependencies, and timelines, system administrators can effectively manage change initiatives, minimize disruptions, and ensure smooth transitions.
System administrators are responsible for maintaining and upgrading IT infrastructure to ensure optimal performance and security. Gantt charts can be used to plan and schedule routine maintenance tasks, such as backups, security patches, and hardware replacements. By visualizing the maintenance schedule, administrators can proactively manage system upgrades, minimize downtime, and mitigate risks.
System administrators need to respond quickly and efficiently to incidents and problems that arise in the IT environment. Gantt charts can be utilized to track and prioritize incident response activities, assign tasks to team members, and monitor progress. This helps administrators streamline the resolution process, ensure timely communication, and minimize the impact of incidents on business operations.
System administrators often need to create and maintain documentation, such as network diagrams, configuration guides, and troubleshooting procedures. Gantt charts can be used to plan and track documentation tasks, ensuring that they are completed within the desired timeframe. By visualizing the documentation process, administrators can prioritize tasks, allocate resources, and ensure the availability of up-to-date documentation for future reference.
Gantt chart software can help system administrators by providing a visual representation of project timelines and task dependencies. It allows for efficient resource allocation, tracking of task progress, and identification of potential bottlenecks. This enables system administrators to prioritize tasks, coordinate with team members, and make informed decisions to ensure timely project completion and effective task management.
Some key features and functionalities to look for in Gantt chart software designed for system administrators include the ability to track and manage IT projects, allocate resources and monitor dependencies, provide real-time updates on project progress, integrate with existing IT tools and systems, offer customizable views and reports, and support collaborative communication among team members.
To maximize the use of Gantt chart software in project management, system administrators can follow best practices such as breaking down tasks into smaller subtasks, setting realistic deadlines, regularly updating and reviewing the Gantt chart, assigning responsibilities clearly, and using color coding and labels for better visualization. Additionally, regularly communicating with team members, tracking progress, and adjusting the Gantt chart as needed will ensure a more efficient and effective project management workflow.