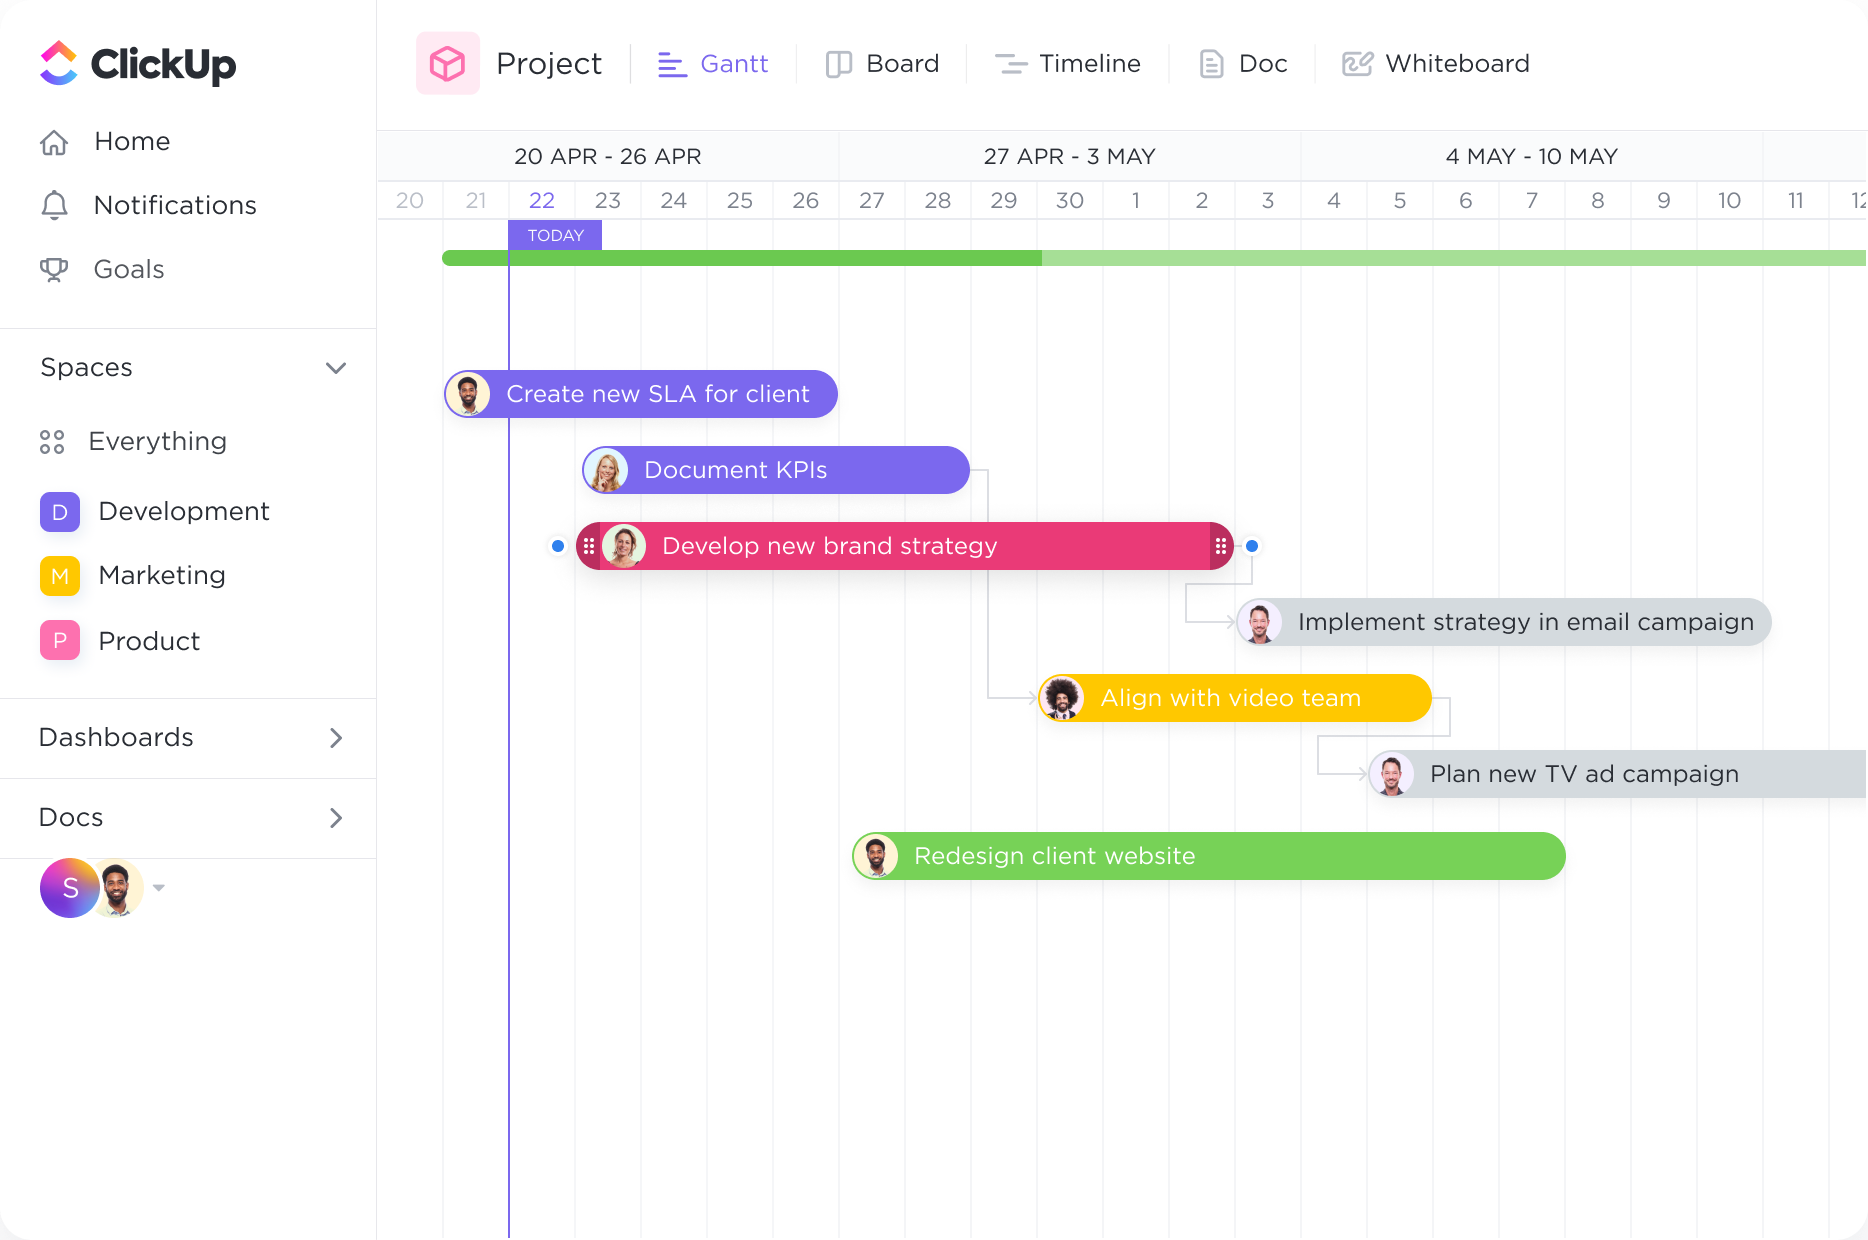
Set task dependencies.
Create tasks and link them with dependencies. Dragging a task with dependencies will automatically reschedule tasks in the chain
Supercharge your support group's productivity with ClickUp's powerful Gantt Chart software. Streamline tasks, deadlines, and resources all in one place, allowing your team to collaborate seamlessly and meet project goals with ease. With ClickUp, you can create customized Gantt Charts that perfectly align with your support group's unique needs, helping you prioritize and visualize tasks for maximum efficiency. Say goodbye to the chaos and hello to organized success with ClickUp's Gantt Chart software.
Free forever.
No credit card.

Trusted by the world’s leading businesses
Create tasks and link them with dependencies. Dragging a task with dependencies will automatically reschedule tasks in the chain
Get a bird's-eye view of all Spaces, Projects, Lists, and tasks in one Gantt chart. With clear coloring options, you can easily see what work is happening and where.

Support groups often hold regular meetings to provide a safe space for individuals to share their experiences and seek support. Gantt charts can be used to plan and schedule these meetings, ensuring that they are organized, consistent, and accessible to all members. By visualizing the meeting dates, topics, and facilitators, support groups can effectively manage their meeting calendar and ensure that everyone is aware of upcoming sessions.
Support groups may have various tasks and responsibilities that need to be assigned and tracked among members. Gantt charts can help support groups allocate tasks, such as organizing events, conducting research, or creating educational materials. By assigning tasks and setting deadlines within the chart, support groups can track the progress of each task, ensuring that responsibilities are evenly distributed and that projects are completed on time.
Support groups often rely on resources such as funding, volunteers, and materials to carry out their activities. Gantt charts can assist in managing and allocating these resources effectively. By visualizing the availability and allocation of resources, support groups can ensure that they are making the most efficient use of their limited resources. This includes managing volunteer schedules, tracking funding allocations, and coordinating the distribution of materials.
Support groups may have specific goals and objectives they want to achieve, such as increasing awareness, providing education, or advocating for change. Gantt charts can help support groups track their progress towards these goals and evaluate their effectiveness. By setting milestones and deadlines within the chart, support groups can monitor their progress and make adjustments as needed to ensure they are on track to achieve their desired outcomes. Additionally, Gantt charts can be used to plan and schedule periodic evaluations to assess the impact and effectiveness of the support group's activities.
Gantt chart software can be used to visually map out support group activities and tasks, allowing for better coordination and prioritization. It helps in identifying dependencies between tasks and allocating resources efficiently. The software also enables tracking of task progress and deadlines, ensuring timely completion. Additionally, it facilitates communication and collaboration among support group members, enhancing overall productivity and efficiency.
There is no specific Gantt Chart software that is recommended for support groups as the choice of software depends on the specific needs and preferences of the group. However, there are many Gantt Chart software options available in the market that offer features and functionalities suitable for support group projects, such as task tracking, resource allocation, and communication tools. It is recommended to evaluate different software options based on the specific requirements of the support group and choose the one that best suits their needs.
Yes, Gantt chart software can help group leaders track progress and deadlines for different projects or initiatives by providing a visual representation of tasks, timelines, and dependencies. It enables the monitoring of project milestones, identifies potential delays, and facilitates resource allocation. This allows group leaders to have a clear overview of the status of each project or initiative and make informed decisions to ensure timely completion.