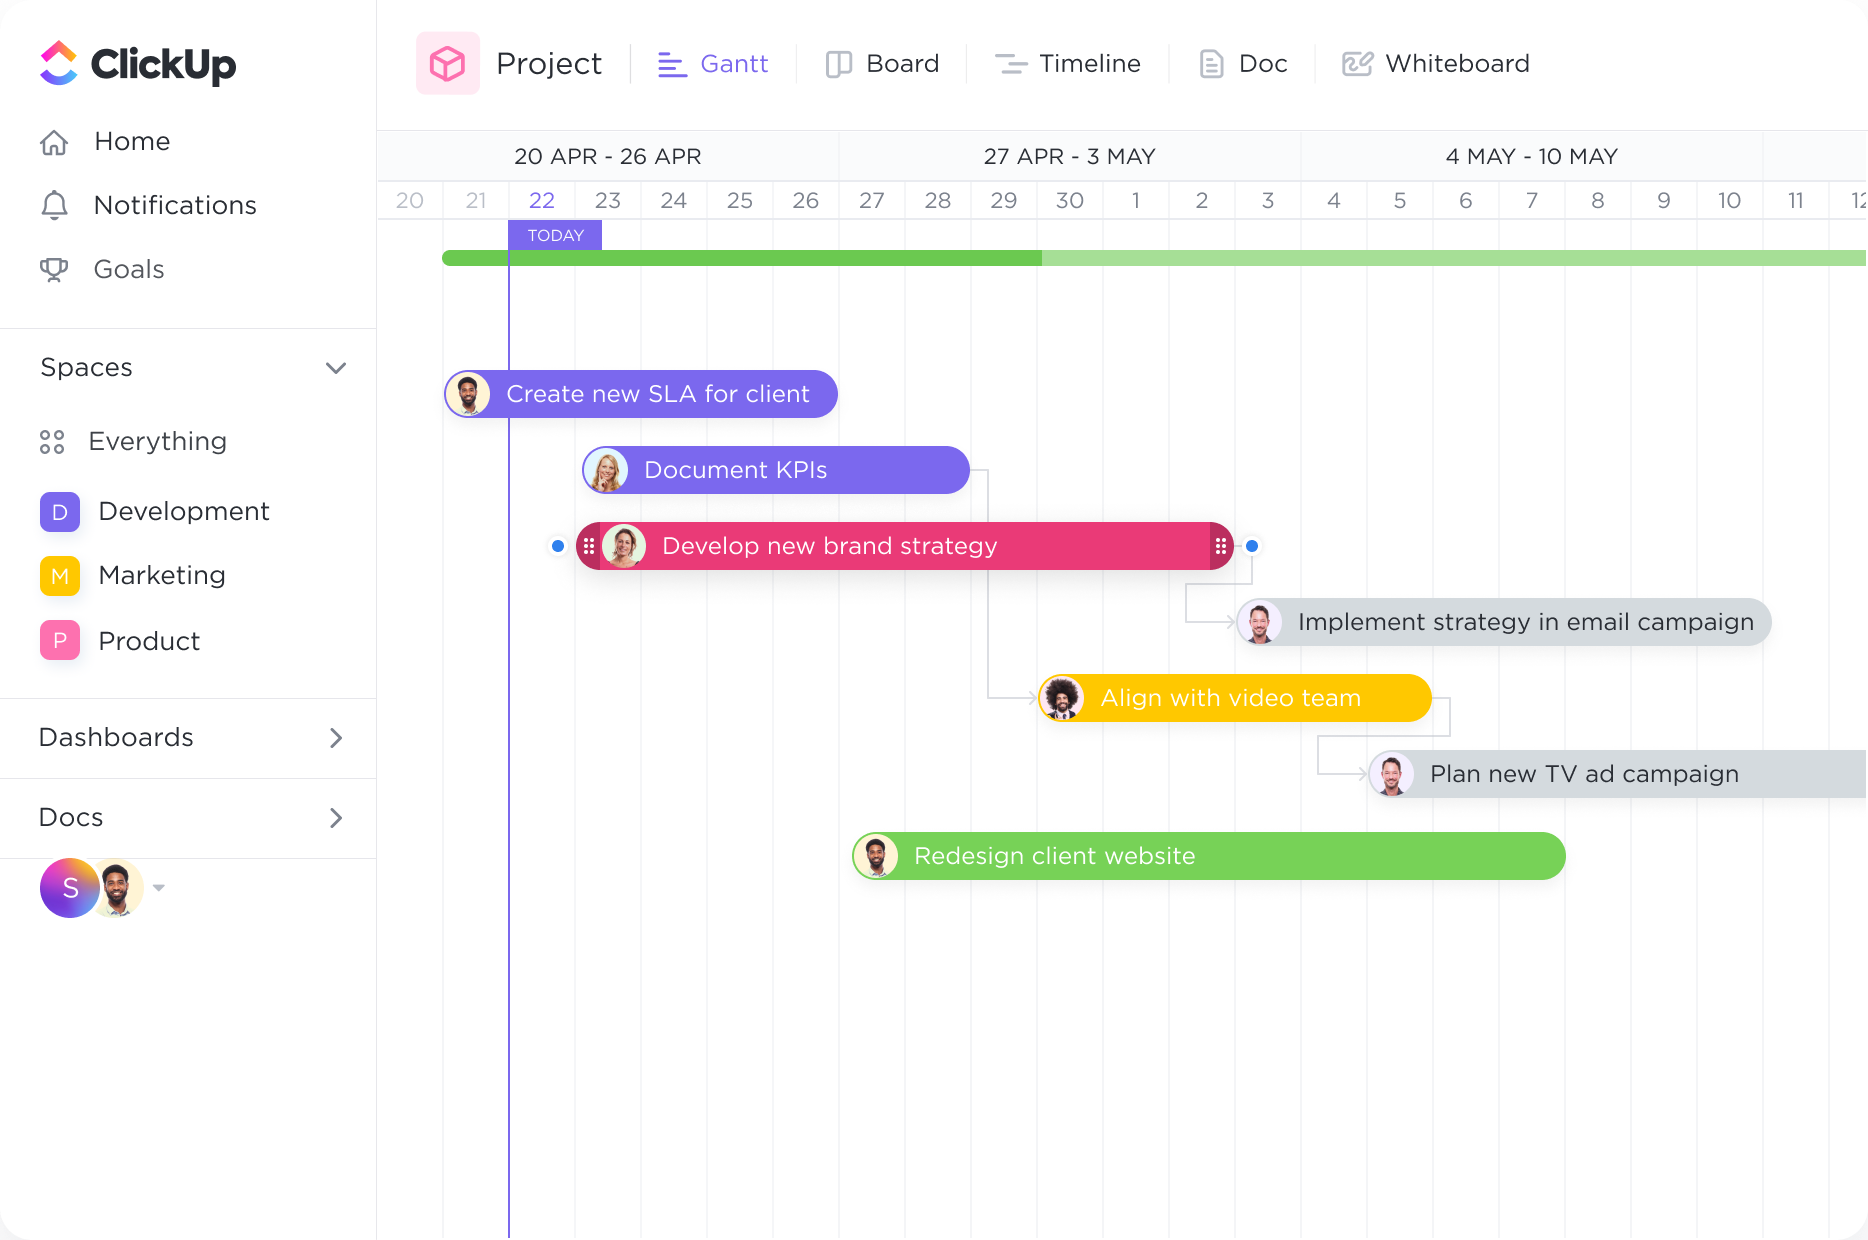
Organize and set priorities.
Organize how you see your tasks with quick sorting. Create cascading views with a single click to easily see what important tasks are coming next.
Supercharge your stock market analysis with ClickUp's powerful Gantt Chart software. Streamline your workflow, track progress, and stay on top of deadlines with ease. Create custom Gantt Charts that are specifically designed for stock market analysts, helping you visualize and manage your projects with precision. Take control of your analysis process and maximize your productivity with ClickUp's Gantt Chart software today.
Free forever.
No credit card.

Trusted by the world’s leading businesses
Organize how you see your tasks with quick sorting. Create cascading views with a single click to easily see what important tasks are coming next.
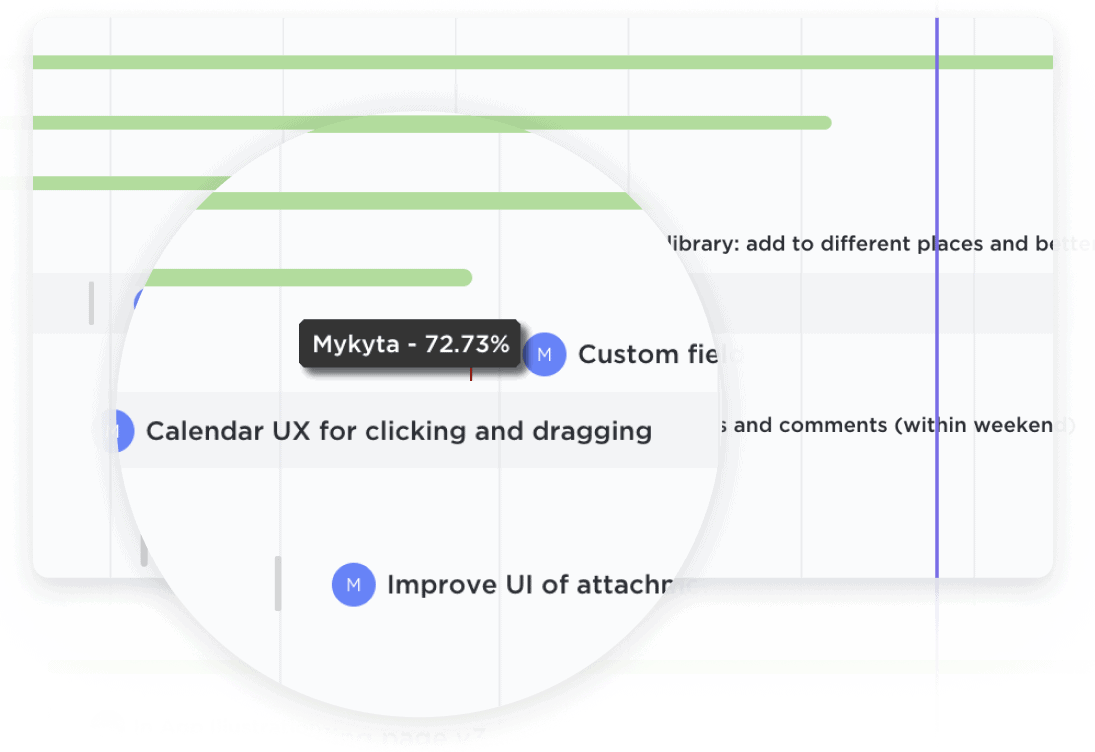
Easily update projects with a simple drag-and-drop action to collaborate amongst your team in real-time. Dynamic progress percentages provide a detailed snapshot.

Stock market analysts often work on multiple research projects simultaneously. A Gantt chart can be used to track the progress of each project, from the initial research phase to the final report. By visualizing project timelines, deadlines, and milestones, analysts can ensure that they stay on track and meet their research objectives in a timely manner.
Stock market analysis often involves collaboration among team members, such as researchers, data analysts, and portfolio managers. A Gantt chart can help allocate tasks among team members and track progress collectively. This promotes effective communication, ensures that everyone is aware of their responsibilities, and allows for better coordination and collaboration within the team.
Stock market analysis requires the efficient management of resources, such as financial data, research tools, and market databases. A Gantt chart can help stock market analysts optimize the use of these resources by scheduling their availability and avoiding conflicts or bottlenecks. This ensures that the necessary resources are allocated appropriately, maximizing productivity and minimizing delays.
In the fast-paced world of stock market analysis, staying on top of market trends and meeting deadlines is crucial. A Gantt chart can be used to monitor important market events, such as earnings releases, economic reports, or regulatory announcements. By incorporating these events into the chart, analysts can prioritize their research tasks and ensure that they are aligned with key market events and deadlines.
Gantt chart software can help stock market analysts in project management by providing a visual representation of project timelines, tasks, and dependencies. It enables the allocation of resources, tracking of progress, and identification of potential bottlenecks. Additionally, it enhances communication and collaboration among team members, ensuring efficient workflow adjustments and timely decision-making.
Yes, Gantt chart software can help stock market analysts track multiple investment portfolios simultaneously by providing a visual representation of each portfolio's timeline and tasks. It enables the tracking of investment activities, such as buying and selling stocks, monitoring market trends, and analyzing portfolio performance. This allows analysts to easily identify potential conflicts or overlaps in their investment strategies, allocate resources effectively, and make informed decisions based on a comprehensive overview of their portfolios.
Gantt Chart software can help stock market analysts by providing a visual representation of trading strategies and timelines. It allows for the mapping out of tasks, dependencies, and milestones, enabling analysts to identify potential bottlenecks and adjust their strategies accordingly. This enhances coordination and communication among team members, ensuring efficient resource allocation and timely execution of trades. Additionally, Gantt charts provide a comprehensive overview of trading activities, facilitating the analysis of performance and the identification of areas for improvement.