Manage all of your projects in one place.
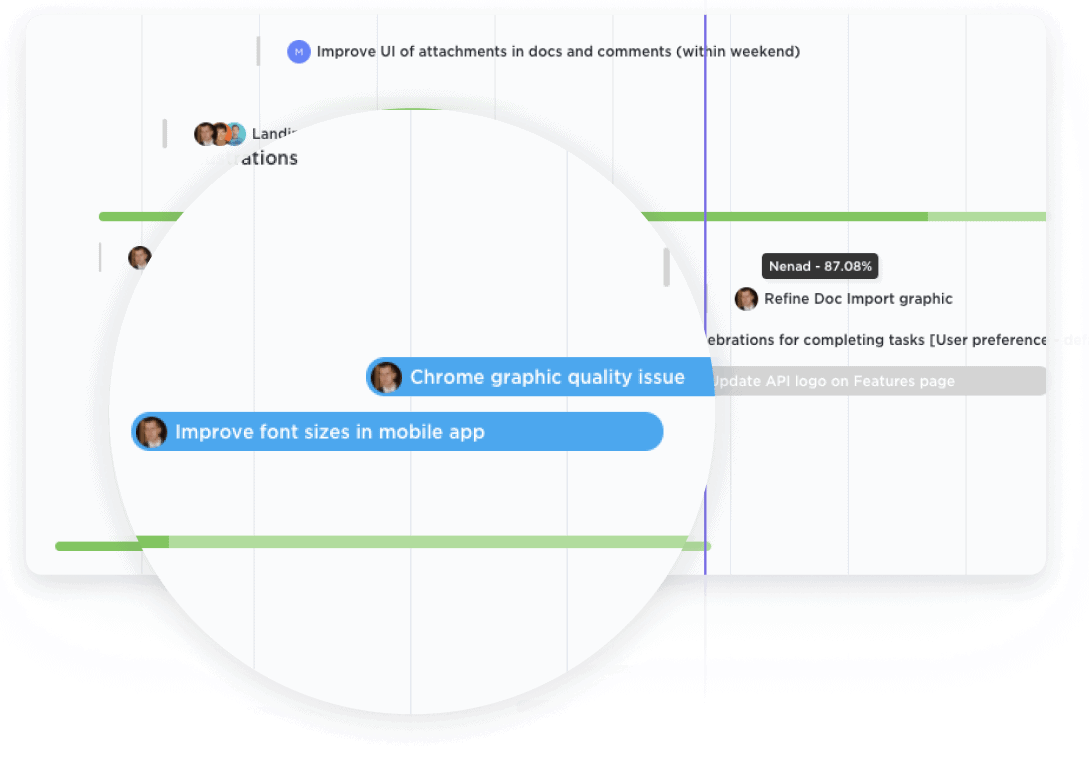
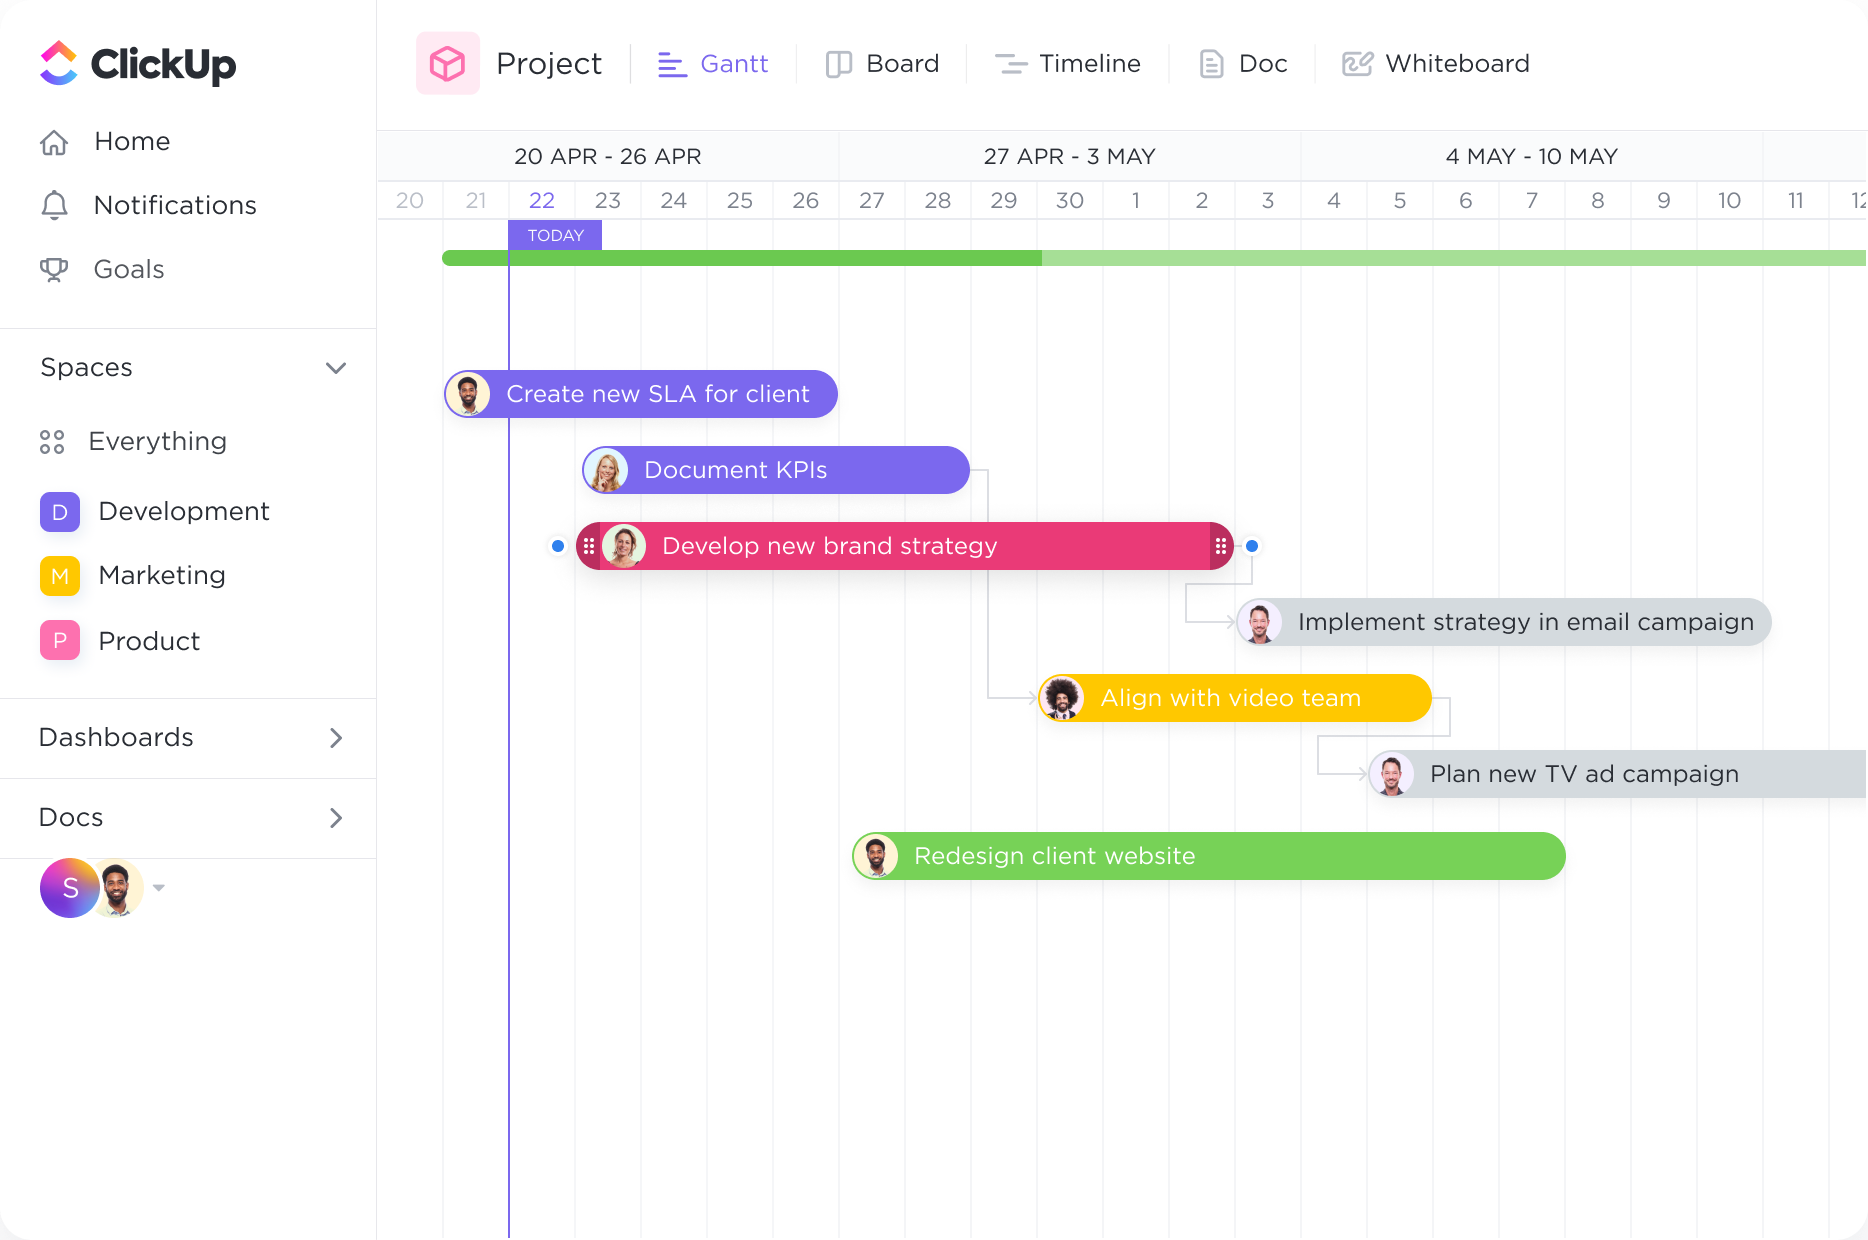
Get a bird's-eye view of all Spaces, Projects, Lists, and tasks in one Gantt chart. With clear coloring options, you can easily see what work is happening and where.

Supercharge your productivity as a seller with ClickUp's cutting-edge Gantt Chart software. Streamline your tasks, collaborate seamlessly, and stay on top of your projects from start to finish. Create personalized Gantt Charts that perfectly align with your unique selling process, helping you track progress, set deadlines, and achieve your goals with ease. Revolutionize the way you manage your projects and boost your sales success with ClickUp's powerful Gantt Chart software.
Free forever.
No credit card.

Trusted by the world’s leading businesses
Get a bird's-eye view of all Spaces, Projects, Lists, and tasks in one Gantt chart. With clear coloring options, you can easily see what work is happening and where.

Organize how you see your tasks with quick sorting. Create cascading views with a single click to easily see what important tasks are coming next.
Gantt charts can be invaluable tools for sellers in managing their sales pipelines. By visualizing the stages of the sales process, from prospecting to closing deals, sellers can easily track and monitor the progress of each opportunity. Gantt charts allow sellers to allocate timeframes for each stage, set deadlines, and identify potential bottlenecks or delays. This helps sellers stay organized, prioritize tasks, and ensure that they are effectively managing their sales pipeline.
In a team selling environment, Gantt charts can facilitate collaboration and task allocation among team members. Sellers can assign specific tasks to team members, set deadlines, and track progress collectively. This promotes transparency, accountability, and efficient workload distribution within the sales team. Gantt charts also enable sellers to identify dependencies between tasks, ensuring that the team is working together seamlessly to achieve sales objectives.
Gantt charts are useful for planning and executing sales campaigns. Sellers can use Gantt charts to outline the various components of a campaign, such as lead generation, content creation, email marketing, and follow-up activities. By assigning tasks, setting deadlines, and visualizing the timeline of the campaign, sellers can ensure that all activities are coordinated and executed in a timely manner. Gantt charts also help sellers track the progress of the campaign and make adjustments if needed.
Gantt charts can assist sellers in setting sales targets and forecasting future sales performance. By analyzing historical data and market trends, sellers can create a Gantt chart that represents their sales goals over a specific period. This allows sellers to track their progress towards the targets and make informed decisions to achieve their sales objectives. Gantt charts provide sellers with a clear visual representation of their sales forecast, helping them stay focused and motivated to reach their goals.
You can use Gantt chart software to visually map out your sales pipeline stages, tasks, and timelines, allowing you to easily track the progress of each opportunity. It enables you to identify potential bottlenecks or delays in the sales process, allocate resources efficiently, and prioritize high-value opportunities. Additionally, it facilitates collaboration and communication among team members by providing a clear overview of the sales pipeline and enabling real-time updates on the status of each opportunity.
Key features to look for in Gantt chart software for sales strategies include the ability to create and manage tasks, set dependencies and deadlines, track progress and milestones, allocate resources, and collaborate with team members in real-time. Additionally, integration with other sales tools and the ability to generate reports and analytics can provide valuable insights for optimizing sales strategies.
Yes, Gantt chart software can help you analyze and optimize your sales team's performance and productivity by providing a visual representation of sales activities, timelines, and dependencies. It allows you to track sales tasks and milestones, identify bottlenecks and inefficiencies, and allocate resources effectively. By providing a clear overview of the sales process, Gantt charts enable you to identify areas for improvement and make data-driven decisions to enhance your sales team's performance.