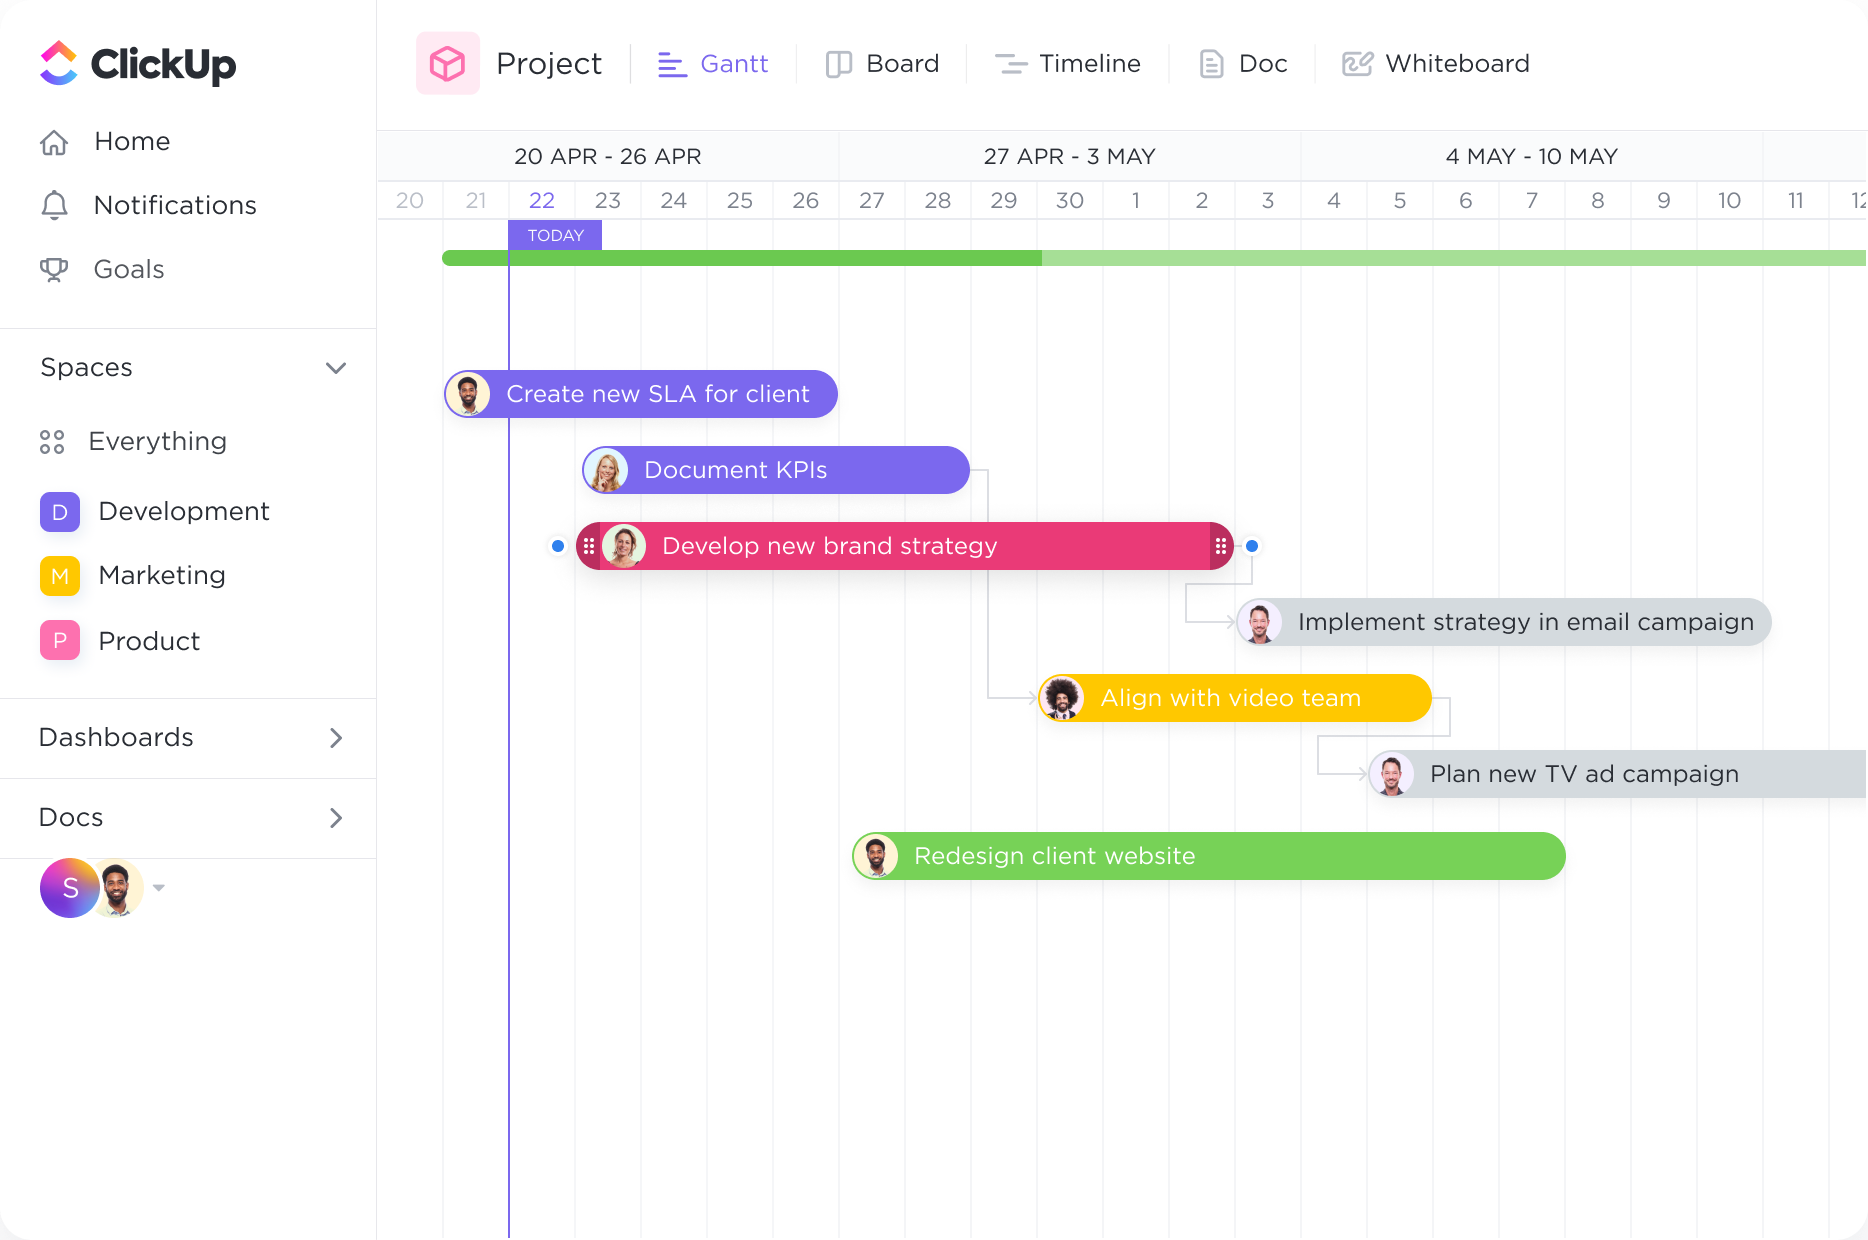
Eliminate bottlenecks before they happen.
Intelligent dependency-path tracking shows you where potential bottlenecks might exist to prevent inefficiencies.
Elevate your project management game with ClickUp's powerful Gantt Chart software. Seamlessly plan, track, and collaborate on your scientific endeavors with precision and ease. Visualize complex timelines, allocate resources efficiently, and stay on top of deadlines like never before. Streamline your research process and unlock your team's potential with ClickUp's Gantt Chart software.
Free forever.
No credit card.

Trusted by the world’s leading businesses
Intelligent dependency-path tracking shows you where potential bottlenecks might exist to prevent inefficiencies.
Create tasks and link them with dependencies. Dragging a task with dependencies will automatically reschedule tasks in the chain
Gantt charts can be used by scientists to plan and track experiments. Each phase of the experiment, such as hypothesis formulation, data collection, analysis, and conclusion, can be represented as a task in the chart. This helps scientists visualize the overall timeline of the experiment, set deadlines for each task, and track the progress of the experiment in real-time.
Scientists often need to submit grant proposals for funding their research projects. Gantt charts can be used to manage the various tasks involved in the proposal preparation process, such as literature review, budget planning, methodology development, and writing. By using a Gantt chart, scientists can ensure that all tasks are completed on time, increasing the chances of a successful grant proposal.
Gantt charts are invaluable for managing collaborative research projects involving multiple scientists or research teams. The chart can be used to allocate tasks to different team members, track their progress, and ensure that all activities are coordinated effectively. This promotes efficient collaboration, reduces the chances of overlapping tasks, and helps the team meet project deadlines.
Scientists often need to analyze and visualize large datasets as part of their research. Gantt charts can be used to plan and schedule the various steps involved in data analysis, such as data cleaning, statistical analysis, and visualization. By visualizing the timeline for each analysis task, scientists can allocate sufficient time for each step, ensuring accurate and timely results.
Publishing research findings is a crucial step for scientists. Gantt charts can be used to plan and track the publication process, including tasks such as manuscript writing, peer review, revisions, and submission. By using a Gantt chart, scientists can ensure that all tasks are completed within the desired timeline, increasing the chances of timely publication and dissemination of their research.
Scientists often present their research findings at conferences or symposiums. Gantt charts can be used to plan and manage the various tasks involved in conference preparation, such as abstract submission, poster or presentation creation, and travel arrangements. By visualizing the timeline for each task, scientists can ensure that they are well-prepared for the event and can meet all deadlines.
Gantt chart software can help scientific projects by providing a visual representation of project timelines, tasks, and dependencies. This allows for better project planning, resource allocation, and task prioritization. It also enables the tracking of project progress and milestones, facilitating effective communication and collaboration among team members. Additionally, Gantt charts can help in identifying potential bottlenecks and adjusting project schedules in real-time, ensuring the timely completion of scientific projects.
Yes, Gantt chart software can help in managing multiple research projects simultaneously by providing a visual representation of project timelines, tasks, and dependencies. It allows for efficient resource allocation, identifies potential scheduling conflicts, and enhances communication among team members. This ensures better coordination, improved productivity, and effective management of multiple research projects.
Yes, it is possible to integrate Gantt chart software with other project management tools commonly used by scientists. This integration allows for seamless data sharing and synchronization between the Gantt chart software and other tools, enabling scientists to have a comprehensive view of their project timelines, tasks, and dependencies. It enhances collaboration, streamlines workflow, and promotes efficient project management practices in scientific research.