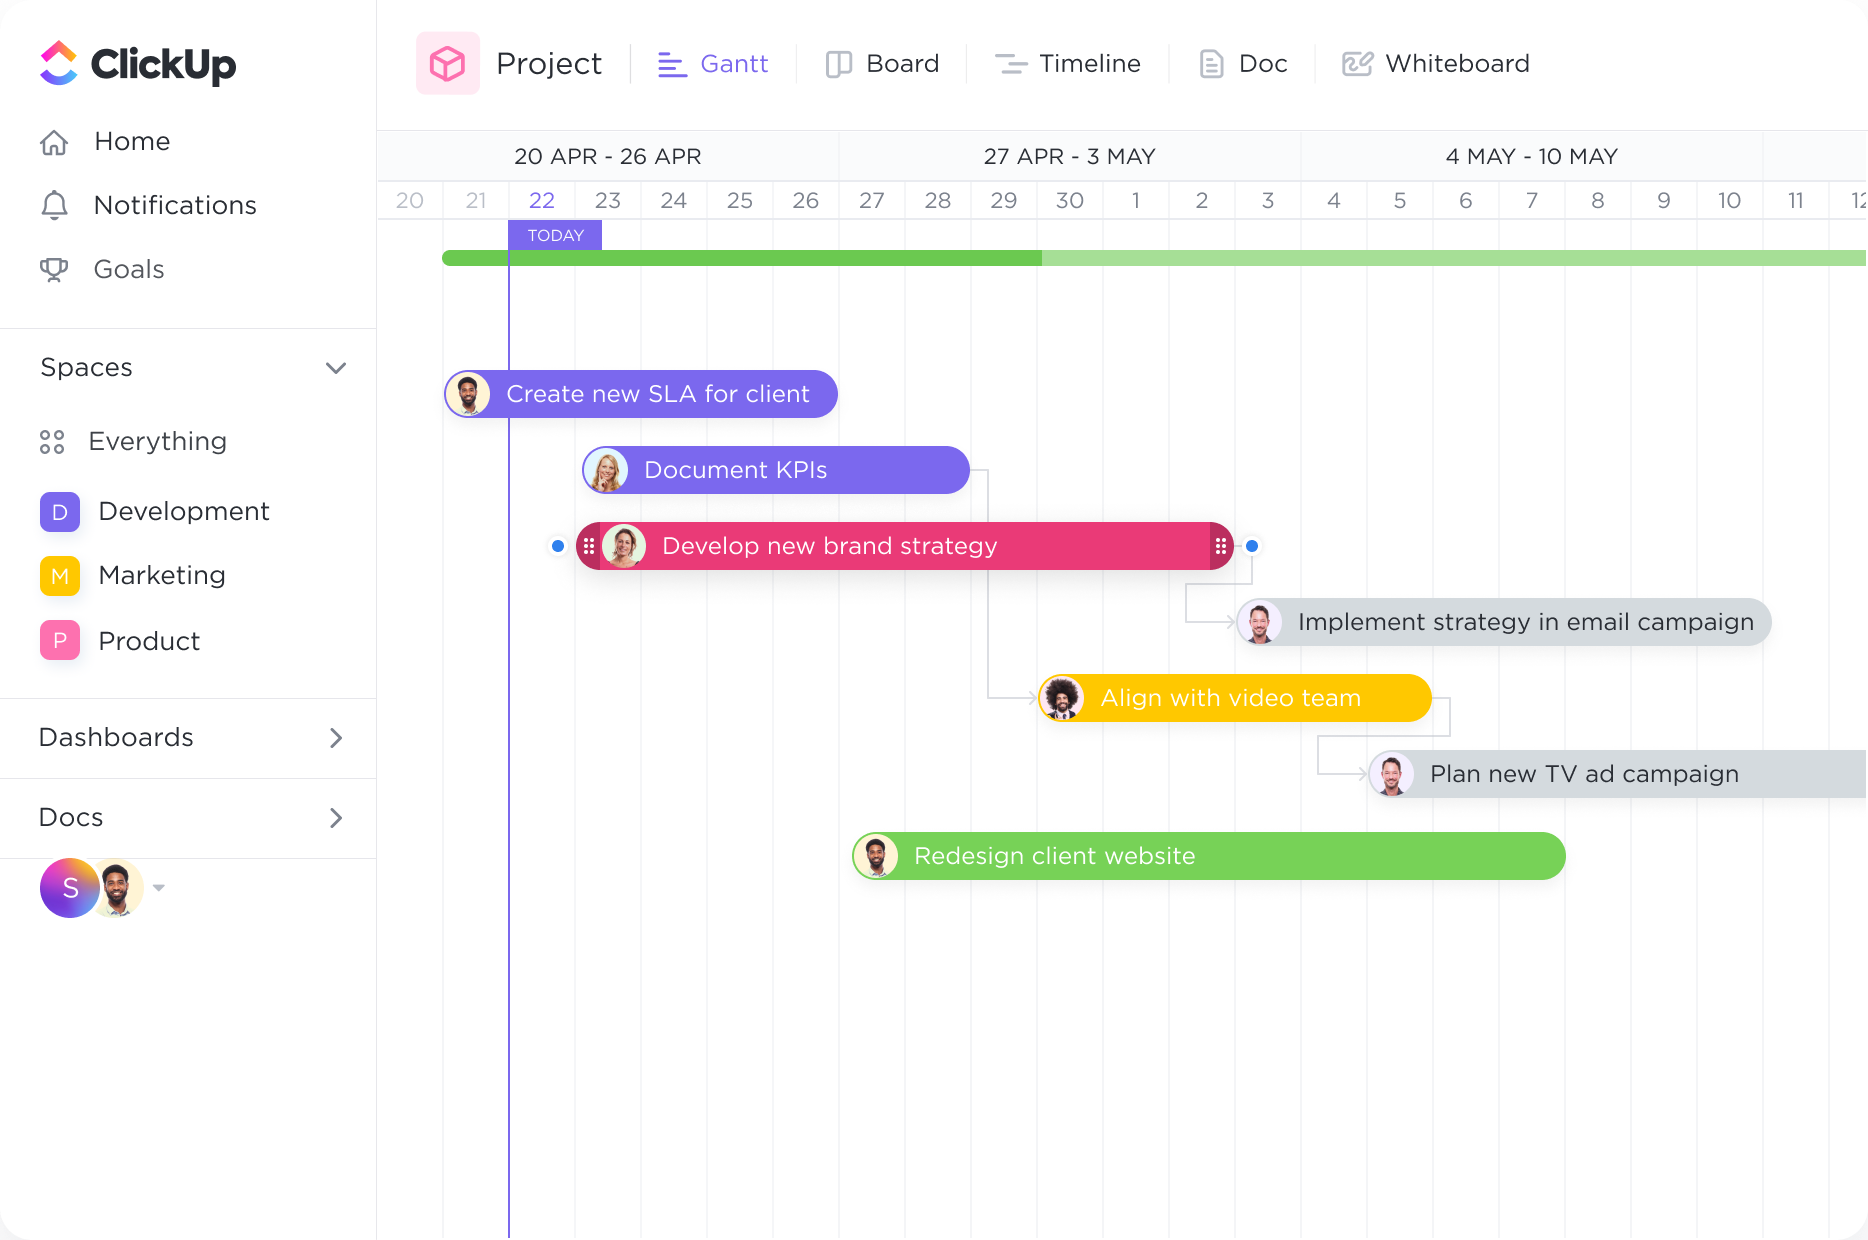
Stay ahead of every deadline.
With the Gantt chart's dynamic timeline, you can easily schedule tasks, keep up with project progress, manage deadlines, and handle bottlenecks.
Streamline your project management process with ClickUp's Gantt Chart software. Create, track, and manage your tasks effortlessly, allowing you to focus on what truly matters - academics. With ClickUp, you can easily visualize your project timelines, set dependencies, and allocate resources, ensuring smooth collaboration and successful project completion. Take control of your academic endeavors with ClickUp's Gantt Chart software today.
Free forever.
No credit card.

Trusted by the world’s leading businesses
With the Gantt chart's dynamic timeline, you can easily schedule tasks, keep up with project progress, manage deadlines, and handle bottlenecks.
Intelligent dependency-path tracking shows you where potential bottlenecks might exist to prevent inefficiencies.
Gantt charts can be incredibly useful for scholars involved in planning and scheduling academic programs. Whether it's designing a new course, organizing a conference, or coordinating a workshop series, a Gantt chart can provide a clear overview of the entire program timeline. It helps scholars visualize the sequence of events, allocate tasks, and ensure that all necessary steps are completed within the desired timeframe.
Scholars often need to manage multiple grant proposals simultaneously, each with its own set of tasks and deadlines. A Gantt chart can help scholars stay organized by outlining the various stages of the proposal process, such as literature review, data collection, analysis, and report writing. By visualizing the critical path and dependencies, scholars can effectively allocate resources and track progress, increasing their chances of securing funding.
Collaborative research projects involve scholars from different disciplines and institutions, making coordination and communication essential. Gantt charts provide a centralized platform for scholars to allocate tasks, set deadlines, and track progress collectively. By visualizing the interdependencies between different research activities, scholars can identify potential bottlenecks and ensure seamless collaboration throughout the project.
For scholars working on their thesis or dissertation, a Gantt chart can be a valuable tool for planning and managing the entire research process. It helps break down the work into smaller tasks, such as literature review, data collection, analysis, and writing, and assigns realistic timelines to each stage. By visualizing the progress and deadlines, scholars can stay on track and complete their research within the desired timeframe.
Presenting research findings at conferences is a crucial part of scholarly communication. A Gantt chart can assist scholars in managing the preparation of conference papers by outlining the key steps involved, such as literature review, data analysis, writing, and revisions. By assigning specific deadlines to each task, scholars can ensure that the paper is ready for submission well in advance of the conference.
Publishing research findings in scholarly journals requires careful planning and adherence to submission deadlines. Scholars can use Gantt charts to map out the entire publication process, including manuscript writing, revisions, peer review, and final submission. By visualizing the timeline and tracking progress, scholars can effectively manage their publications and increase their chances of timely and successful submissions.
Gantt chart software can help you visually plan and manage your research project timeline. It allows you to break down your project into tasks, set dependencies, and allocate resources. With a clear timeline view, you can track progress, identify potential delays, and adjust schedules as needed. This enables you to stay organized, prioritize tasks, and ensure timely completion of your research project.
Yes, Gantt chart software can be integrated with other project management tools commonly used by scholars, such as task management platforms, collaboration tools, and time tracking software. This integration allows for seamless data transfer, real-time updates, and enhanced collaboration among team members, making project management more efficient and streamlined.
Yes, Gantt chart software can help you track and visualize the dependencies between different research tasks and milestones. It allows you to map out the sequence of tasks and their interdependencies, enabling you to easily identify any potential bottlenecks or delays. By visualizing these dependencies, you can effectively manage and prioritize your research tasks, ensuring a smooth workflow and timely completion of milestones.