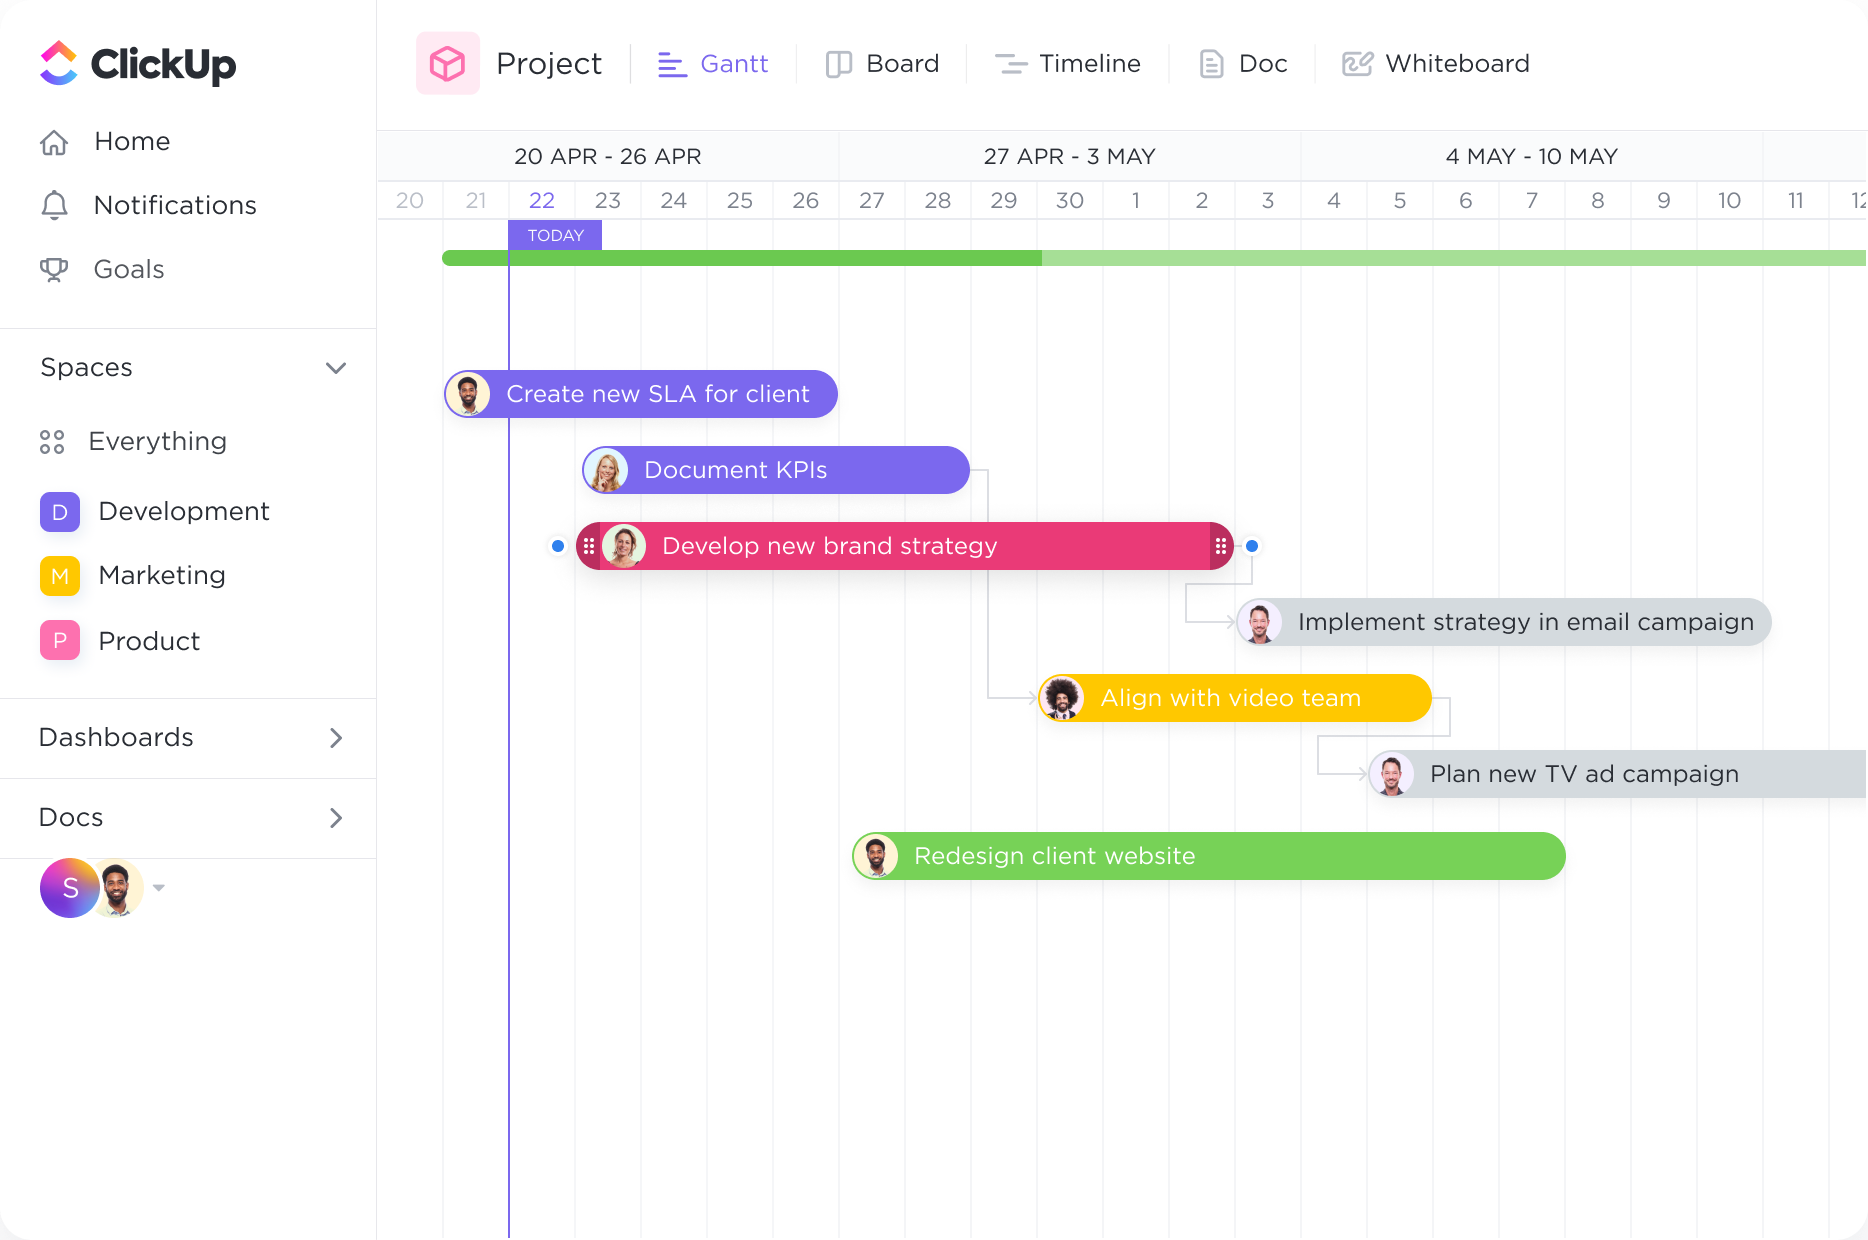
Set task dependencies.
Create tasks and link them with dependencies. Dragging a task with dependencies will automatically reschedule tasks in the chain
Supercharge your risk management process with ClickUp's powerful Gantt Chart software. Streamline your projects and stay ahead of potential risks with our intuitive interface and customizable features. Visualize every task, deadline, and resource allocation in one place, making it easy to identify bottlenecks and mitigate potential threats. Take control of risk management like never before with ClickUp's Gantt Chart software.
Free forever.
No credit card.

Trusted by the world’s leading businesses
Create tasks and link them with dependencies. Dragging a task with dependencies will automatically reschedule tasks in the chain
Organize how you see your tasks with quick sorting. Create cascading views with a single click to easily see what important tasks are coming next.
Gantt charts can be used by risk managers to visually identify and assess potential risks within a project or organization. By plotting out the project timeline and tasks, risk managers can analyze each task's potential risks and their impact on the overall project. This allows for a comprehensive understanding of potential threats and helps in developing risk mitigation strategies.
Once risks have been identified and assessed, risk managers can use Gantt charts to plan and implement risk mitigation strategies. By allocating specific tasks and timelines for risk mitigation activities, risk managers can ensure that necessary actions are taken to minimize the impact of potential risks. Gantt charts provide a clear overview of the entire risk mitigation process, helping in effective planning and execution.
Gantt charts are valuable tools for risk managers to monitor and track the progress of risk mitigation activities. By updating the chart with real-time information on completed tasks and ongoing risk mitigation efforts, risk managers can easily track the status of each risk and its corresponding mitigation plan. This enables proactive risk management and ensures that risks are being addressed in a timely manner.
In the event that a risk materializes, risk managers can utilize Gantt charts to develop contingency plans and coordinate response efforts. By incorporating contingency tasks and timelines into the chart, risk managers can ensure that appropriate actions are taken promptly. Gantt charts provide a visual representation of the contingency plan, facilitating effective communication and coordination among stakeholders.
Gantt charts can be used by risk managers to communicate and report on risk-related information to stakeholders. By presenting the project timeline, tasks, and associated risks in a visual format, risk managers can effectively convey the status of risk management efforts. Gantt charts provide a comprehensive overview of the risk landscape, enabling stakeholders to make informed decisions and take necessary actions.
Gantt charts can also be utilized by risk managers for performance evaluation and capturing lessons learned. By analyzing the progress and outcomes of risk mitigation activities, risk managers can assess the effectiveness of their strategies and identify areas for improvement. Gantt charts serve as a valuable reference for evaluating the overall risk management process and capturing insights for future projects.
You can use Gantt charts to visually mapping out project timelines and dependencies, enabling the early identification of potential schedule conflicts and bottlenecks. It allows for the assessment of the impact of risks on project timelines and the allocation of buffer times. Moreover, it facilitates the tracking of mitigation efforts and their outcomes, ensuring a comprehensive overview of risk management efforts in real-time, thus enabling proactive adjustments and decision-making.
Yes, Gantt chart software can be integrated with other risk management tools to provide a comprehensive risk management solution. By combining Gantt charts with risk management software, you can visualize project timelines, dependencies, and potential risks all in one platform. This integration allows for the identification, assessment, and tracking of risks throughout the project lifecycle, enhancing the overall risk management process and enabling proactive decision-making.
Gantt chart software designed for risk management activities offers features such as risk identification and assessment, risk mitigation planning, and tracking of mitigation efforts. It also allows for the visualization of risk impacts on project timelines and resources, facilitates communication and collaboration among team members, and provides real-time monitoring and reporting of risk management activities.